Search and Analysis
Baixar
Modo Foco
Tamanho da Fonte
This document describes how to query logs from onboarded products using the search and analysis module. It supports two modes: statement search and filter search, and allows switching between raw data view and table view.
Feature Overview
It provides a unified query portal, supporting unified analysis and search of logs from onboarded products.
Prerequisites
1. An account that has purchased the Log Analysis Service.
2. The current logged-in account is an account that has been granted shared storage capacity.
Note:
In multi-account scenarios, the Log Analysis Service supports storage capacity sharing. For details, see the Multi-Account Configuration - Log Analysis Capacity Sharing section in the operation guide.
Operation Steps
1. Log in to the CSC console. In the left-side navigation pane, click Log analysis.
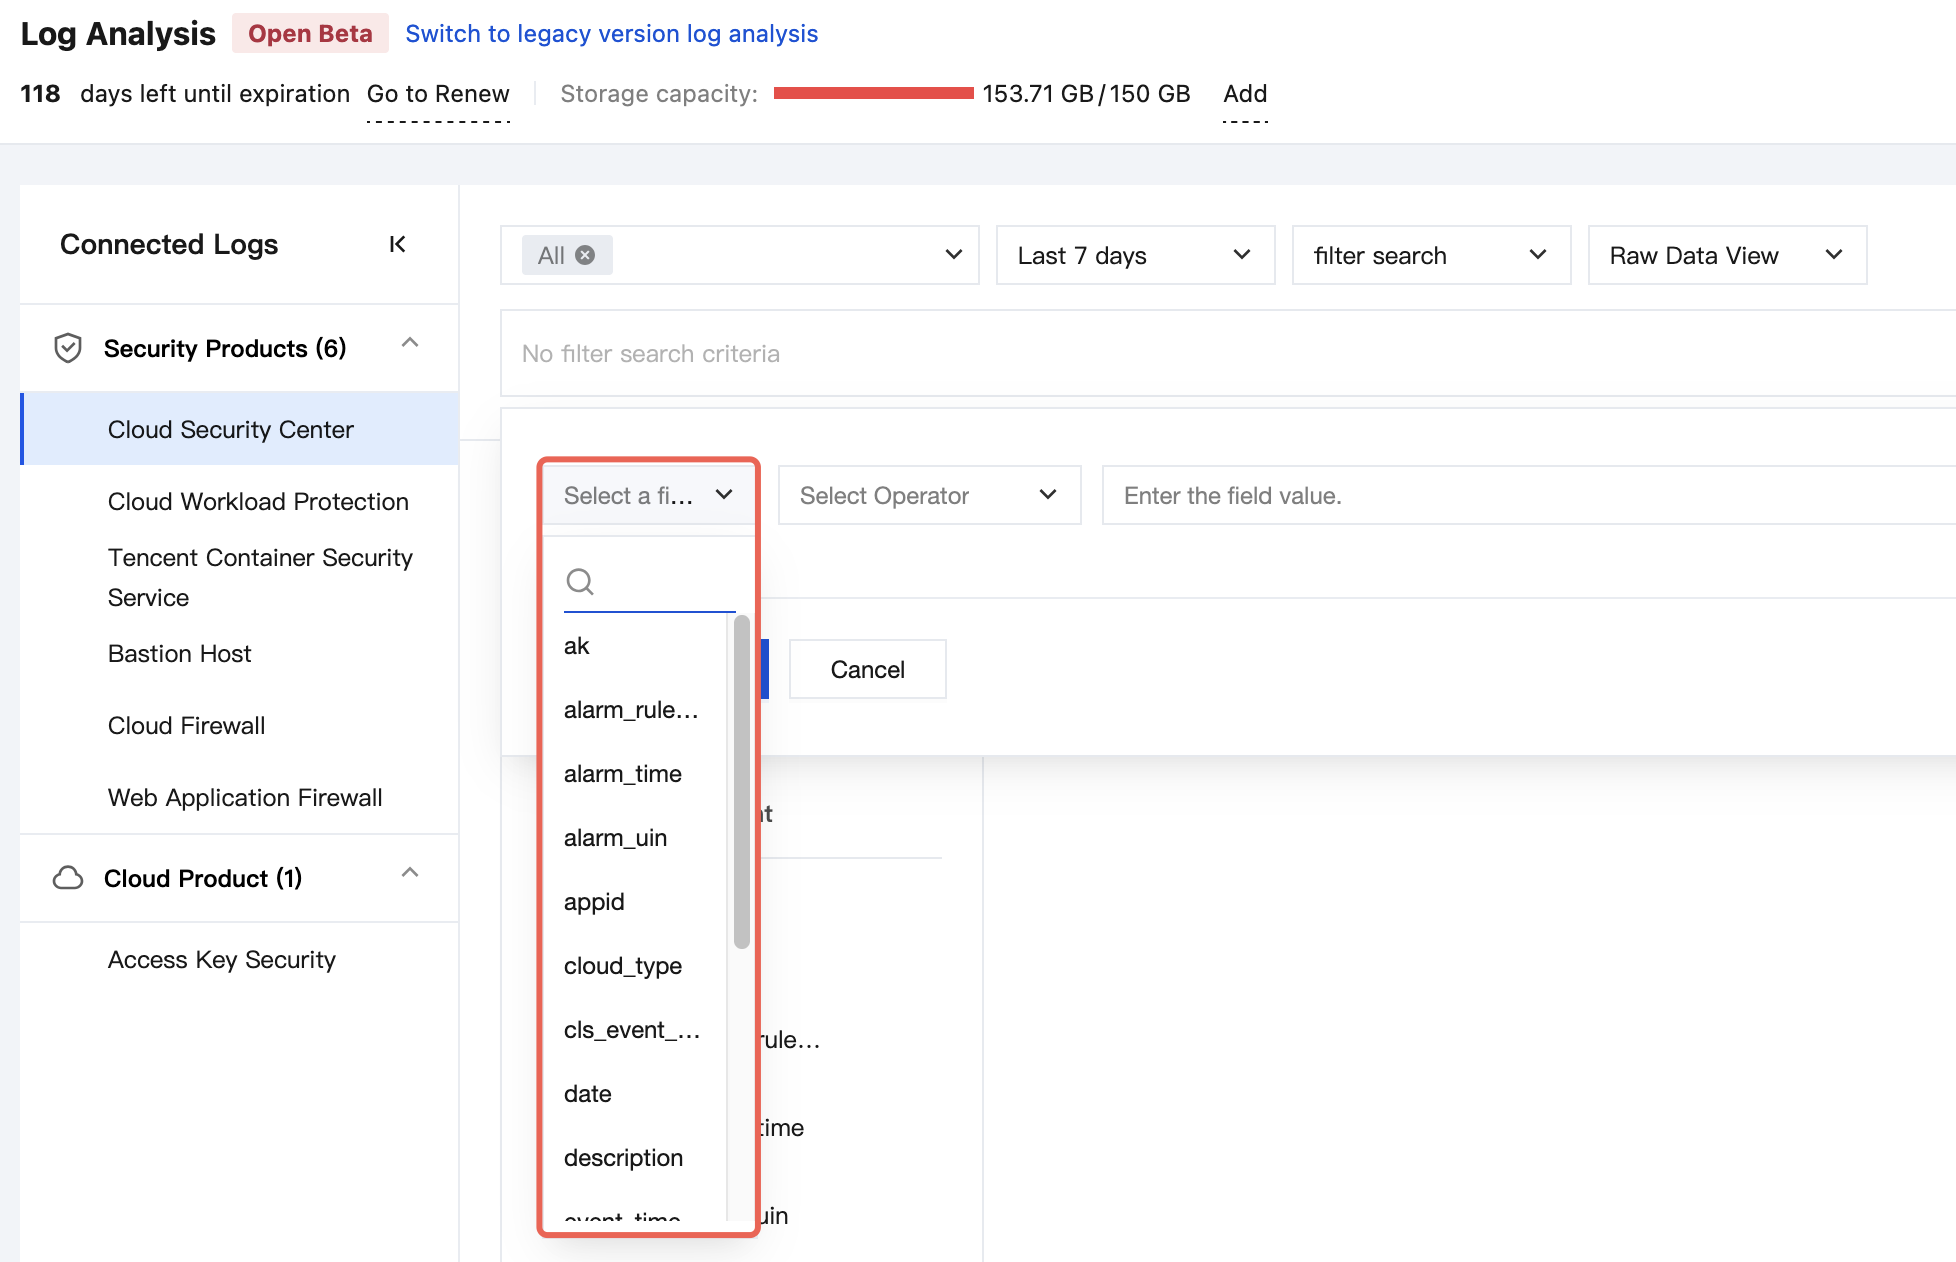
2. On the Log Analysis page, a list of onboarded cloud products is displayed on the left. Select the target product you want to query (such as CSC, CWPP, and CFW).
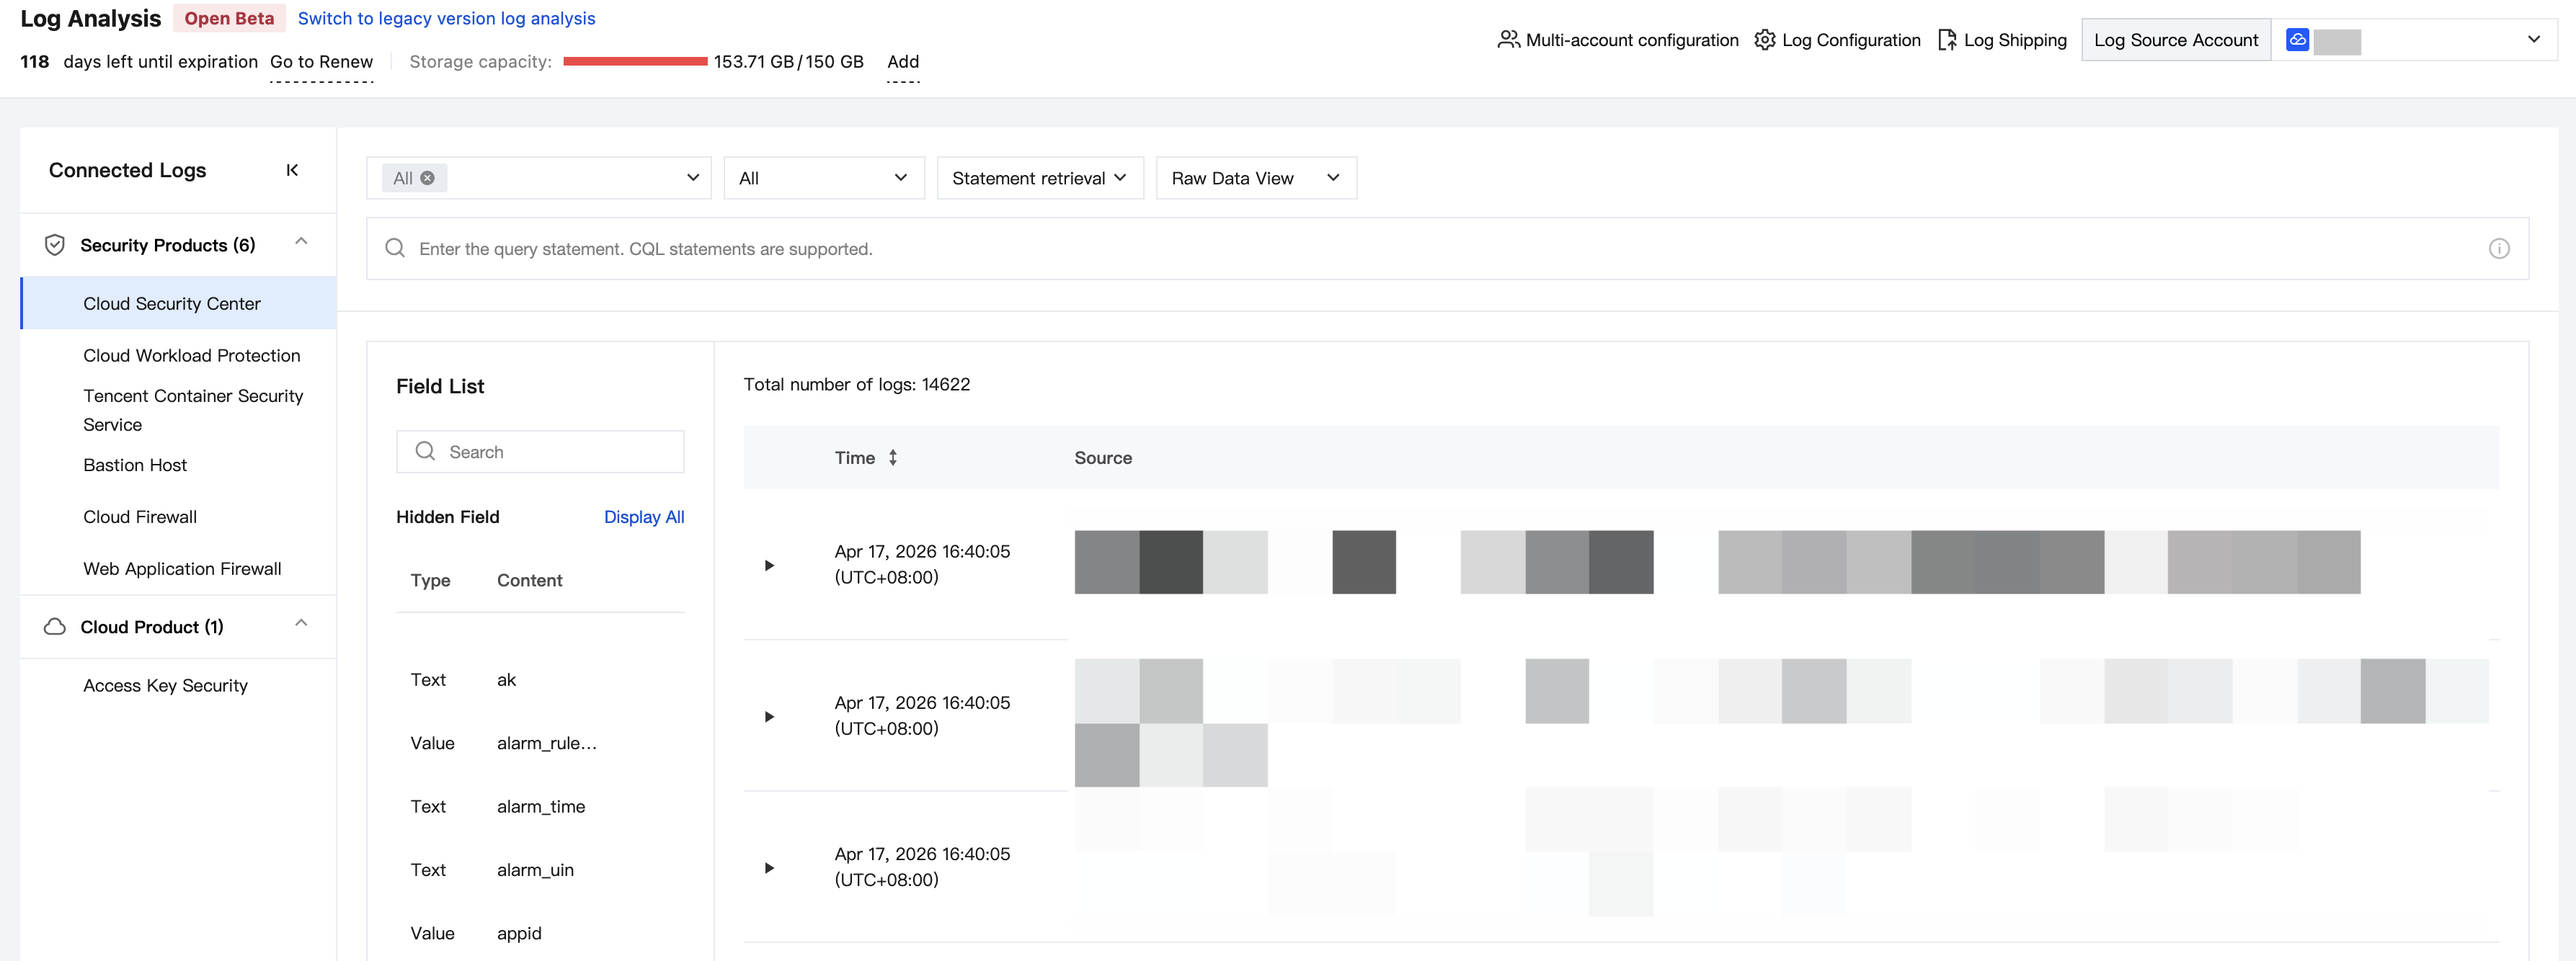
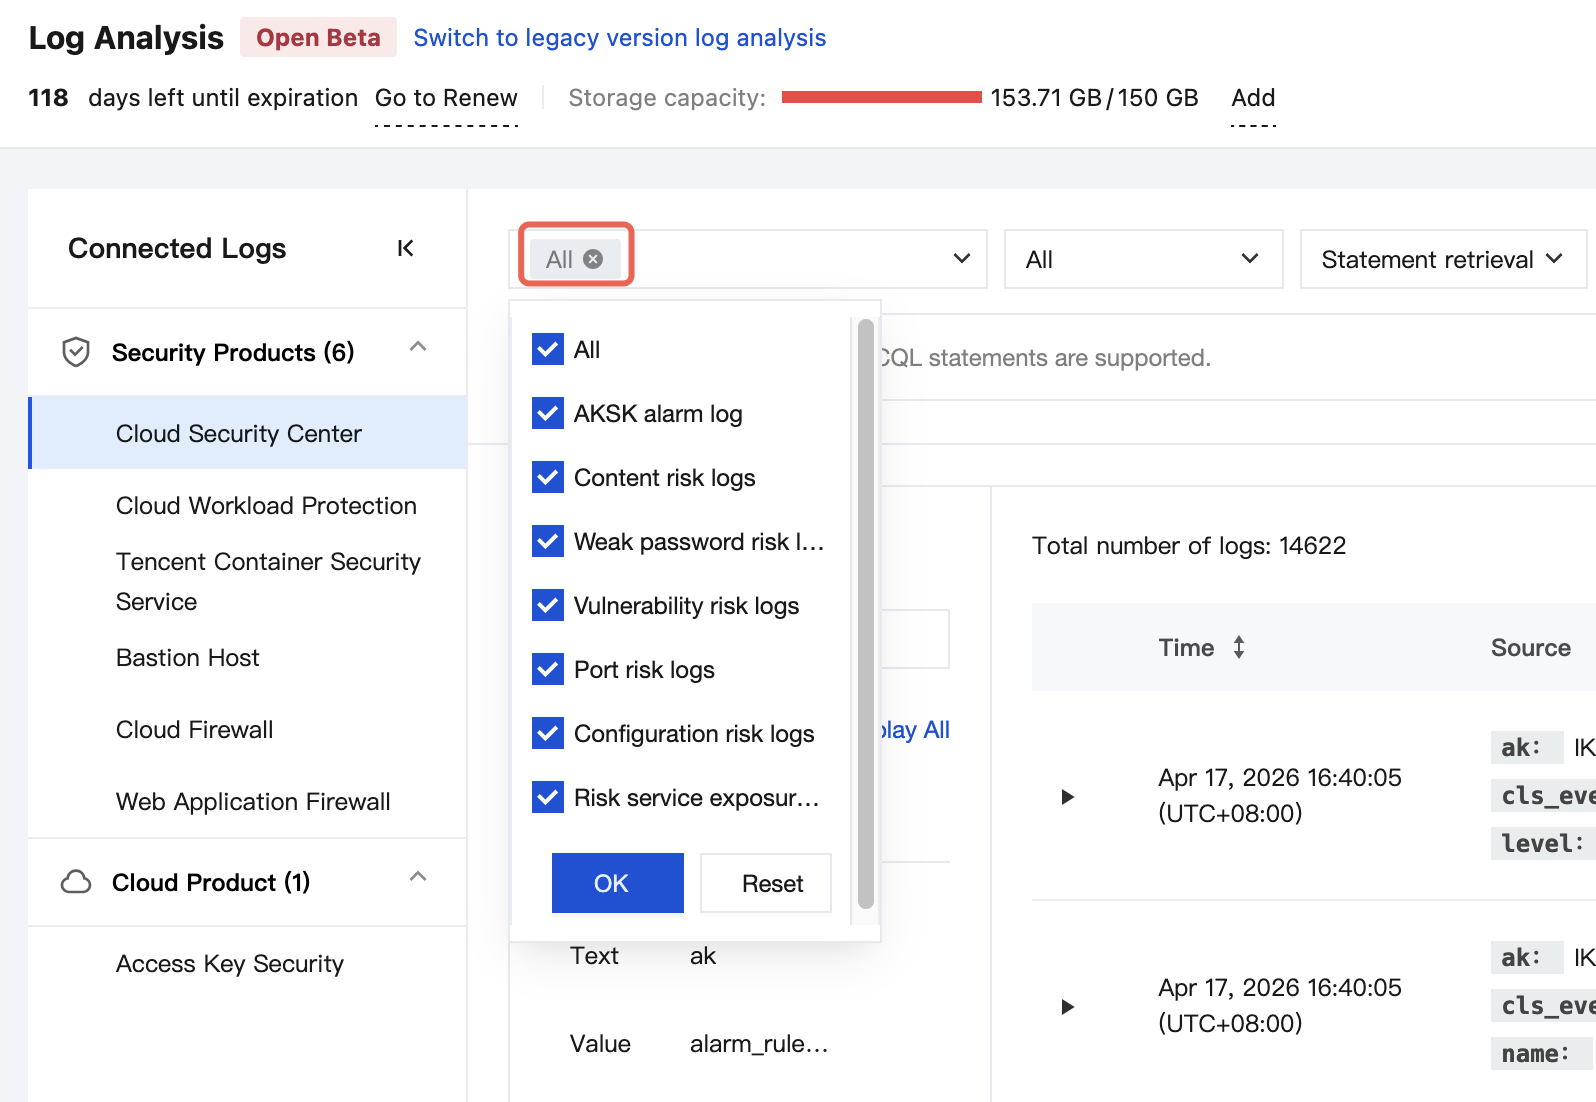
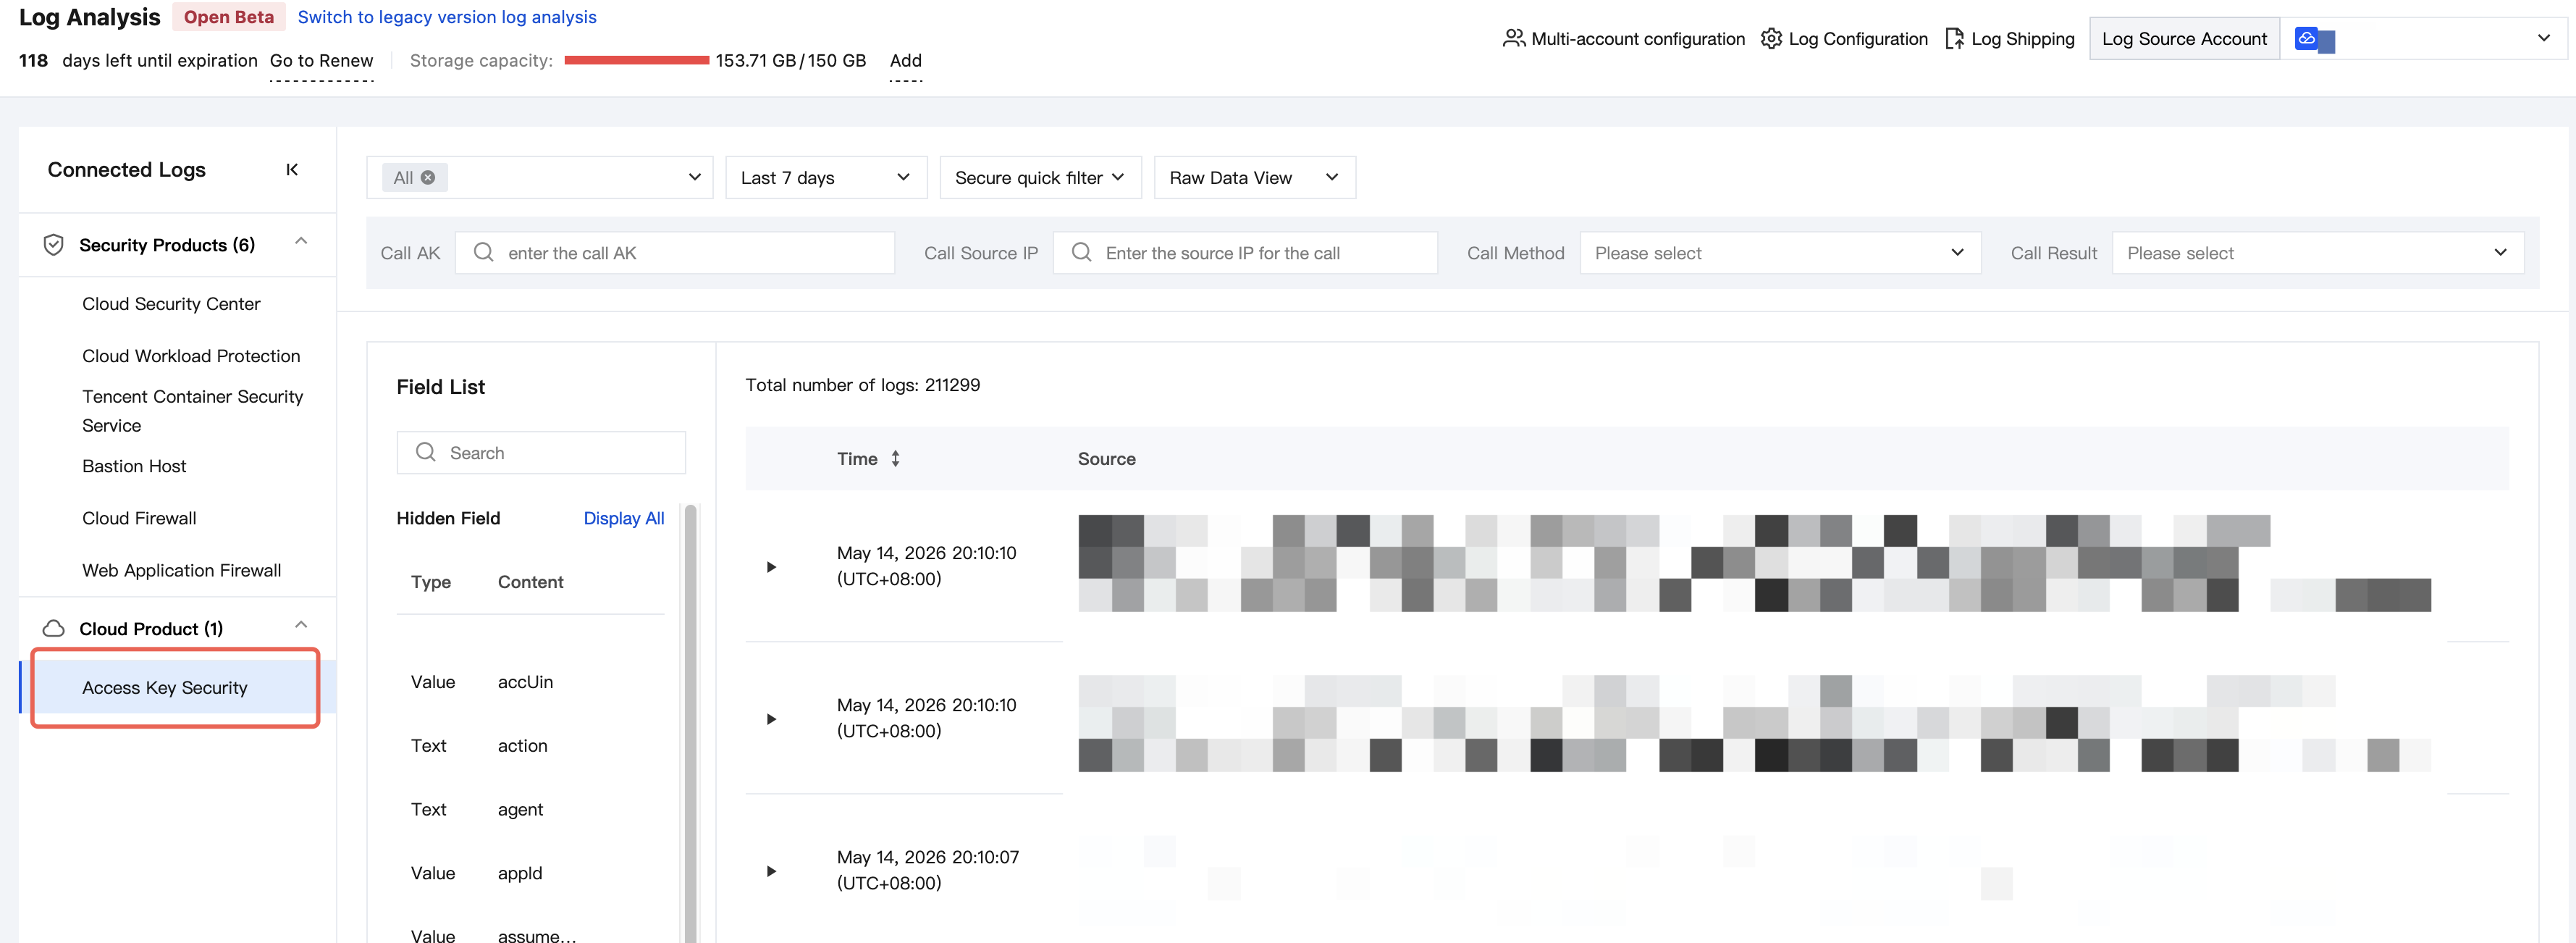
3. Log type selection for queries: This feature supports querying log data of specified types. By default, logs of all types are selected. Security products currently support log type selection. For cloud products, key fields are listed directly to facilitate filtering.
Select log types for security products.
Select log types for cloud products.
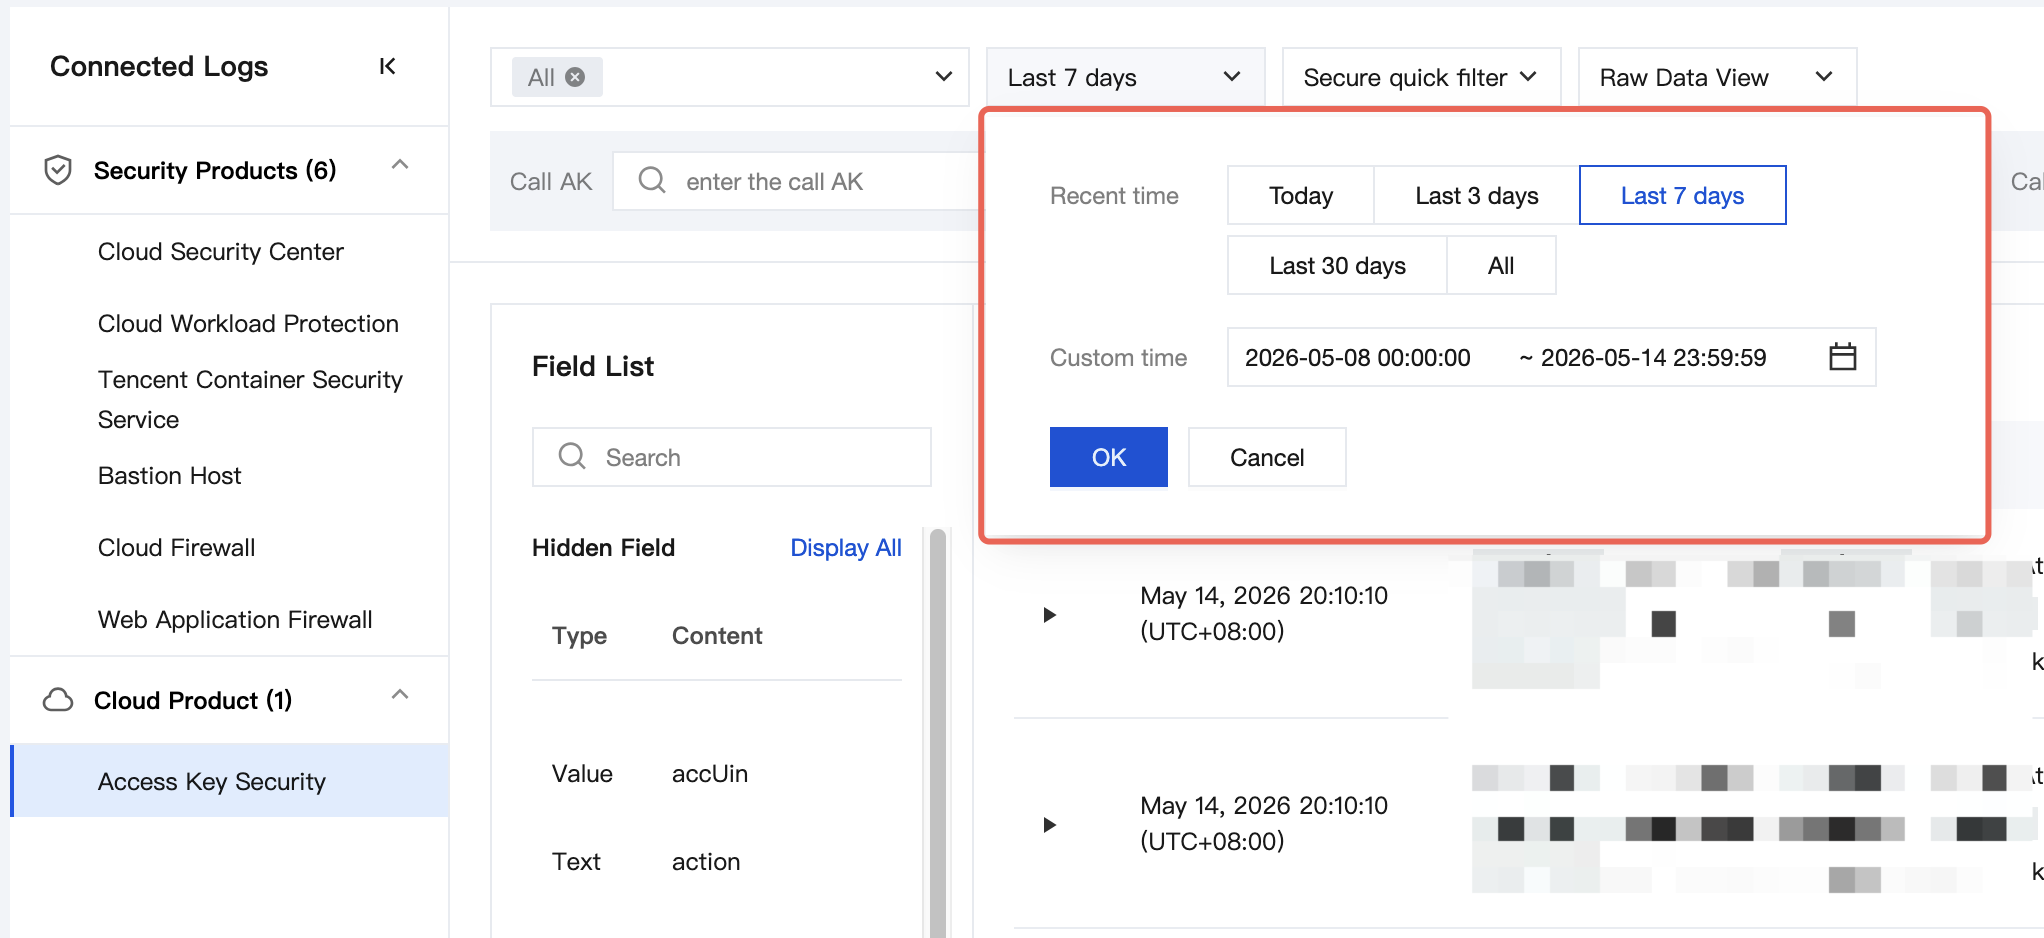
4. Select the time range for the search: Click the time selector at the top to quickly select a preset range such as "Today", "Last 3 days", "Last 7 days", or "Last 30 days". You can also specify a custom start and end time.
5. Select a search mode. It supports statement search and filter search. For CQL syntax rules, see CQL Syntax Rules.
Statement search: Enter a query statement in the search bar. It supports CQL syntax and enables precise searches and complex analysis with multi-condition combinations.
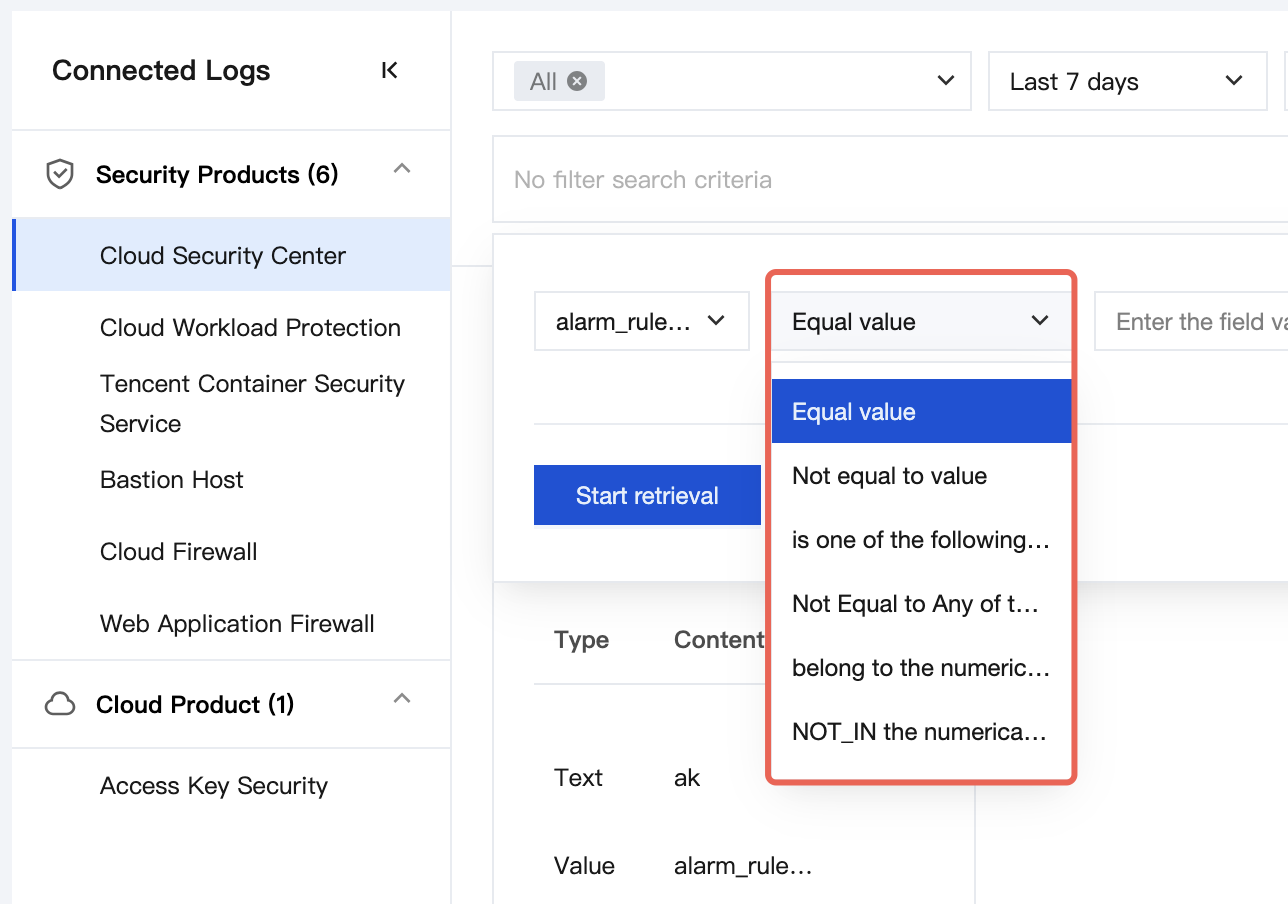
Filter search: Quickly filter data by selecting specific fields and filter conditions.
5.1 Select specific fields.
5.2 Select filter conditions.
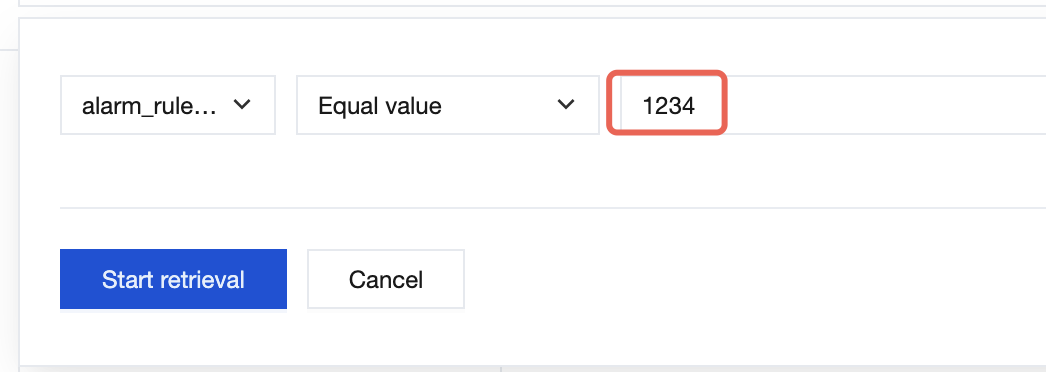
5.3 Enter specific field values, and then click Start retrieval.
6. View switching is supported: Two view types are supported, Raw Data View and Table View. The Raw Data View focuses on displaying a complete piece of raw log data, while the Table View displays data in columns by field.
Raw Data View
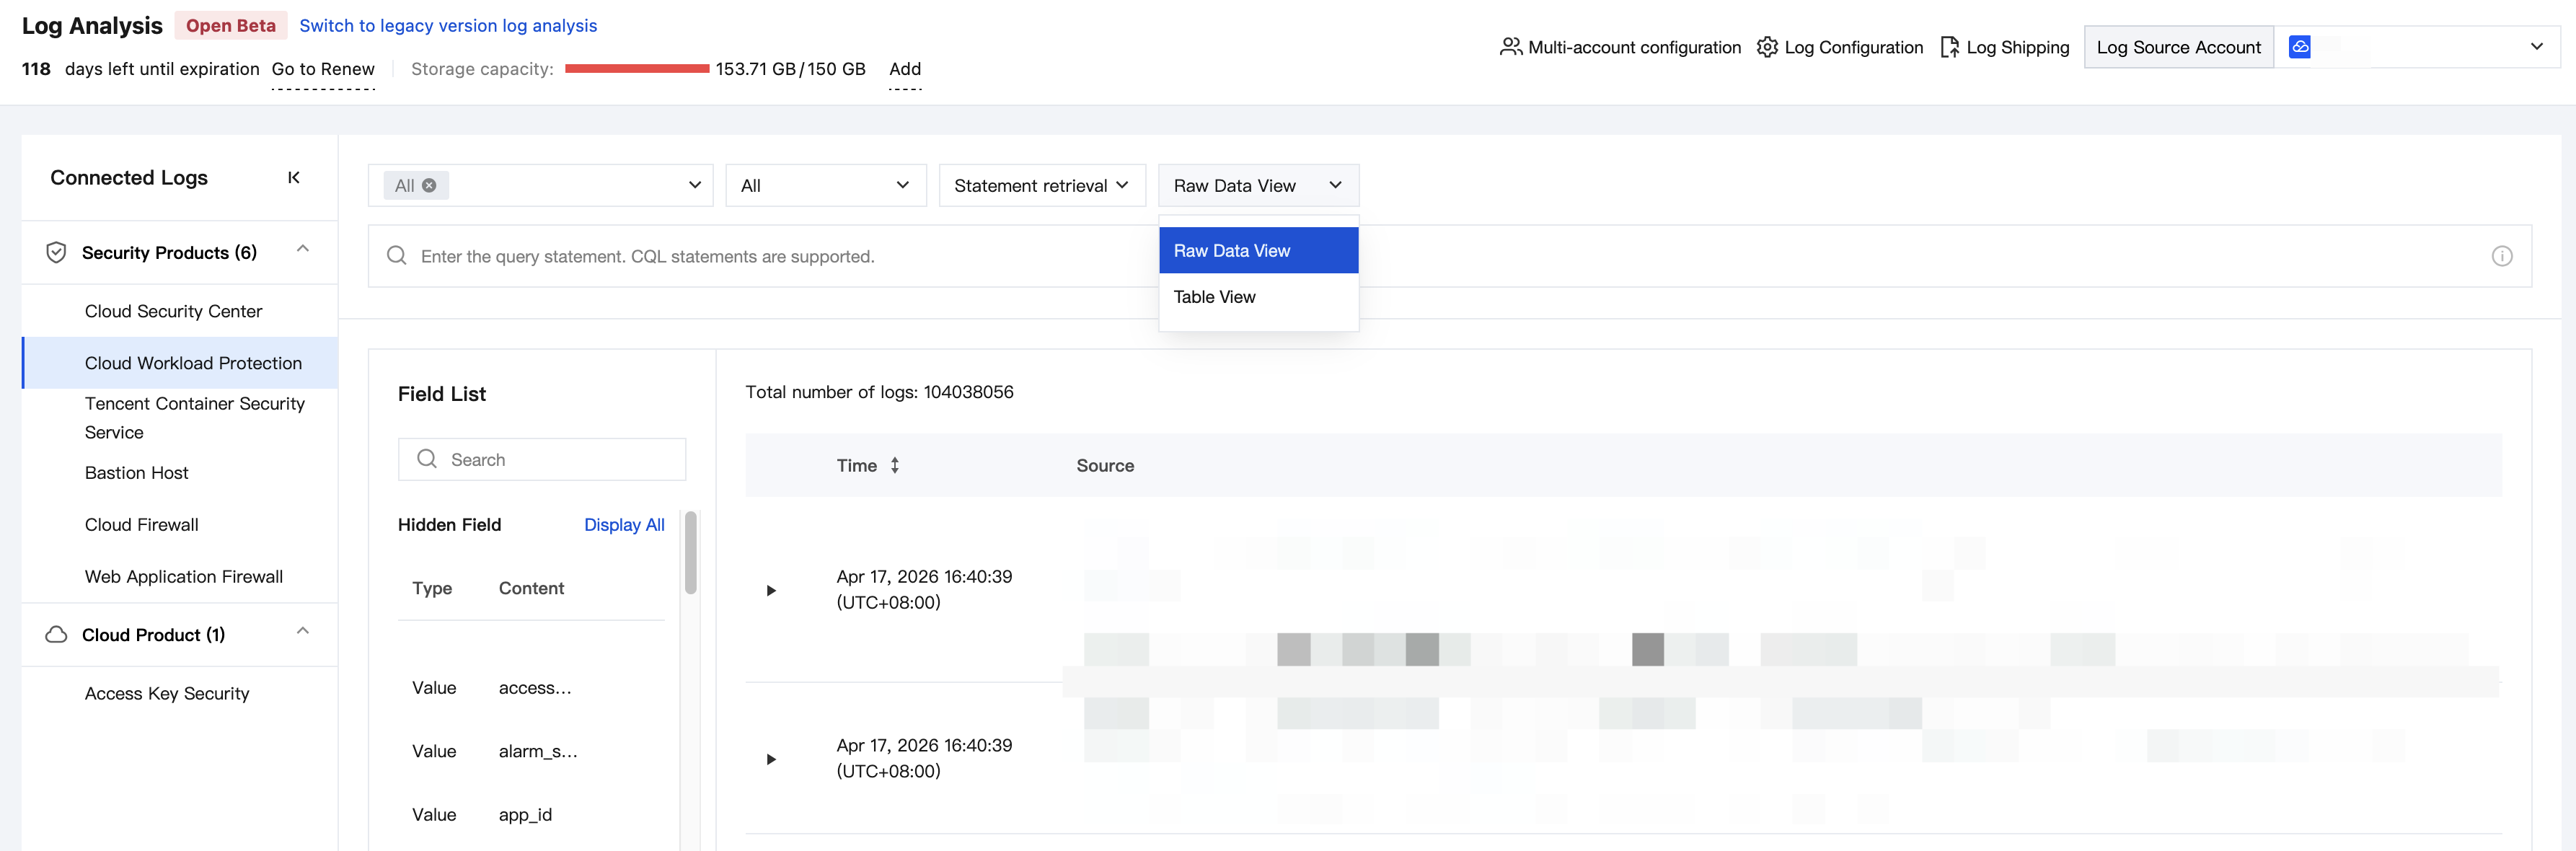
Table View
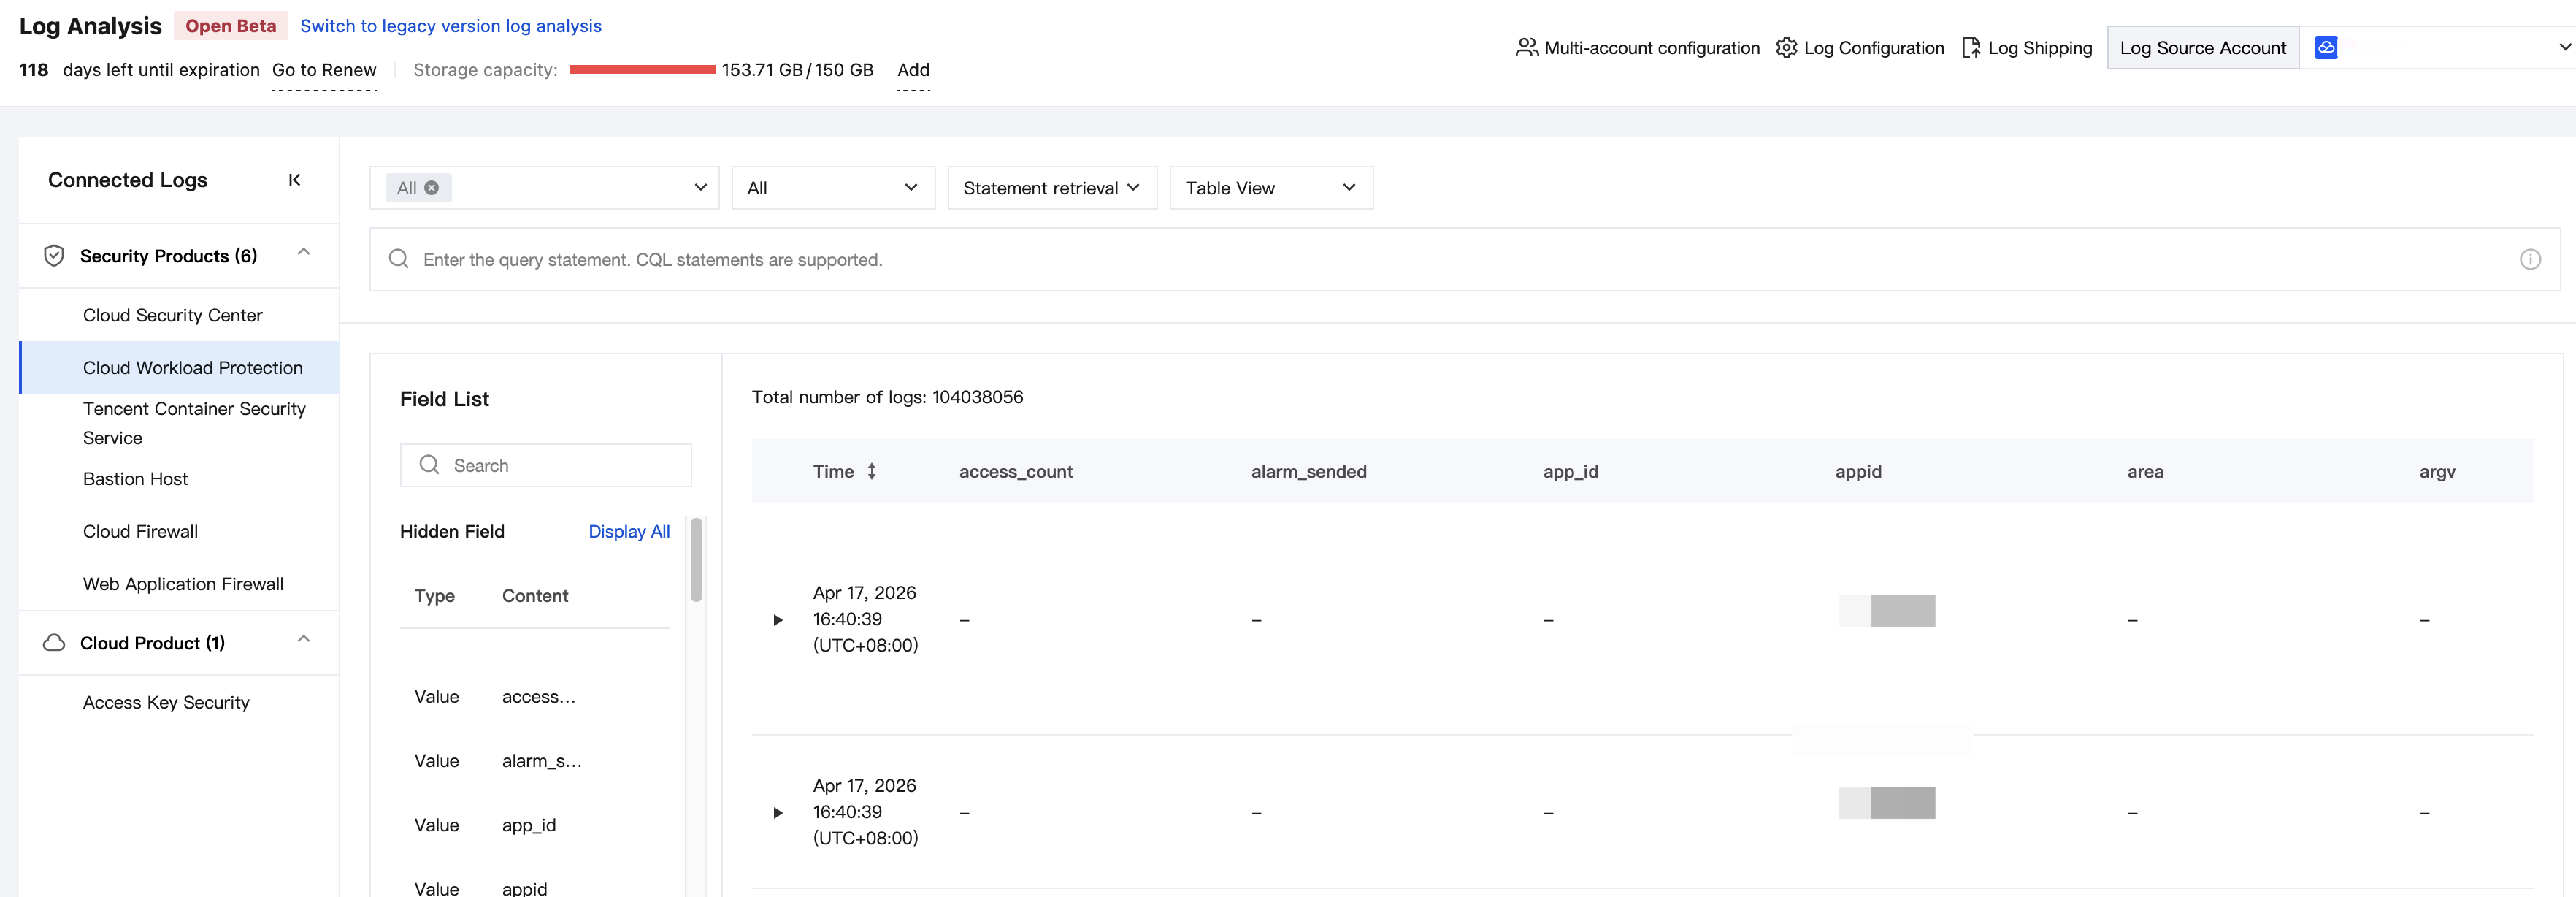
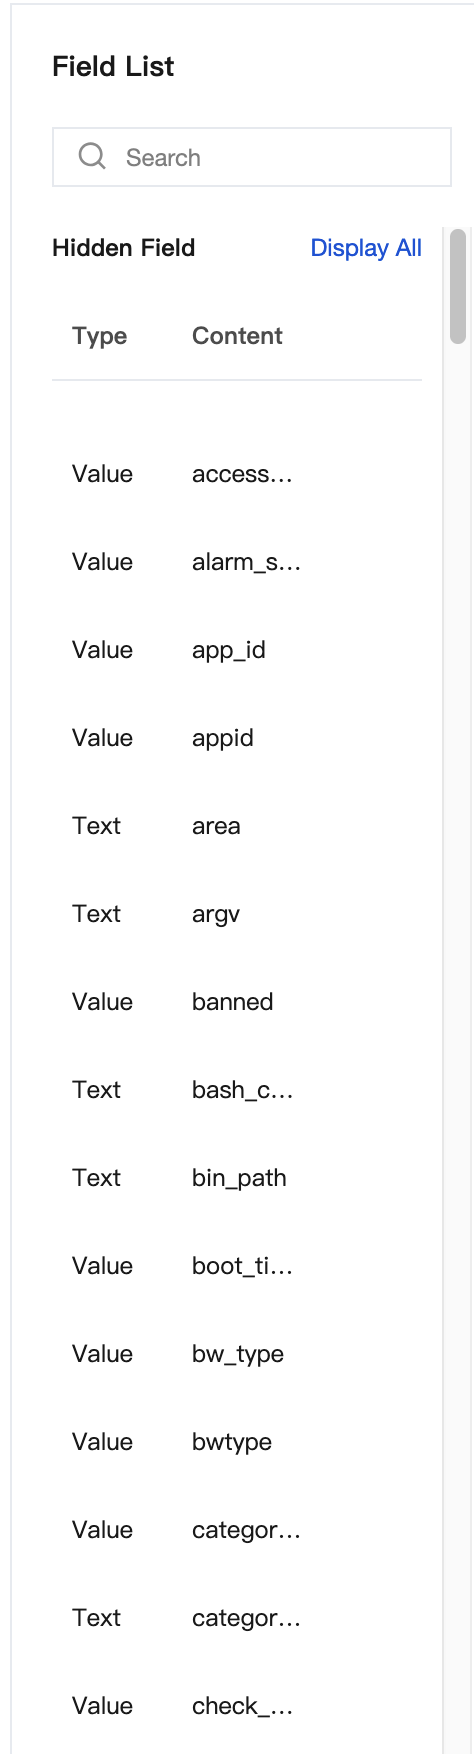
7. Field List: All available fields for the current log are displayed in the lower-left area of the page, including field names and types (such as text, numeric, and time). Click Hide Fields/Show All to switch the display scope of the fields.
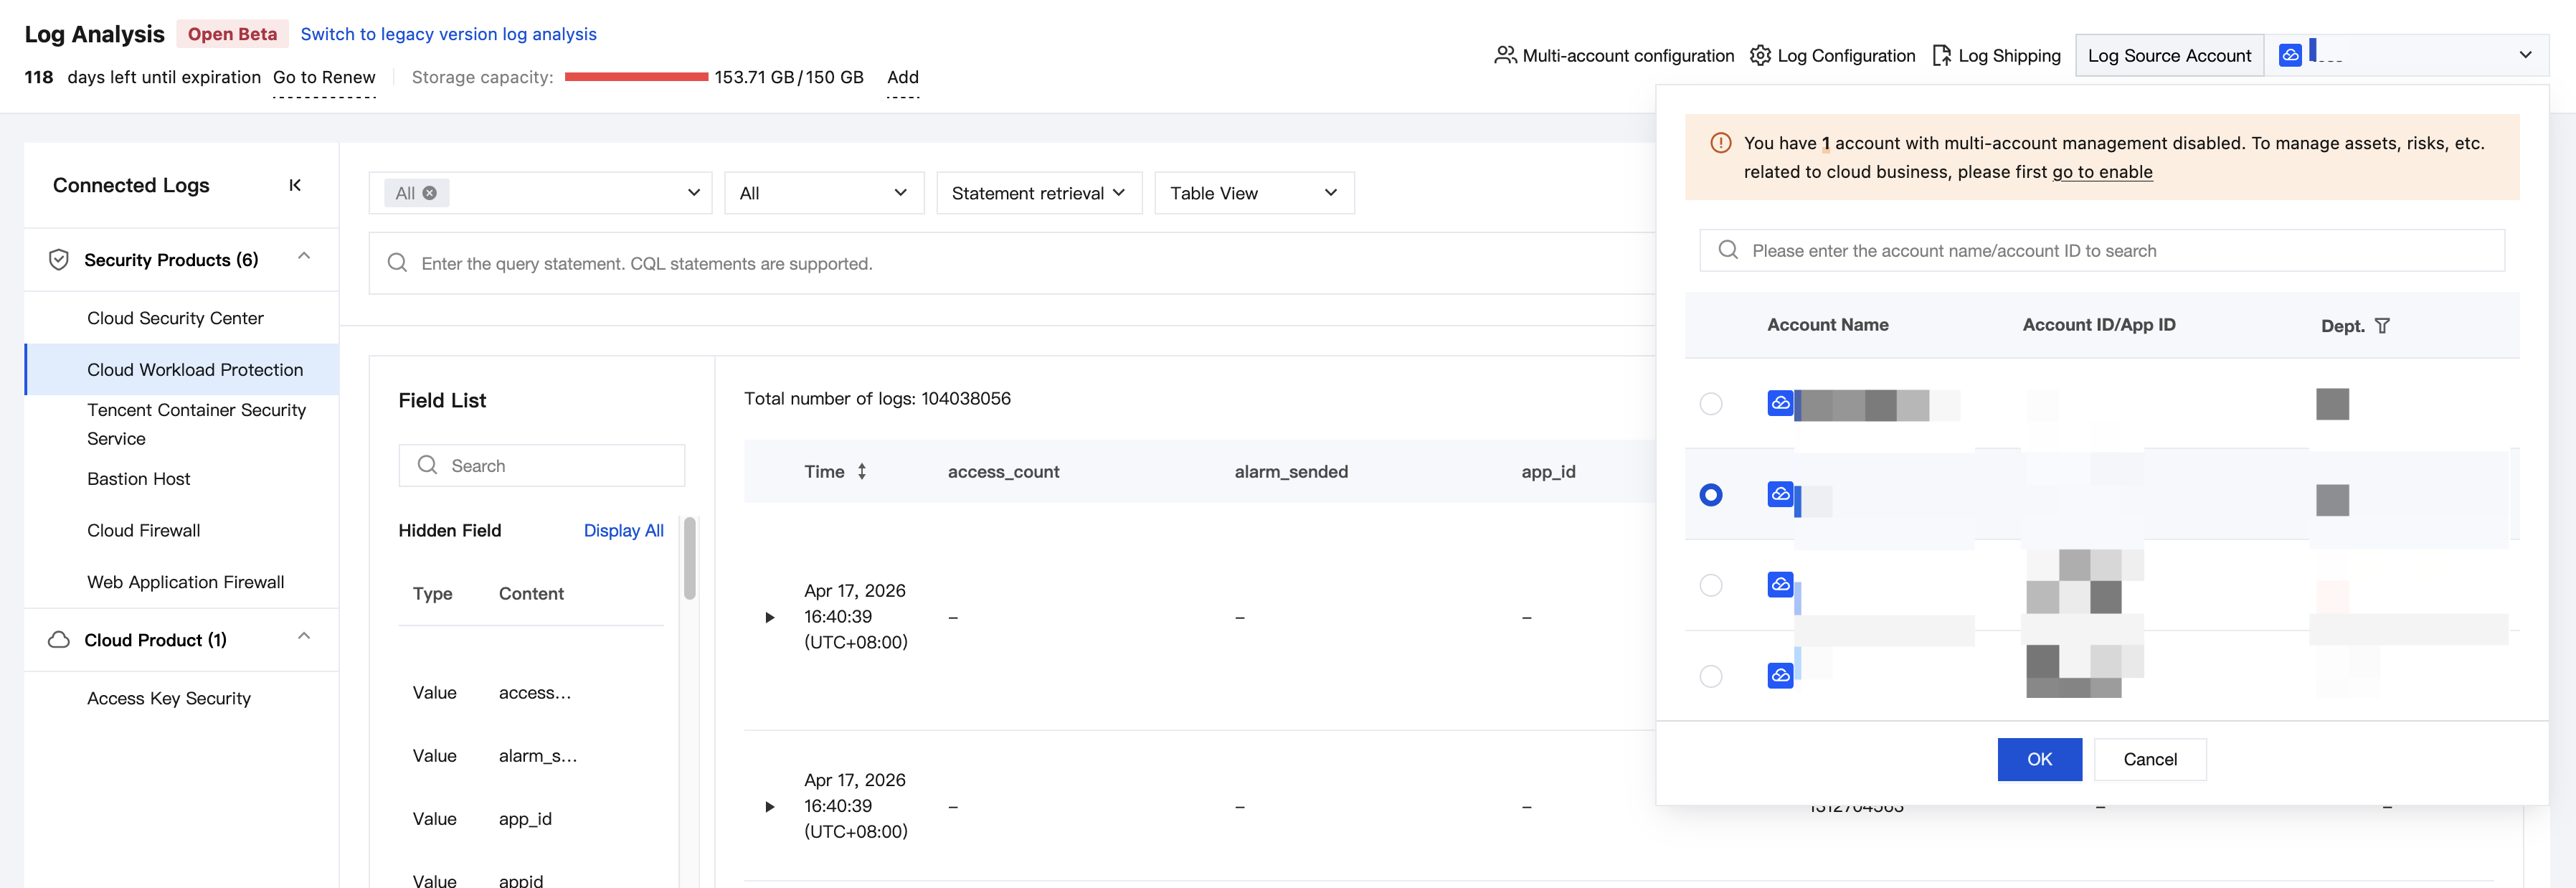
8. In a multi-account scenario, you can click Source Account to select another account and search log data from different accounts.
Ajuda e Suporte
Esta página foi útil?
Você também pode entrar em contato com a Equipe de vendas ou Enviar um tíquete em caso de ajuda.
comentários