tencent cloud

Elastic MapReduce

Release Notes and Announcements
Release Notes
Announcements
Security Announcements
Product Introduction
Overview
Strengths
Architecture
Features
Use Cases
Constraints and Limits
Technical Support Scope
Product release
Purchase Guide
EMR on CVM Billing Instructions
EMR on TKE Billing Instructions
EMR Serverless HBase Billing Instructions
Getting Started
EMR on CVM Quick Start
EMR on TKE Quick Start
EMR on CVM Operation Guide
Planning Cluster
Administrative rights
Configuring Cluster
Managing Cluster
Managing Service
Monitoring and Alarms
TCInsight
EMR on TKE Operation Guide
Introduction to EMR on TKE
Configuring Cluster
Cluster Management
Service Management
Monitoring and Ops
Application Analysis
EMR Serverless HBase Operation Guide
EMR Serverless HBase Product Introduction
Quotas and Limits
Planning an Instance
Managing an Instance
Monitoring and Alarms
Development Guide
EMR Development Guide
Hadoop Development Guide
Spark Development Guide
Hbase Development Guide
Phoenix on Hbase Development Guide
Hive Development Guide
Presto Development Guide
Sqoop Development Guide
Hue Development Guide
Oozie Development Guide
Flume Development Guide
Kerberos Development Guide
Knox Development Guide
Alluxio Development Guide
Kylin Development Guide
Livy Development Guide
Kyuubi Development Guide
Zeppelin Development Guide
Hudi Development Guide
Superset Development Guide
Impala Development Guide
Druid Development Guide
TensorFlow Development Guide
Kudu Development Guide
Ranger Development Guide
Kafka Development Guide
Iceberg Development Guide
StarRocks Development Guide
Flink Development Guide
JupyterLab Development Guide
MLflow Development Guide
Practical Tutorial
Practice of EMR on CVM Ops
Data Migration
Practical Tutorial on Custom Scaling
API Documentation
History
Introduction
API Category
Cluster Resource Management APIs
Cluster Services APIs
User Management APIs
Data Inquiry APIs
Scaling APIs
Configuration APIs
Other APIs
Serverless HBase APIs
YARN Resource Scheduling APIs
Making API Requests
Data Types
Error Codes
FAQs
EMR on CVM
Service Level Agreement
Contact Us

Impala Query Management

PDF
Modo Foco
Tamanho da Fonte
Última atualização: 2023-12-27 14:45:04

Feature overview

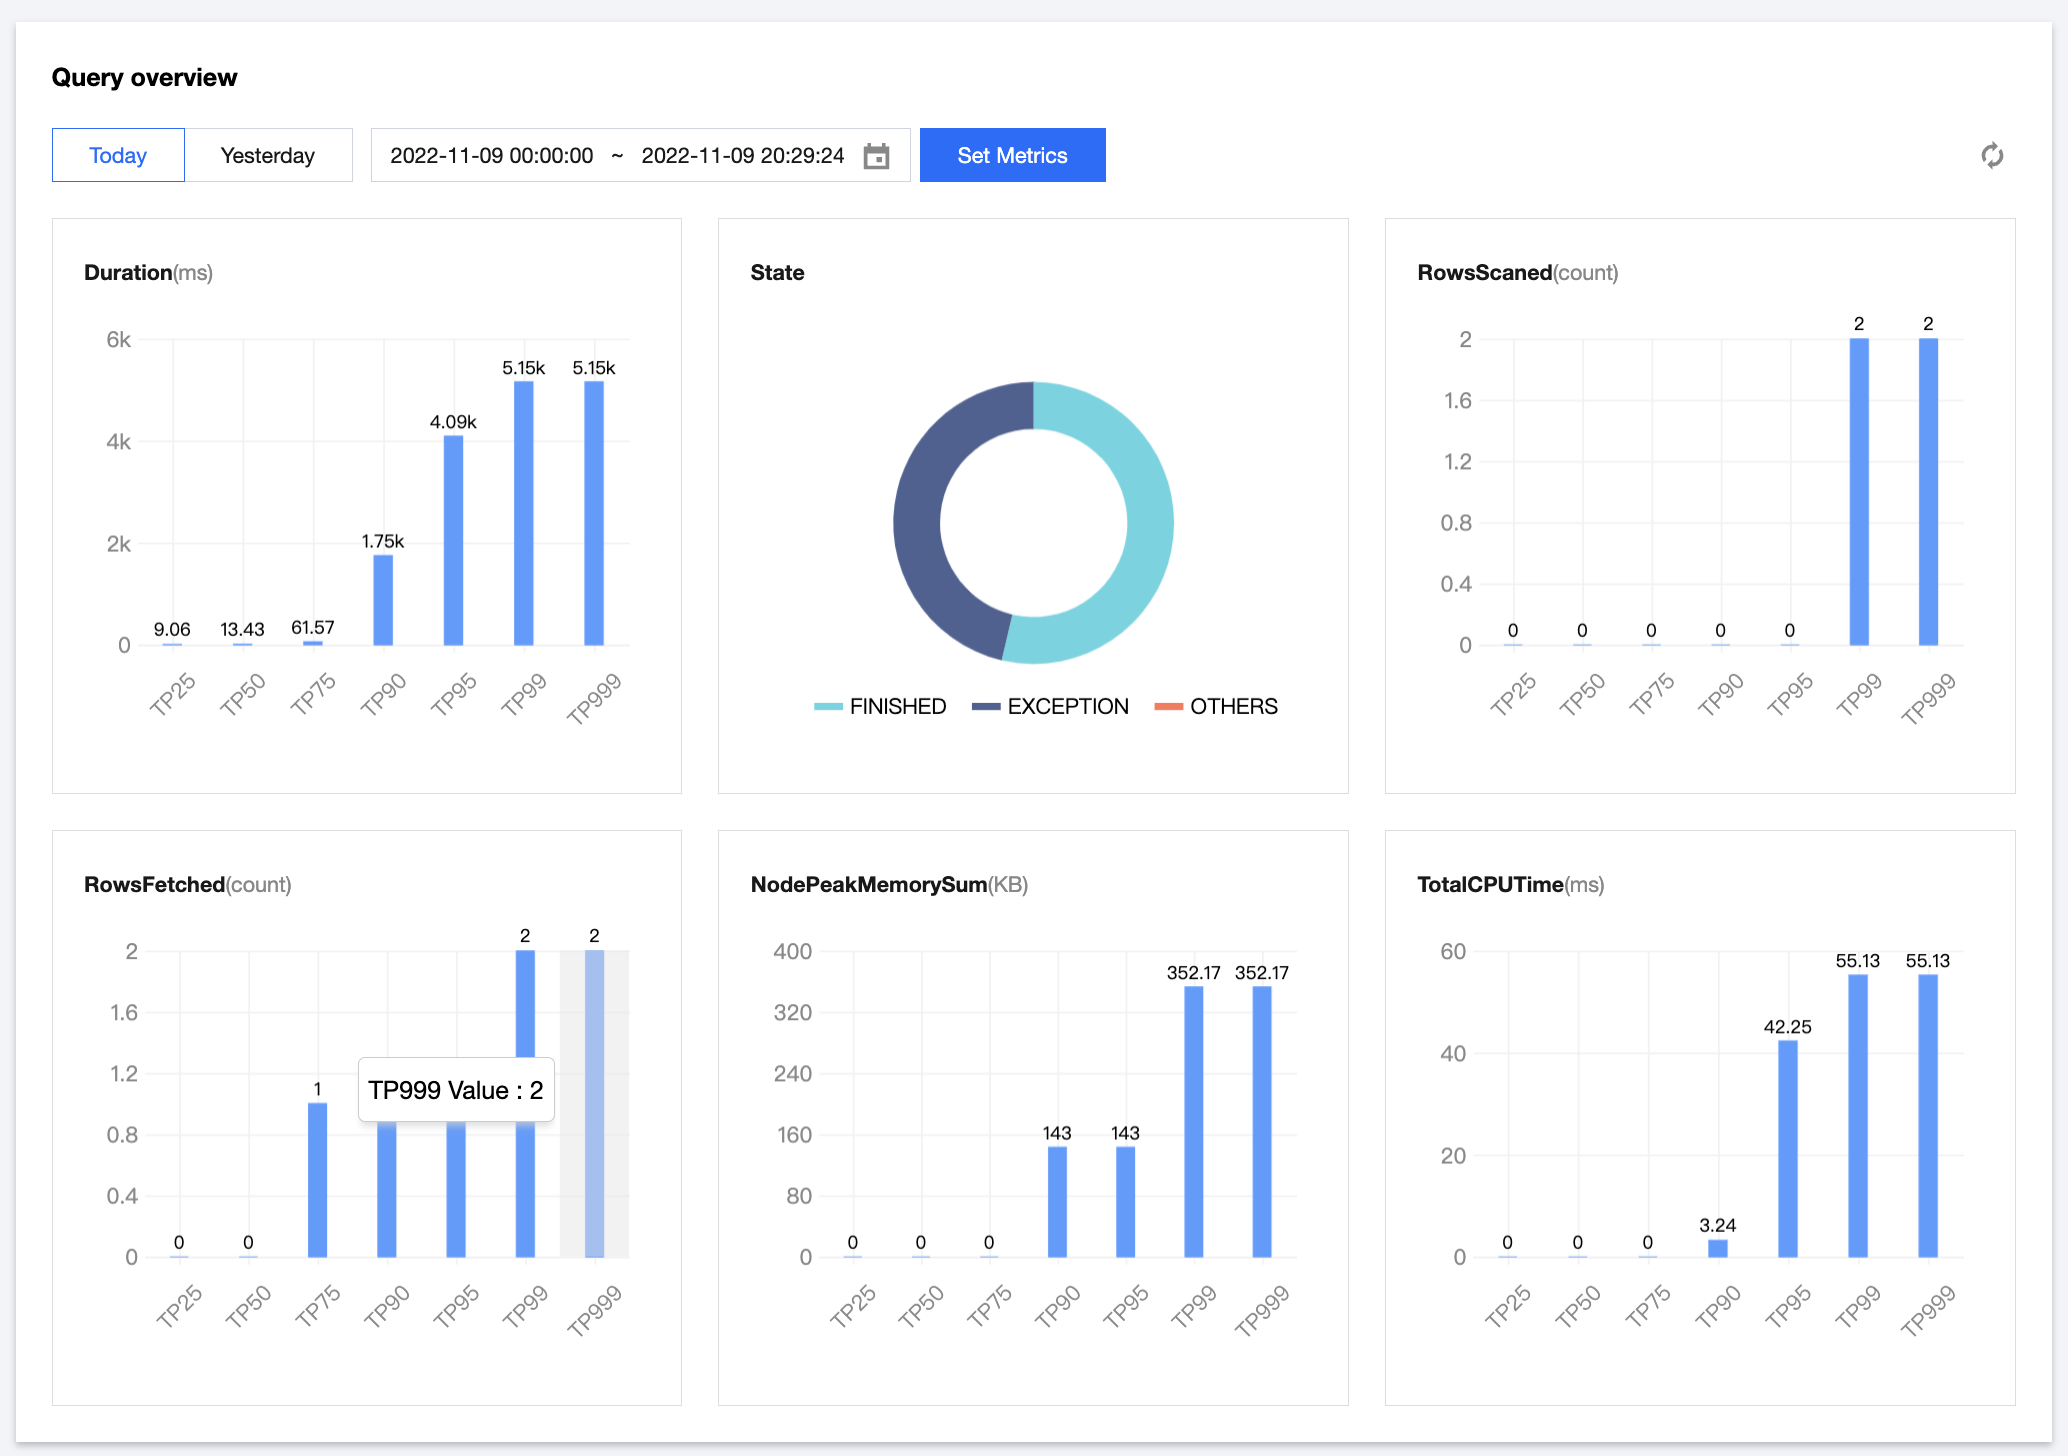
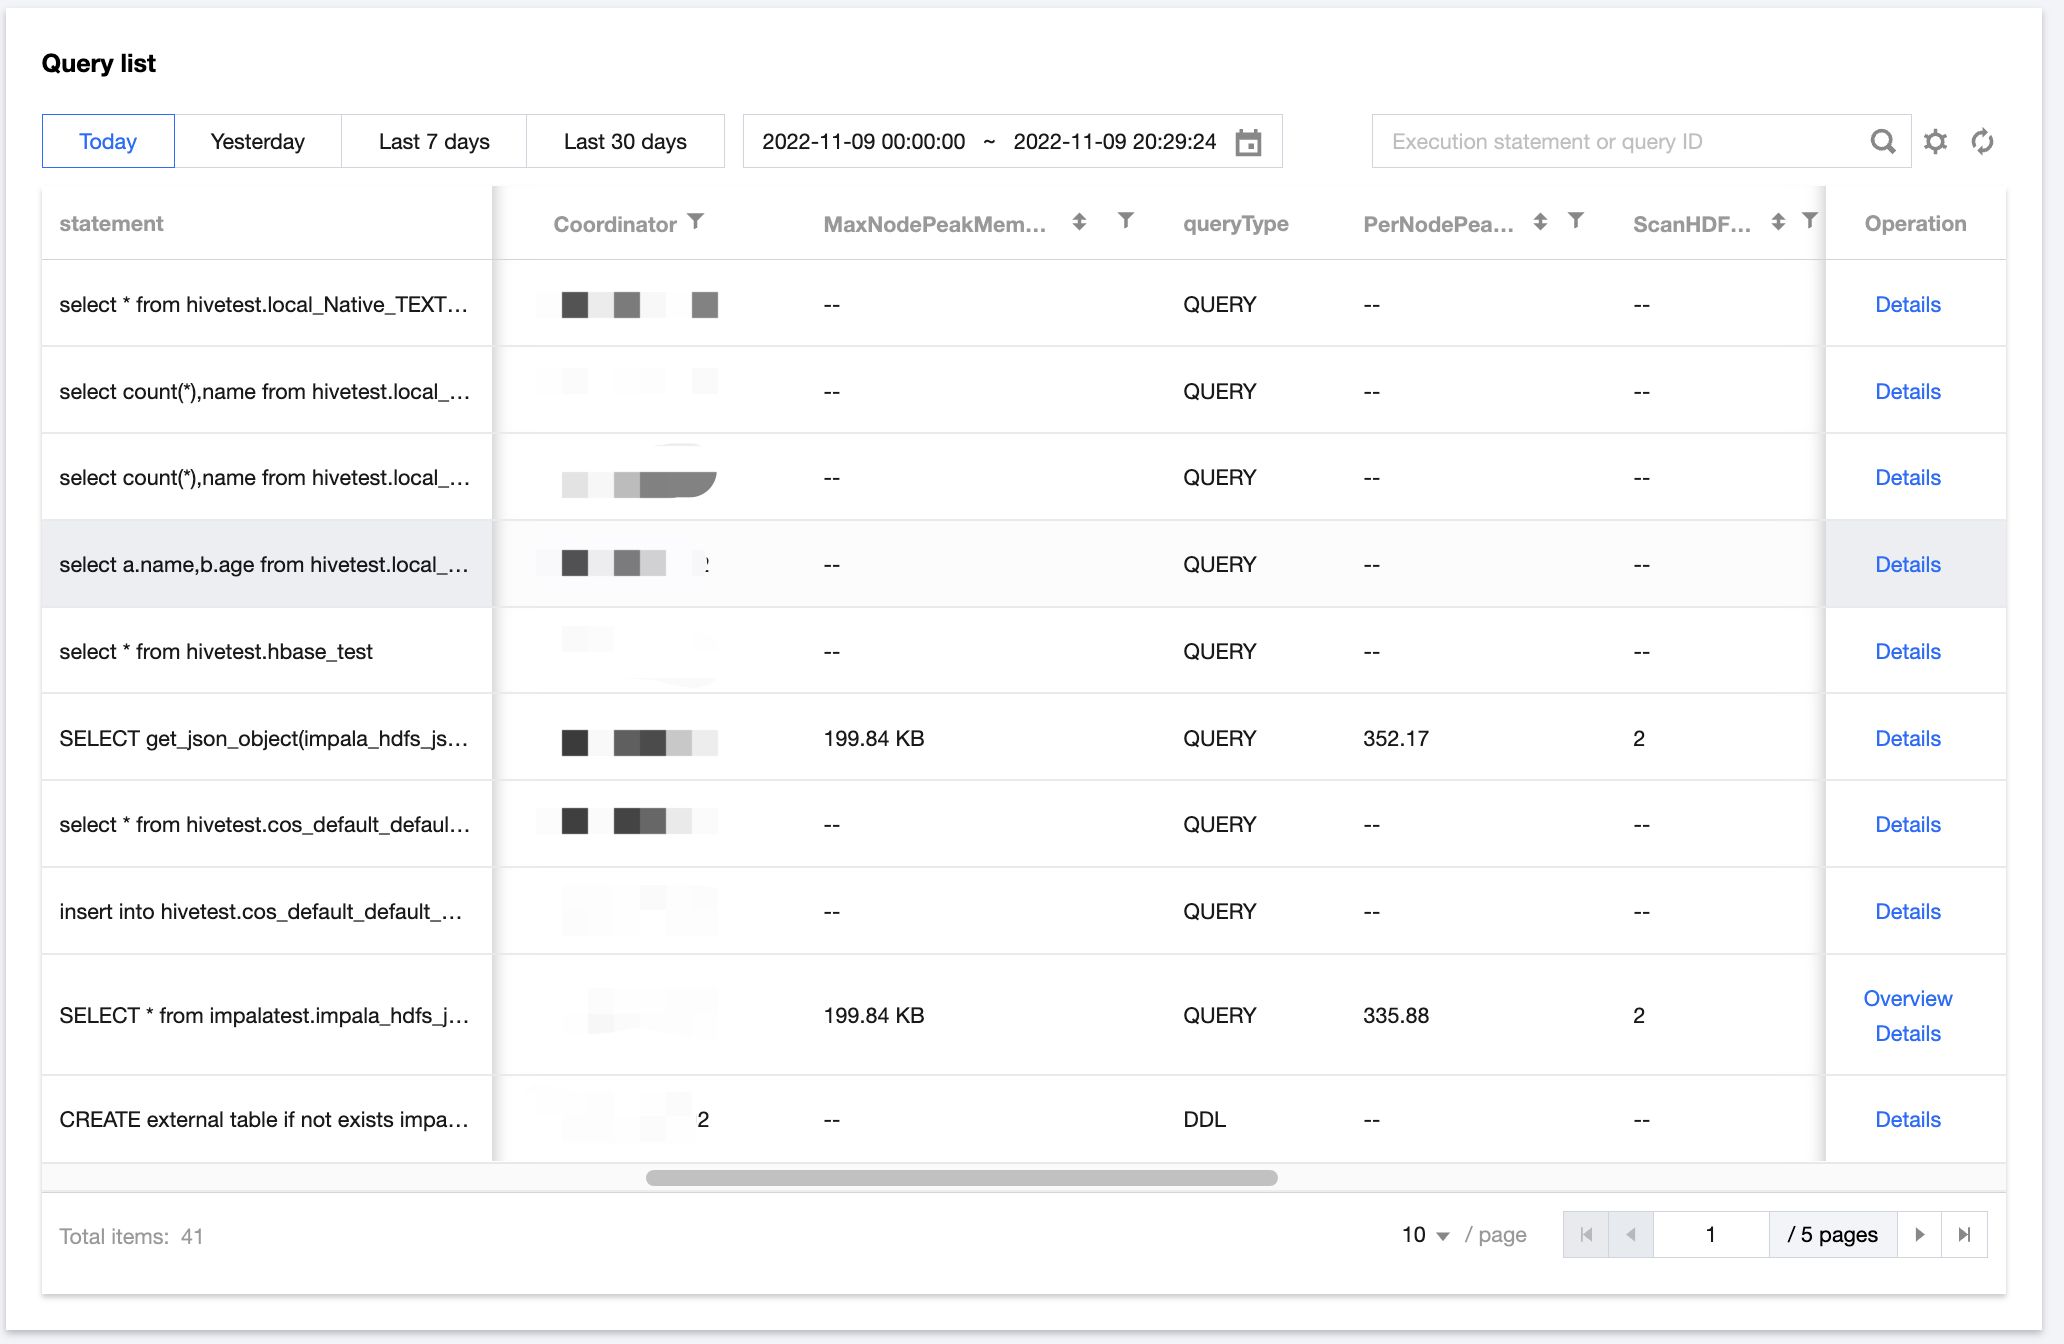
You can view the percentile distribution of various metrics for Impala queries in multiple dimensions. The Impala list allows you to quickly view detailed metrics such as query statements, query status, users, databases, scanned rows, peak memory usage, total read/sent bytes, and HDFS scanned rows.

Directions

1. Log in to the EMR console and click the ID/Name of the target cluster in the cluster list to enter the cluster details page.
2. On the cluster details page, click Cluster Service and select Operation > Query Management in the top-right corner of the Impala component to query jobs. Take the duration as an example. In the currently selected time range, if the TP90 percentile duration is 6.86k (ms), 90% of queries last for within 6.86s.


3. Impala query list information is provided. Certain column header fields can be filtered and sorted, and compound filtering by multiple dimensions is supported.


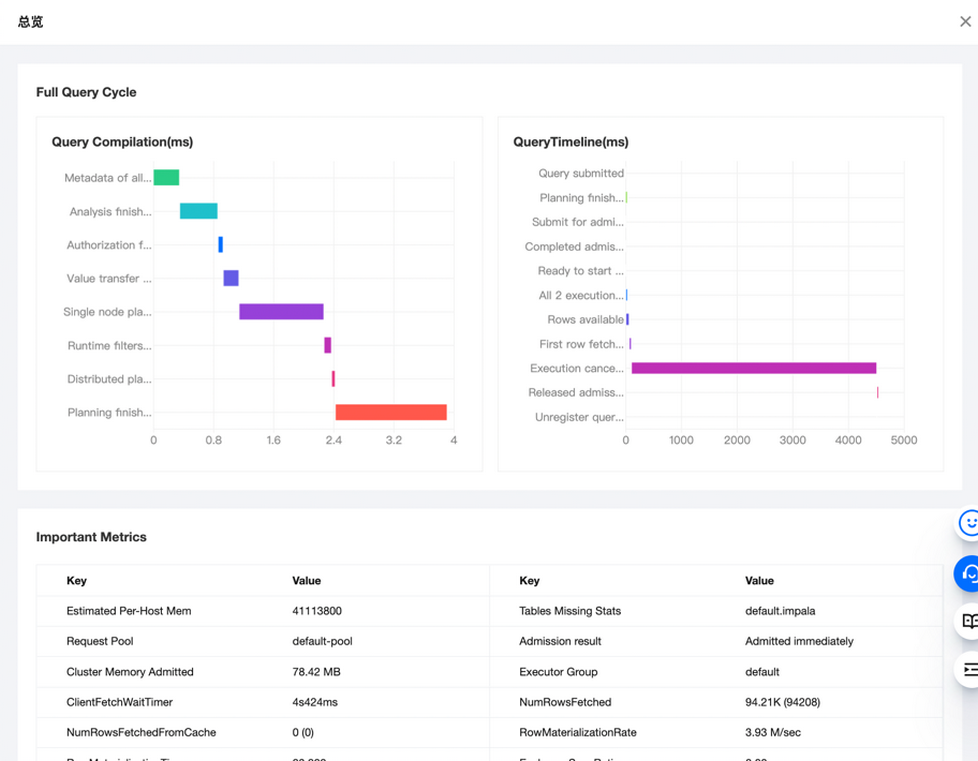
4. Click Overview in the Operation column to view the time distribution information throughout the entire lifecycle of an Impala query, key metric information, and certain node information of the runtime.

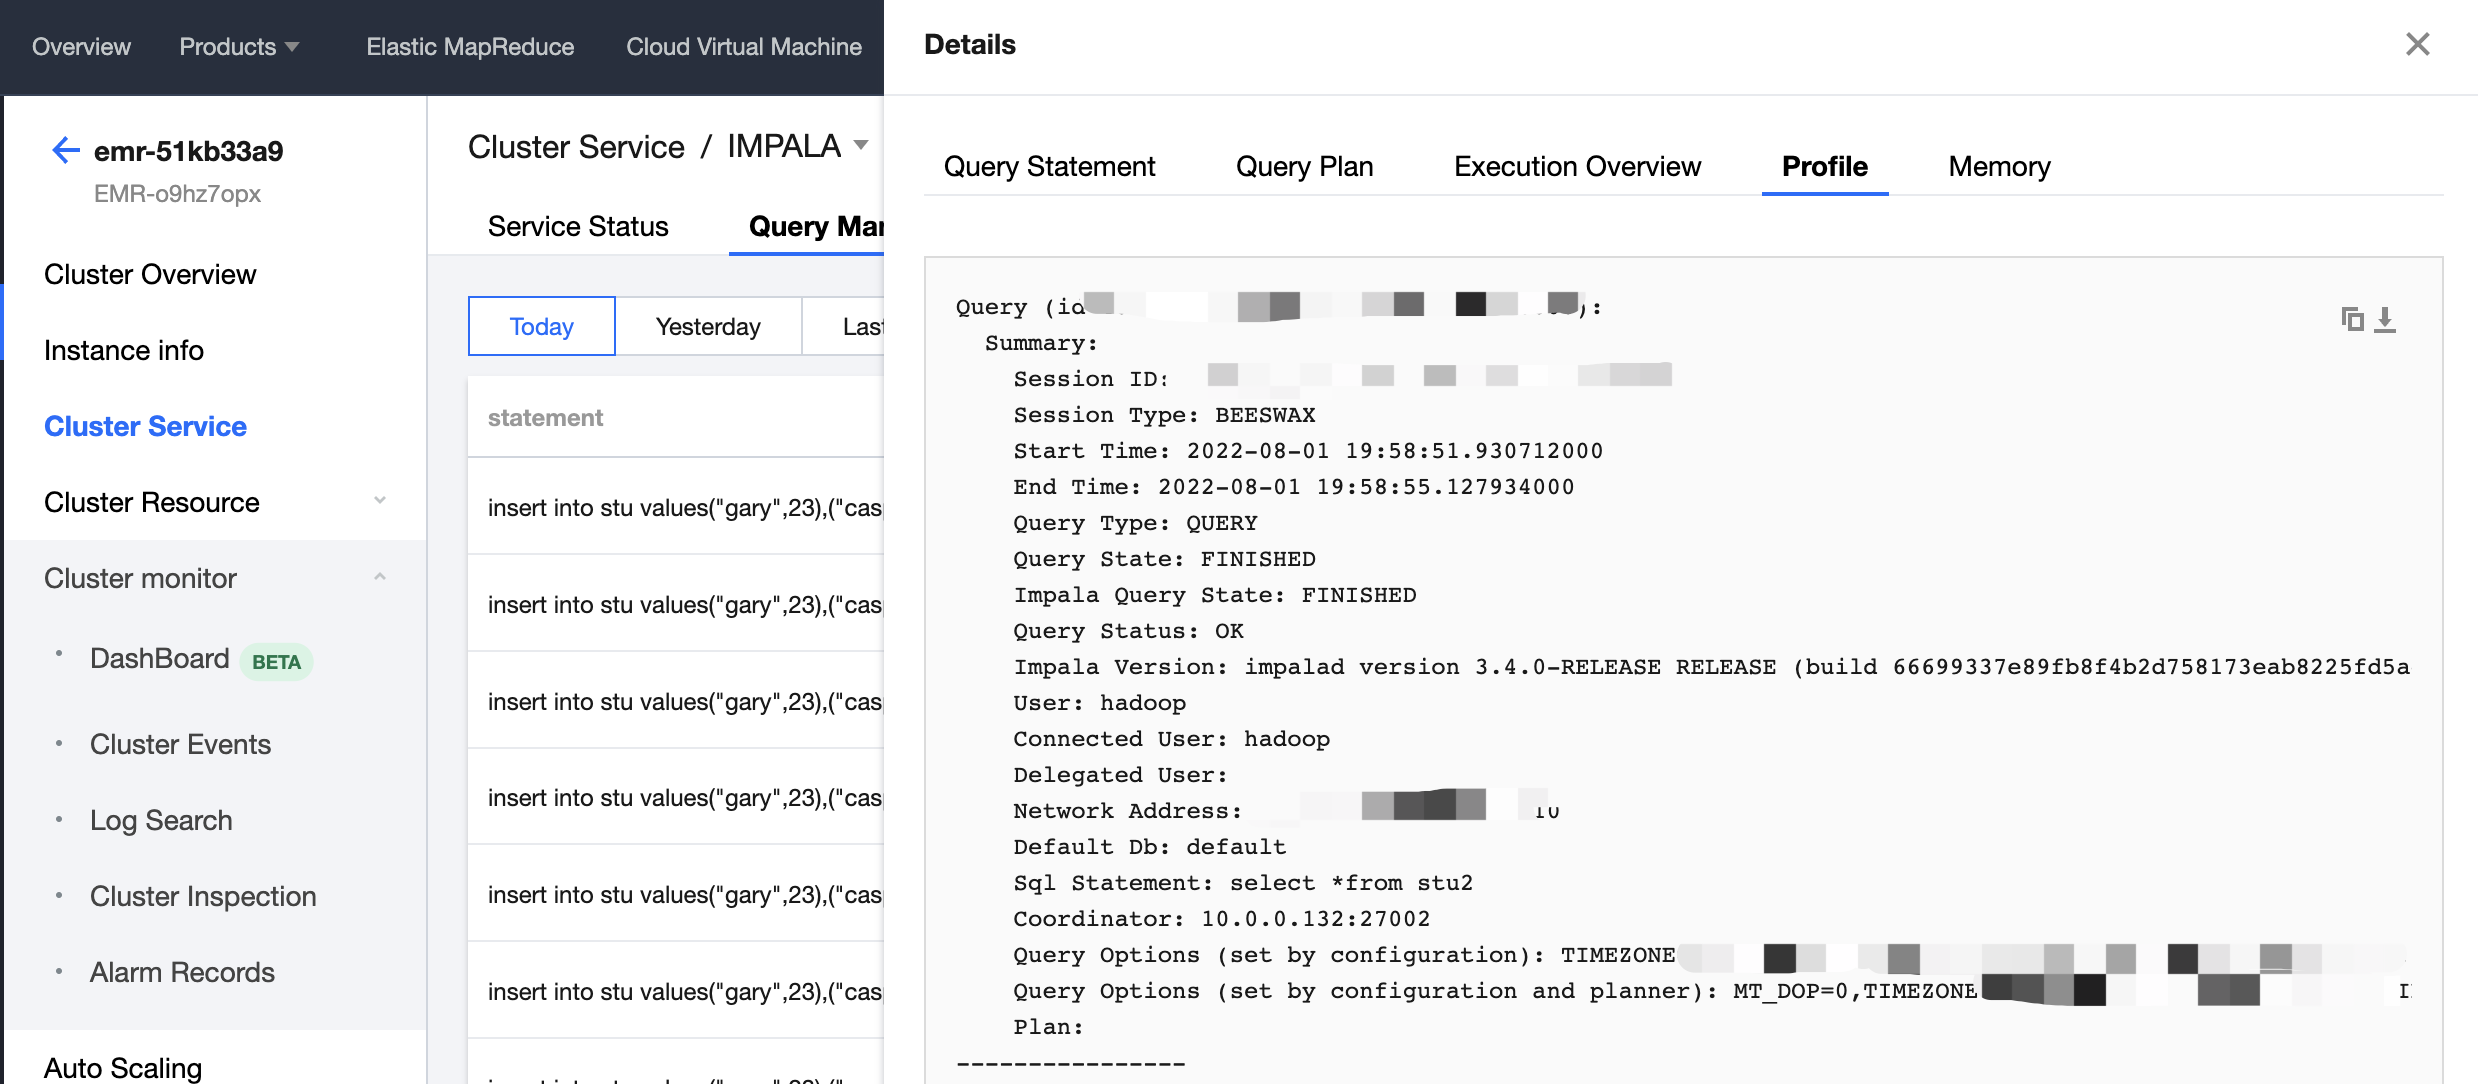
Click Details in the Operation column to view query statements, query plans, execution overview, profiles, and memory information.

Note:
For Impala queries that take more than 3s to execute, you can view profiles in Overview and Details.


Ajuda e Suporte

Esta página foi útil?

comentários