When DBbrain is required to perform health inspections on instances, aggregate instance information on the Instance Overview page, or display related information about big key analysis on the Memory Analysis page, you can enable database inspection, instance overview, or big key analysis features for instances individually or in batch. These features can be disabled when not needed.
The overview feature is enabled by default for all instances accessed to DBbrain.
2. In the left sidebar, select Instance Management.
3. Select the database type at the top of the page.
4. (Optional) In the search box at the top of the page, select resource attributes (including instance ID, instance name, and status), enter keywords, and click
.
Note:
The available resource attributes depend on the selected database type, refer to the actual page display for specifics.
5. Enter the Instance Configuration page through the following three methods.
The display may vary by page. The following example uses the MySQL database type as a reference. Refer to the actual page display for specifics.
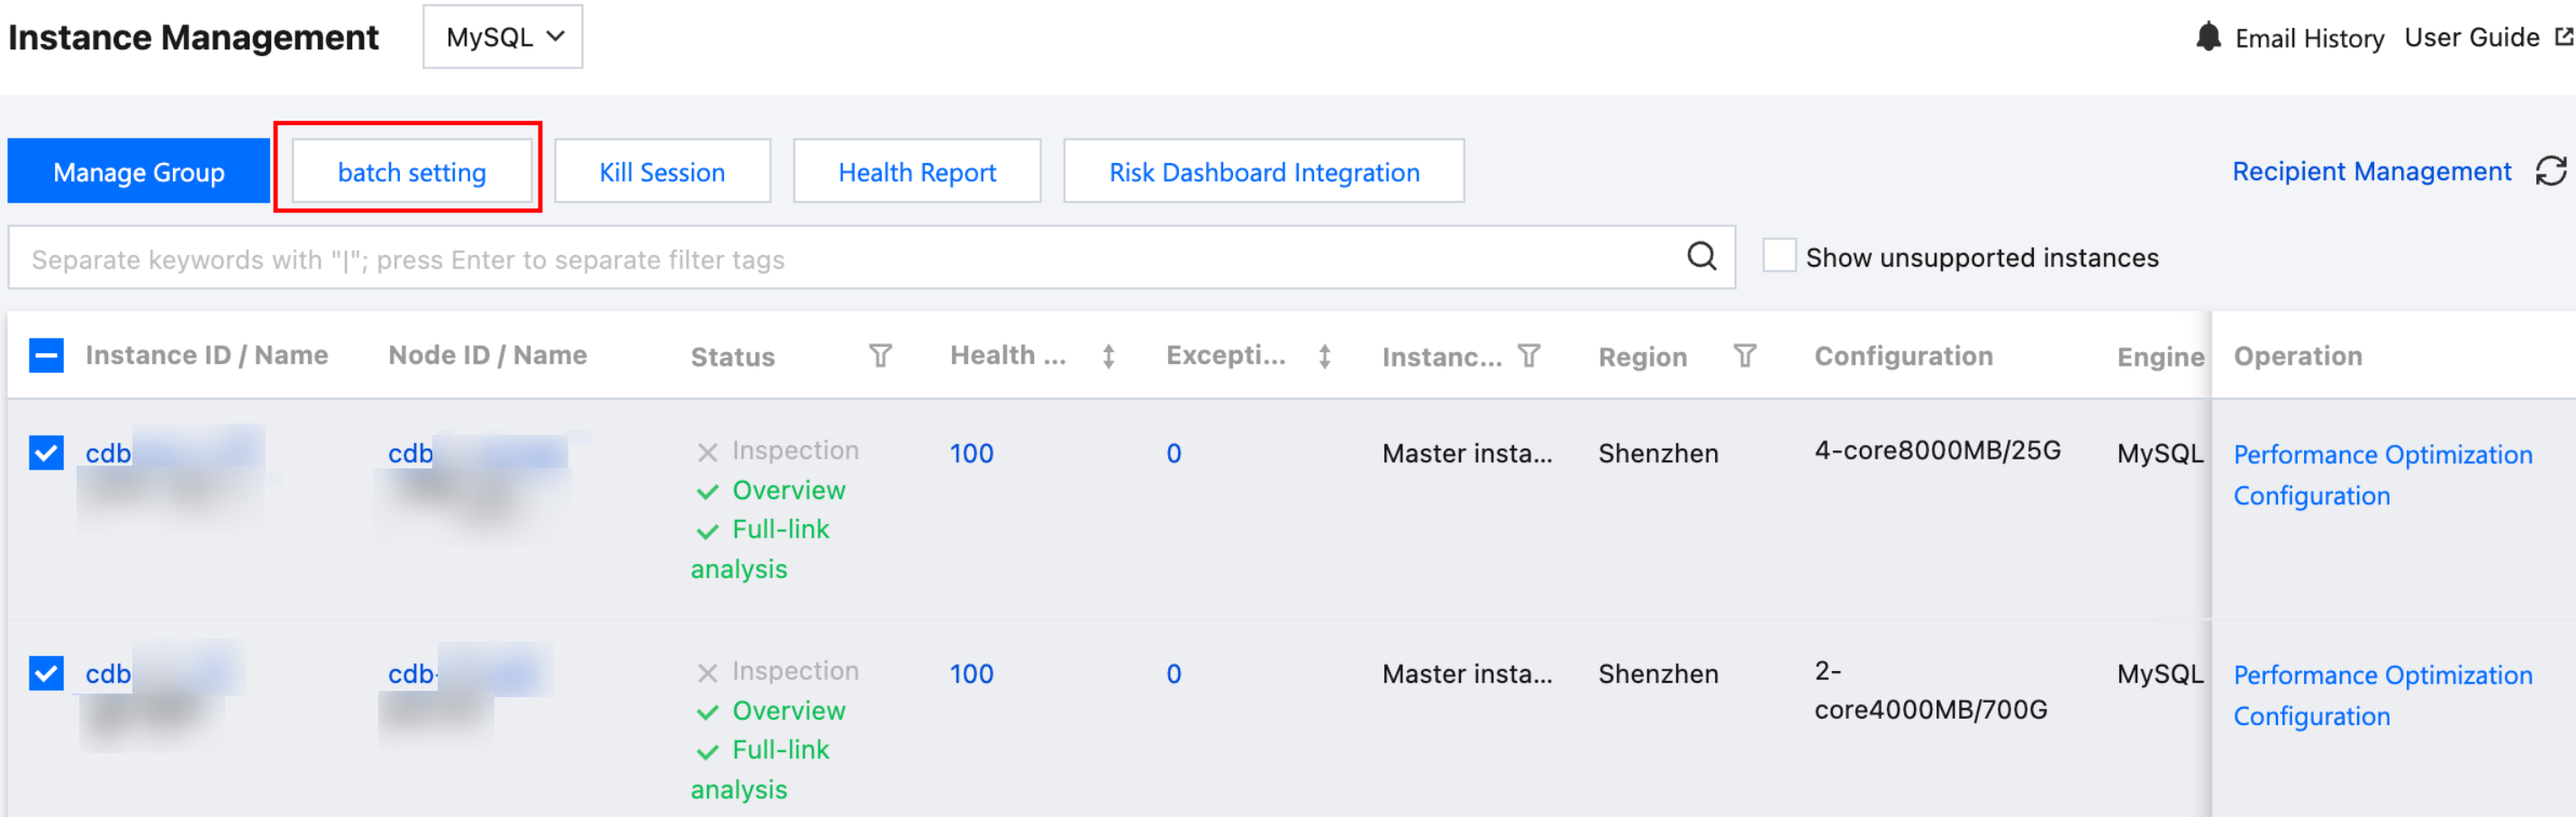
Method 1: In the instance list, check the instances or shards to enable the Full-link Analysis feature, and click batch setting at the top left of the page.
Note:
Full-link Analysis is not supported in batch settings.
Method 2: In the Status column of the instance or shard to be enabled, click
.
Method 3: In the Operation column of the instance or shard to be enabled, click Configuration.
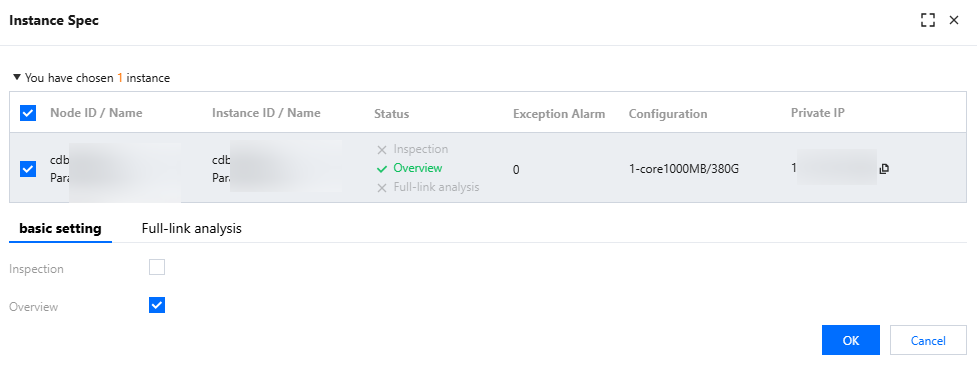
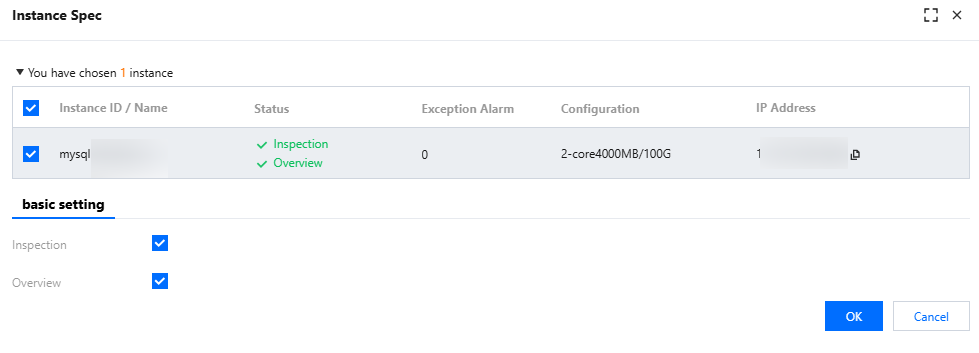
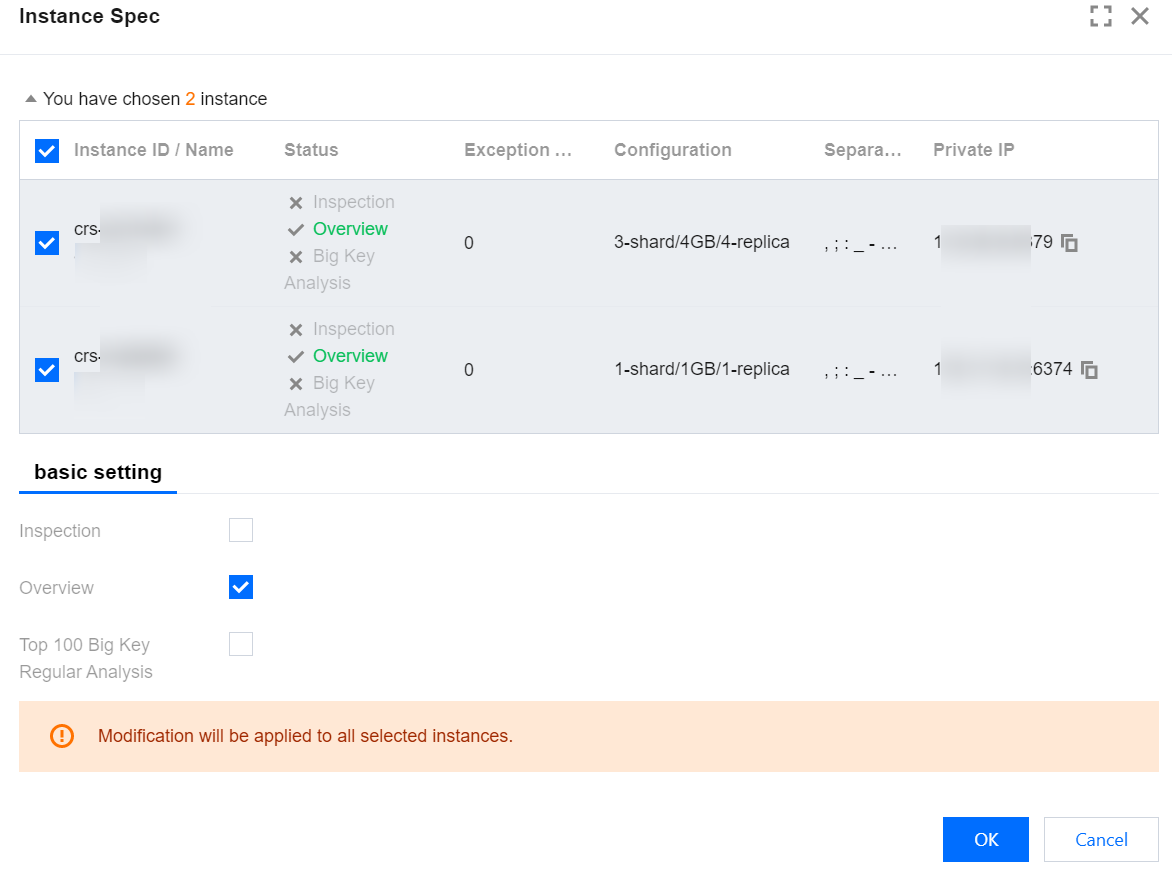
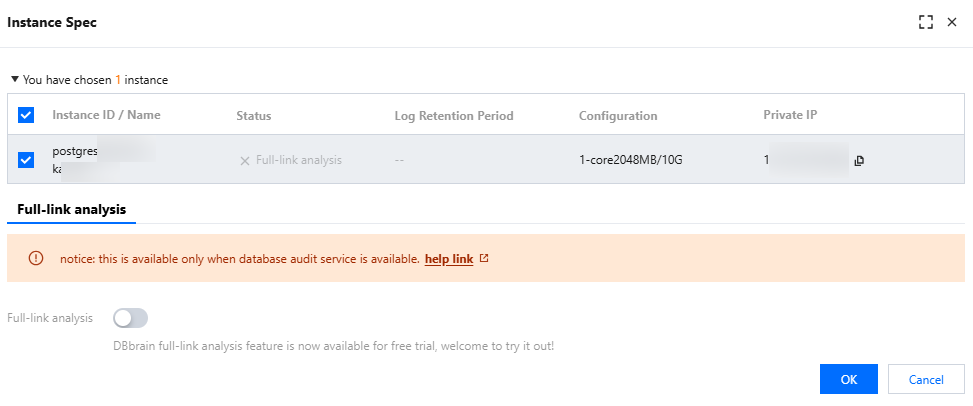
6. In the Instance Spec pop-up on the right, view and confirm the instance or shard information. Select to enable or disable database inspection, overview, full-link analysis, and big key analysis. Click OK.
Note:
After database inspection is enabled, DBbrain will inspect the instance and display the inspection results on the Monitoring & Alarm > Database Inspection page. If database inspection is disabled, the instance will not be inspected. For details on viewing instance inspection results, see Viewing Inspection Results.
After instance overview is enabled, the Instance Overview page of DBbrain will collect information about the instance. If instance overview is disabled, the Instance Overview page will not collect information about the instance. For details on viewing the Instance Overview page, see Instance Overview.
After full-link analysis is enabled, the Full-link Analysis page of DBbrain will collect information about the instance or shard. If Full-link Analysis is disabled, the Full-link Analysis page will not collect information about the instance. For details on viewing the Full-link Analysis page, see Enabling Full-link Analysis.
After top 100 big key periodic analysis is enabled, the DBbrain Memory Analysis page will collect the big key analysis information of the instance. After the feature is disabled, the Memory Analysis page will not collect the information of the instance. For details on viewing big key analysis information, see Memory Analysis (Big Key Analysis).