To view the inspection results of instances with database inspection enabled, you can check the inspection results and download the health report on the Database Inspection page and the Health Report page. This helps users understand the health status, faults, and potential risks of database instances and provides professional optimization suggestions for reference.
Prerequisites
The Inspection capability has been enabled for the instance. For details on enabling inspection, see Enabling Inspection Feature.
Directions
Viewing Inspection Records and Information on the Database Inspection Page
2. In the left sidebar, select Monitoring & Alarm > Database Inspection.
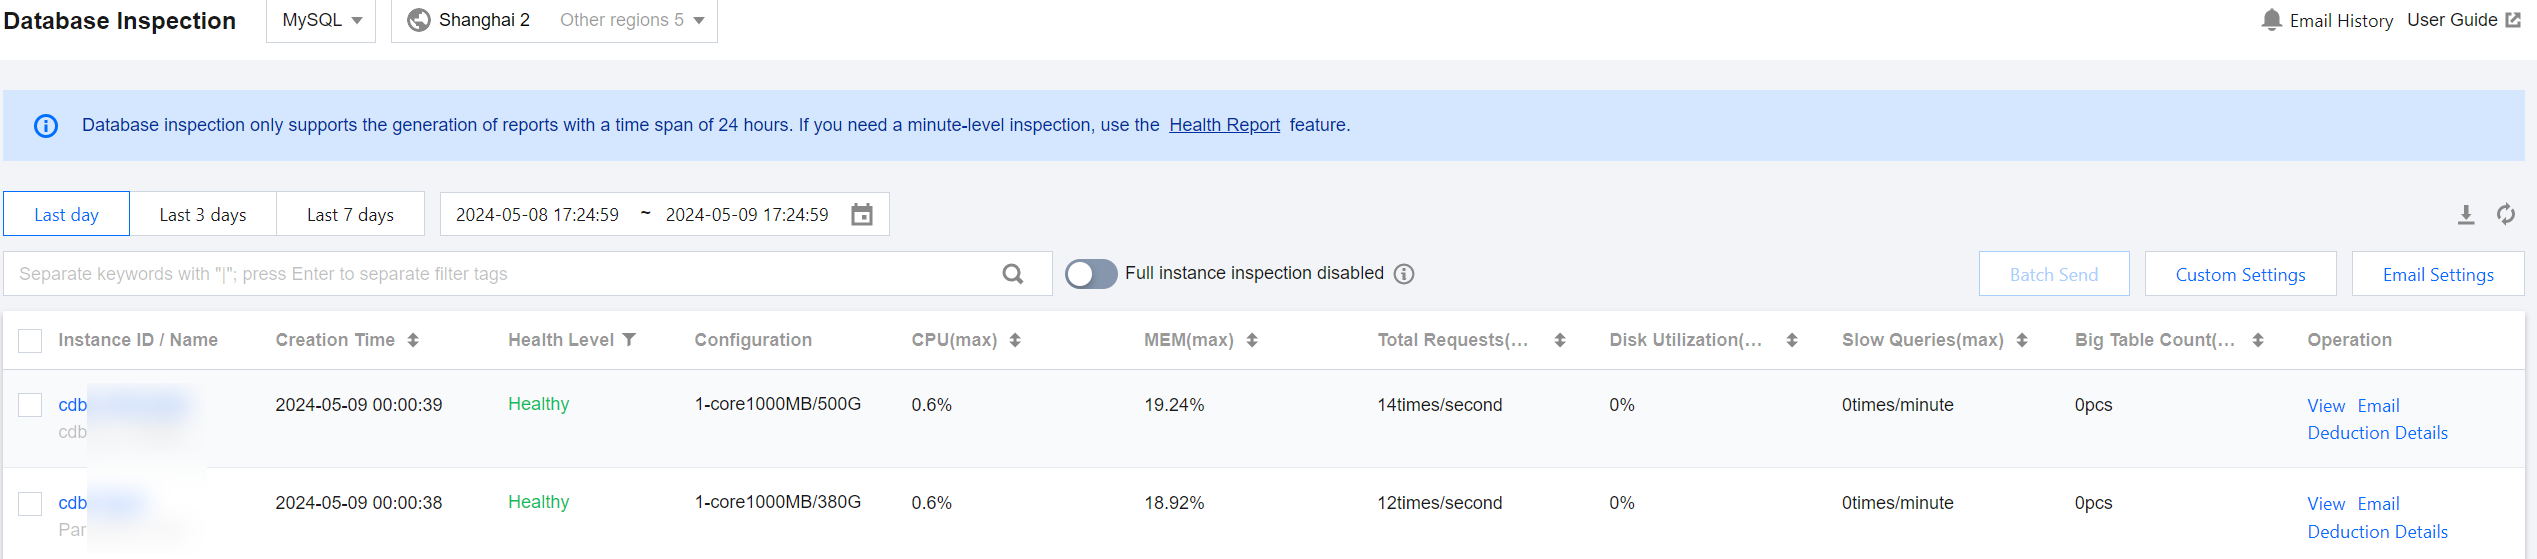
3. Select the database type and region at the top of the page.
4. Select the time period to query, which can be the last day, last 3 days, last 7 days, or a custom time period (up to 30 days ago and with a maximum span of 7 days).
5. (Optional) In the search box at the top of the page, select resource attributes (including instance ID, instance name, and status), enter keywords, and click
.
Note:
The available resource attributes depend on the selected database type; refer to the actual page display for specifics.
6. View the instance inspection information in the list. The specific parameter descriptions are shown in the following table.
Parameters
Description
Database Type Involved
Shard ID / Set ID
Shard ID and Set ID.
Click Shard ID to enter the Performance Optimization > Exception Diagnosis page.
TDSQL MySQL
Instance ID/Name
Instance ID and name.
MySQL, TDSQL-C for MySQL, MariaDB, TDSQL for MySQL, Distributed Cache, MongoDB and self-built MySQL
Cluster ID/Name
Cluster ID and cluster name to which the instance belongs.
TDSQL-C for MySQL
Creation Time
Time when the inspection task starts.
MySQL, TDSQL-C for MySQL, MariaDB, TDSQL for MySQL, Distributed Cache, MongoDB, self-built MySQL
Health level
Health levels are divided according to health scores as follows:
Healthy: score ≥ 95
Sub-healthy: 80 ≤ score < 95
Risky: 60 ≤ score < 80
High risk: score < 60
MySQL, TDSQL-C for MySQL, MariaDB, TDSQL for MySQL, Distributed Cache, MongoDB, self-built MySQL
Configuration
Instance specifications, including CPU size, memory, and disk capacity.
MySQL, TDSQL-C for MySQL, MariaDB, TDSQL for MySQL, Distributed Cache, MongoDB, self-built MySQL
Access Mode
Access methods for self-built MySQL instances include agent-based access and direct access.
Self-Built MySQL
CPU(max)
The maximum CPU utilization from 00:00 of the previous day to 00:00 of the next day.
MySQL, TDSQL-C for MySQL, MariaDB, TDSQL for MySQL, self-built MySQL
MEM (max)
The maximum memory utilization from 00:00 of the previous day to 00:00 of the next day.
MySQL, TDSQL-C for MySQL, self-built MySQL
Total Requests (max)
The maximum total requests from 00:00 of the previous day to 00:00 of the next day.
MySQL, MariaDB, TDSQL for MySQL, self-built MySQL
Disk Utilization (max)
The maximum disk utilization from 00:00 of the previous day to 00:00 of the next day.
MySQL, MariaDB, TDSQL for MySQL, self-built MySQL
Slow SQL (max)
The maximum slow query number from 00:00 of the previous day to 00:00 of the next day.
MySQL, TDSQL-C for MySQL, MariaDB, TDSQL for MySQL, self-built MySQL
Big Table Count (max)
The maximum value of the large tables from 00:00 of the previous day to 00:00 of the next day.
MySQL, TDSQL-C for MySQL, self-built MySQL
CPU Utilization (max)
The maximum CPU utilization from 00:00 of the previous day to 00:00 of the next day.
Distributed Cache
Memory Utilization (max)
The maximum memory utilization from 00:00 of the previous day to 00:00 of the next day.
Distributed Cache
Connection Utilization (max)
The maximum connection utilization from 00:00 of the previous day to 00:00 of the next day.
Distributed Cache
Inbound Traffic Utilization (max)
The maximum inbound traffic utilization from 00:00 of the previous day to 00:00 of the next day.
Distributed Cache
Outbound Traffic Utilization (max)
The maximum outbound traffic utilization from 00:00 of the previous day to 00:00 of the next day.
Distributed Cache
Read Request Hit Rate (max)
The maximum read request hit rate from 00:00 of the previous day to 00:00 of the next day.
Distributed Cache
P99 Execution Latency (max)
The maximum P99 execution latency from 00:00 of the previous day to 00:00 of the next day.
Distributed Cache
Max Cluster CPU Utilization (max)
The maximum cluster CPU utilization from 00:00 the previous day to 00:00 the next day.
MongoDB
Memory Utilization (max)
The maximum memory usage percentage from 00:00 the previous day to 00:00 the next day.
MongoDB
Disk Utilization (max)
The maximum disk usage percentage from 00:00 the previous day to 00:00 the next day.
MongoDB
Connections (max)
The maximum number of connections from 00:00 the previous day to 00:00 the next day.
MongoDB
Operation
View inspection details: In the Operation column, click View. In the pop-up dialog box, click Click to view or download. View and download the health report in the newly opened browser. For interpretation of the health report, see Viewing Health Report.
Inspection health report SES: Click Email in the Operation column or click Batch Send after selecting multiple database inspection records to email the inspection health reports to the specified recipient. For more information, see SES Inspection Report.
View deduction details: Click Deduction Details in the Operation column to view the details of individual and total deductions in the pop-up dialog box.
MySQL, TDSQL-C for MySQL, MariaDB, TDSQL for MySQL, Distributed Cache, MongoDB, self-built MySQL
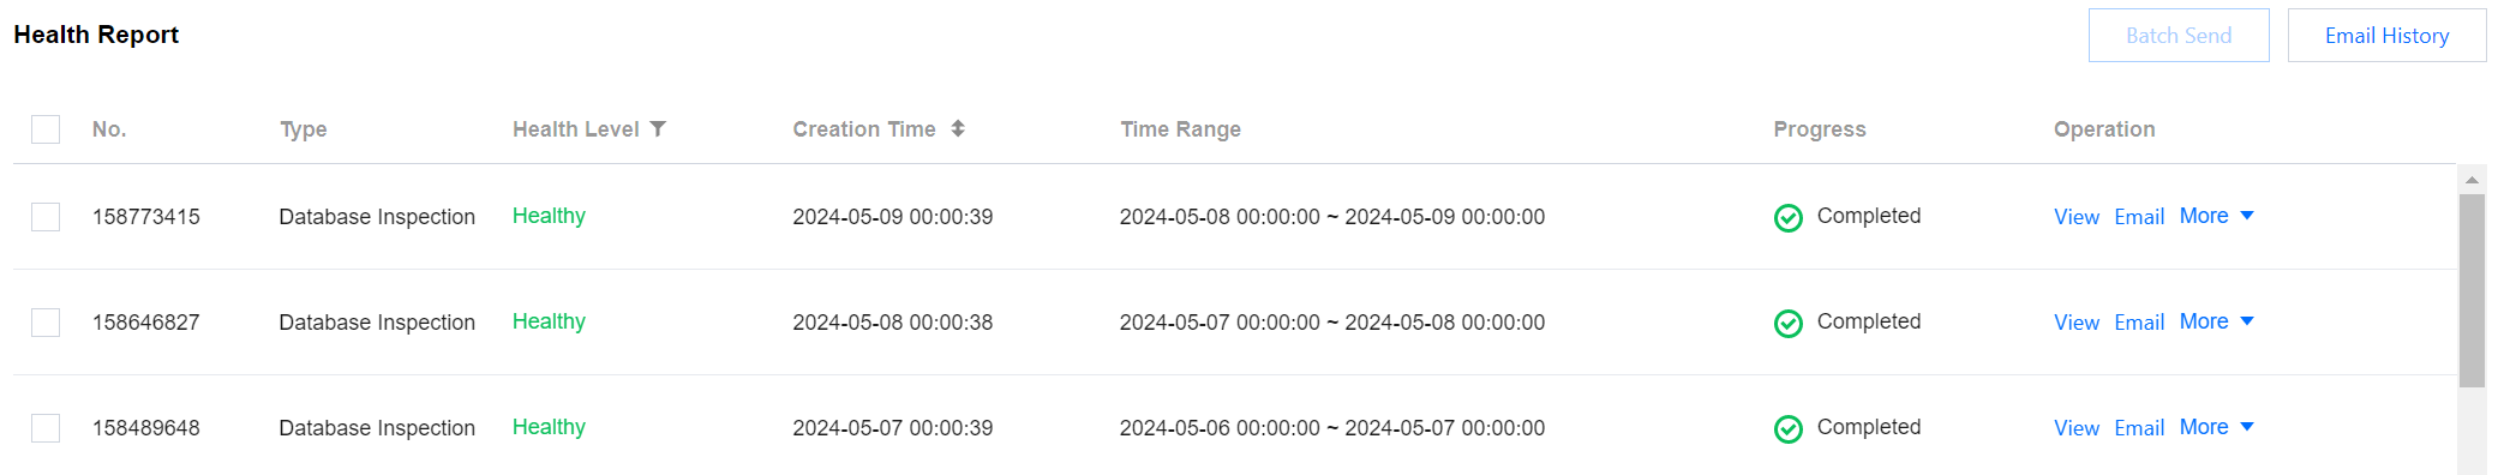
Viewing Health Reports of Database Inspection on the Health Report Page