Using Custom Metrics for Auto Scaling in TKE
Download
Modo Foco
Tamanho da Fonte
Scenario
TKE supports many metrics for elastic scaling based on the custom metrics API, covering CPU, memory, disk, network, and GPU in most HPA scenarios. For more information on the list, see HPA Metrics. For complex scenarios such as automatic scaling based on the QPS per replica, you can install prometheus-adapter to implement auto scaling. Kubernetes provides the custom metrics API and external metrics API for HPA to perform auto scaling based on metrics, allowing users to customize auto scaling as needed. Prometheus-adapter supports the above two APIs. In the actual environment, the custom metrics API can meet most scenarios. This document describes how to use custom metrics for auto scaling through the custom metrics API.
Prerequisites
Created a TKE cluster with version 1.14 or later. For details, see Creating a Cluster.
You have purchased a Prometheus instance and completed the correlation between the instance and the TKE cluster. For details, see Prometheus Getting Started and Associating with Cluster.
You have installed Helm.
Directions
Opening the monitoring metric
This document takes the Golang service application as an example, which opens the
httpserver_requests_total metric and records HTTP requests. This metric can be used to calculate the QPS value of the service application, as shown below:package mainimport ("github.com/prometheus/client_golang/prometheus""github.com/prometheus/client_golang/prometheus/promhttp""net/http""strconv")var (HTTPRequests = prometheus.NewCounterVec(prometheus.CounterOpts{Name: "httpserver_requests_total",Help: "Number of the http requests received since the server started",},[]string{"status"},))func init() {prometheus.MustRegister(HTTPRequests)}func main(){http.HandleFunc("/", func(w http.ResponseWriter, r *http.Request) {path := r.URL.Pathcode := 200switch path {case "/test":w.WriteHeader(200)w.Write([]byte("OK"))case "/metrics":promhttp.Handler().ServeHTTP(w, r)default:w.WriteHeader(404)w.Write([]byte("Not Found"))}HTTPRequests.WithLabelValues(strconv.Itoa(code)).Inc()})http.ListenAndServe(":80", nil)}
Deploying the service application
Package the application into a container image and deploy it to the cluster. Take the Deployment mode as an example:
apiVersion: apps/v1kind: Deploymentmetadata:name: httpservernamespace: httpserverspec:replicas: 1selector:matchLabels:app: httpservertemplate:metadata:labels:app: httpserverspec:containers:- name: httpserverimage: ccr.ccs.tencentyun.com/tkedemo/custom-metrics-demo:v1.0.0imagePullPolicy: Always---apiVersion: v1kind: Servicemetadata:name: httpservernamespace: httpserverlabels:app: httpserverannotations:prometheus.io/scrape: "true"prometheus.io/path: "/metrics"prometheus.io/port: "http"spec:type: ClusterIPports:- port: 80protocol: TCPname: httpselector:app: httpserver
Collecting service monitoring metrics through PROM instance
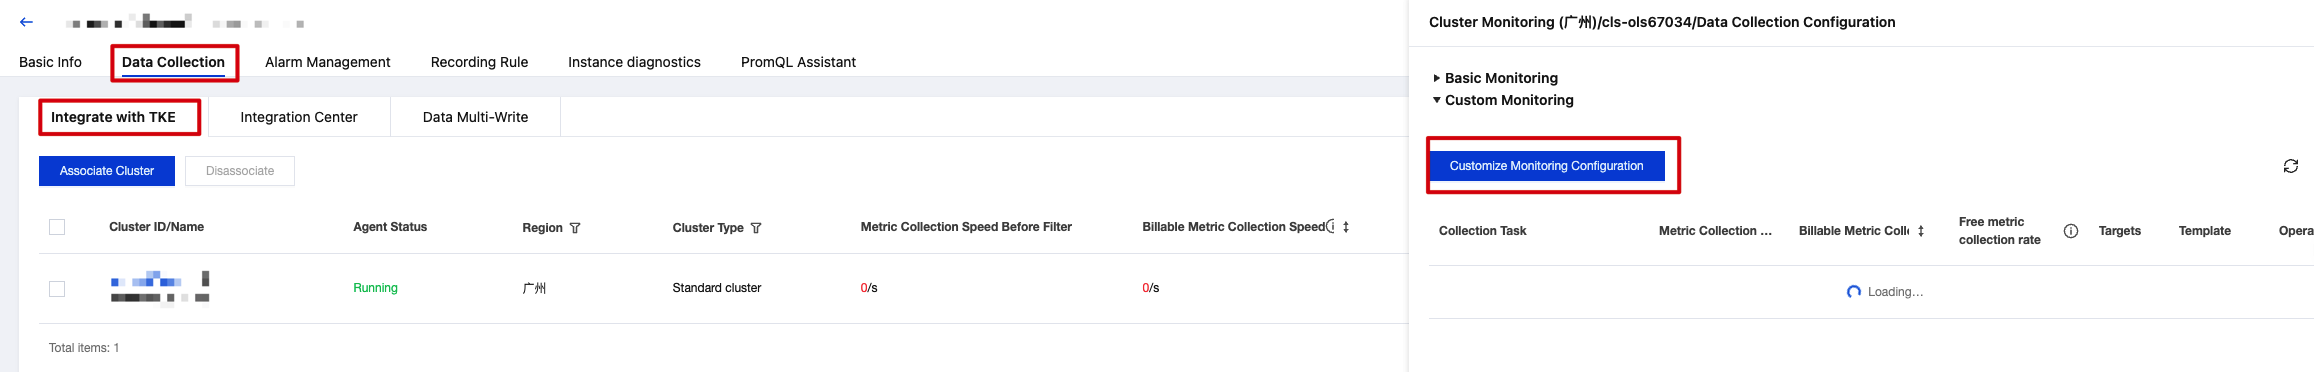
1. you have completed the correlation between the Prometheus monitoring instance and the TKE cluster, you can directly log in to the TKE console and select TMP from the left sidebar.
2. Select a monitoring instance. On the Data Collection > Integrate with TKE page, find the target instance, click on the right Data Collection Configuration, and enter the data collection configuration list page.
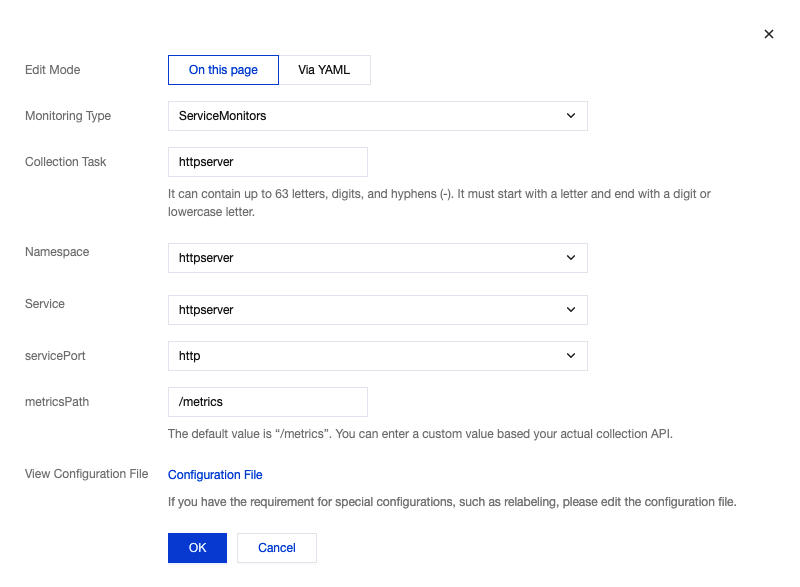
3. Click Customize Monitoring Configuration to configure new collection rules for the deployed business. Click OK, as shown in the following figure:
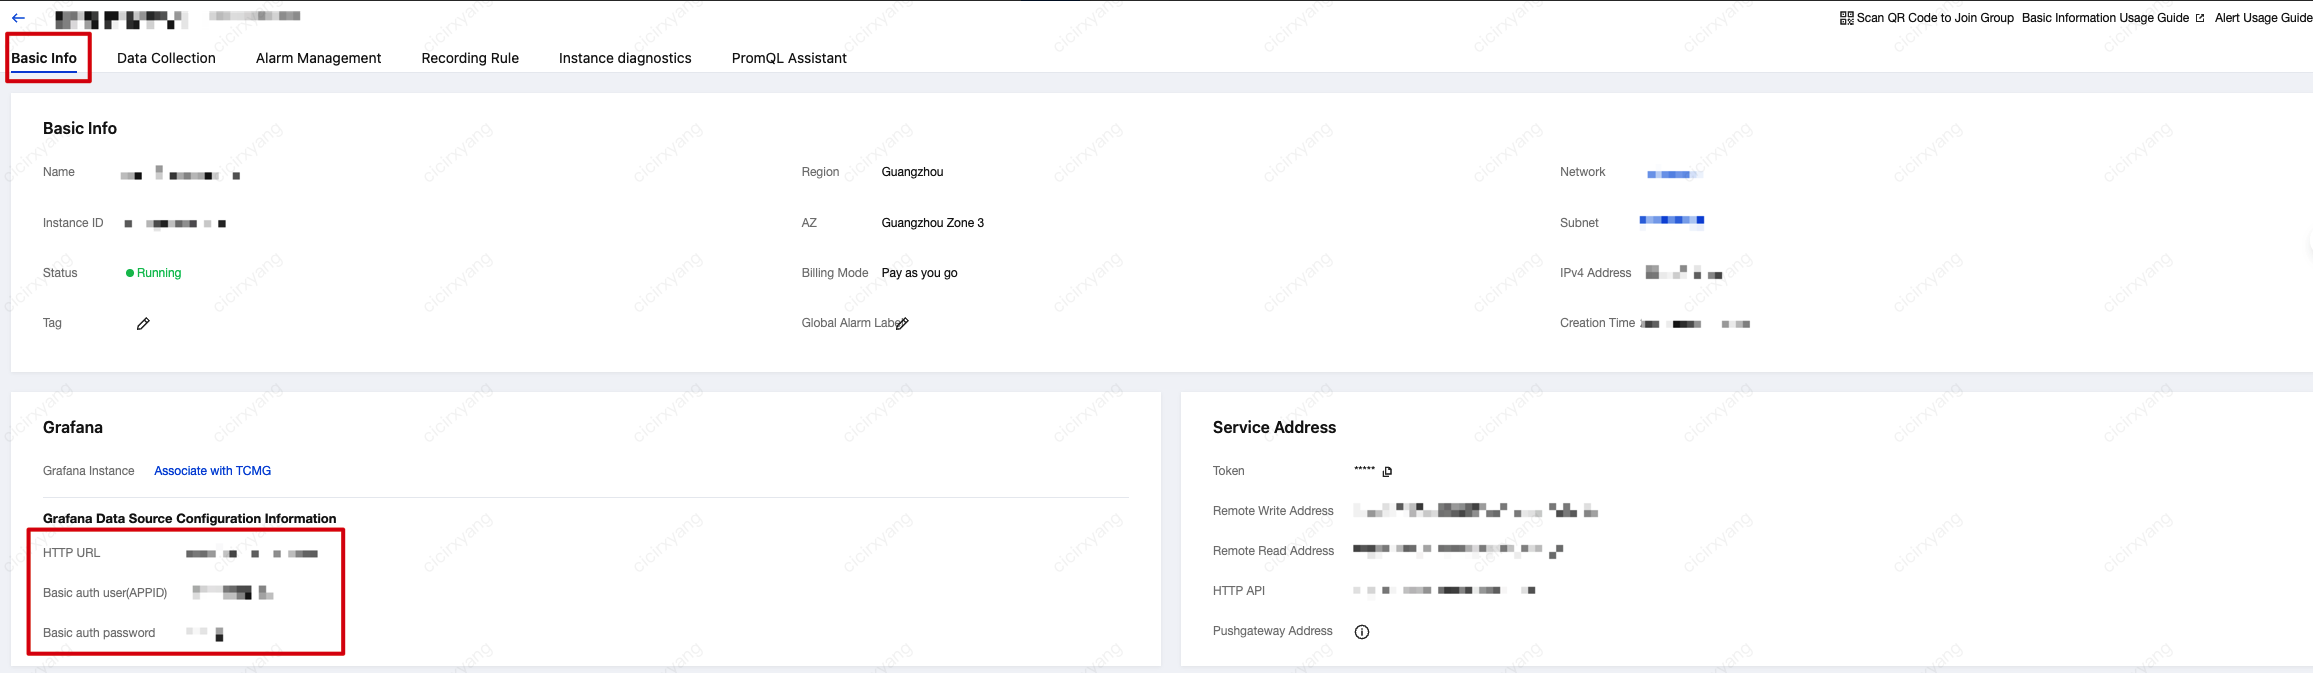
4. lick in the upper left corner of the Basic Info page , retrieve the access address (HTTP URL) for the Prometheus API and the authentication account information (Basic auth user and Basic auth password). Use these subsequently when installing prometheus-adapter, as shown below:
Installing prometheus-adapter
1. Use Helm to install prometheus-adapter. Please confirm and configure custom metrics before installation. According to the example in Opening the monitoring metric above, the
httpserver_requests_total metric is used in the service to record HTTP requests, so you can calculate the QPS of each service Pod through the following PromQL, as shown below:sum(rate(http_requests_total[2m])) by (pod)
2. Convert it to the configuration of prometheus-adapter. Create
values.yaml with the following content:rules:default: falsecustom:- seriesQuery: 'httpserver_requests_total'resources:template: <<.Resource>>name:matches: "httpserver_requests_total"as: "httpserver_requests_qps" # QPS metric calculated by PromQLmetricsQuery: sum(rate(<<.Series>>{<<.LabelMatchers>>}[1m])) by (<<.GroupBy>>)prometheus:url: http://127.0.0.1 # Replace with the Prometheus API address (HTTP URL) obtained in the previous step (without port)port: 9090extraArguments:- --prometheus-header=Authorization=Basic {token}#Among them{token}is the base64 encoding of the Basic auth user:Basic auth password string you get from console.
3. Run the following Helm command to install prometheus-adapter, as shown below:
Note:
Before installation, you need to delete the TKE's registered Custom Metrics API using the following command:
kubectl delete apiservice v1beta1.custom.metrics.k8s.io
helm repo add prometheus-community https://prometheus-community.github.io/helm-chartshelm repo update# Helm 3helm install prometheus-adapter prometheus-community/prometheus-adapter -f values.yaml# Helm 2# helm install --name prometheus-adapter prometheus-community/prometheus-adapter -f values.yaml
4. Add prometheus authentication and authorization parameters.
The current charts provided by the community do not expose authentication-related parameters, which can cause authentication failures and prevent normal connection to the TMP service. To solve this problem, you can refer to the community documentation. The solution requires you to manually modify the Prometheus Adapter deployment and add
--prometheus-header=Authorization=Basic {token} to the adapter startup parameters, where {token} is the base64-encoded Basic auth user:Basic auth password obtained from the console.Verifying installation result
If the installation is correct, you can run the following command to view the configured QPS related metrics returned by the Custom Metrics API, as shown below:
$ kubectl get --raw /apis/custom.metrics.k8s.io/v1beta1{"kind": "APIResourceList","apiVersion": "v1","groupVersion": "custom.metrics.k8s.io/v1beta1","resources": [{"name": "jobs.batch/httpserver_requests_qps","singularName": "","namespaced": true,"kind": "MetricValueList","verbs": ["get"]},{"name": "pods/httpserver_requests_qps","singularName": "","namespaced": true,"kind": "MetricValueList","verbs": ["get"]},{"name": "namespaces/httpserver_requests_qps","singularName": "","namespaced": false,"kind": "MetricValueList","verbs": ["get"]}]}
Run the following command to view the QPS value of the Pod, as shown below:
Note:
In the following example, the value is 500m, which means the value of QPS is 0.5 request/second.
$ kubectl get --raw /apis/custom.metrics.k8s.io/v1beta1/namespaces/httpserver/pods/*/httpserver_requests_qps{"kind": "MetricValueList","apiVersion": "custom.metrics.k8s.io/v1beta1","metadata":{"selfLink": "/apis/custom.metrics.k8s.io/v1beta1/namespaces/httpserver/pods/%2A/httpserver_requests_qps"},"items": [{"describedObject": {"kind": "Pod","namespace": "httpserver","name": "httpserver-6f94475d45-7rln9","apiVersion": "/v1"},"metricName": "httpserver_requests_qps","timestamp": "2020-11-17T09:14:36Z","value": "500m","selector": null}]}
Testing HPA
If the scaling out is triggered when the average QPS of each service Pod reaches 50 requests/second, and the minimum and maximum number of replicas are 1 and 1000 respectively, the configuration example will be as follows:
apiVersion: autoscaling/v2beta2kind: HorizontalPodAutoscalermetadata:name: httpservernamespace: httpserverspec:minReplicas: 1maxReplicas: 1000scaleTargetRef:apiVersion: apps/v1kind: Deploymentname: httpservermetrics:- type: Podspods:metric:name: httpserver_requests_qpstarget:averageValue: 50type: AverageValue
Run the following command to test the service and observe whether the scaling out is triggered, as shown below:
# Use wrk or another HTTP stress test tool to perform stress tests on the httpserver service.$ kubectl proxy --port=8080 > /dev/null 2>&1 &$ wrk -t12 -c3000 -d60s http://localhost:8080/api/v1/namespaces/httpserver/services/httpserver:http/proxy/test$ kubectl get hpa -n httpserverNAME REFERENCE TARGETS MINPODS MAXPODS REPLICAS AGEhttpserver Deployment/httpserver 35266m/50 1 1000 2 50m# Observe the scaling of hpa$ kubectl get pods -n httpserverNAME READY STATUS RESTARTS AGEhttpserver-7f8dffd449-pgsb7 0/1 ContainerCreating 0 4shttpserver-7f8dffd449-wsl95 1/1 Running 0 93shttpserver-7f8dffd449-pgsb7 1/1 Running 0 4s
If the scaling out is triggered normally, it means that HPA has implemented auto scaling based on service custom metrics.
Ajuda e Suporte
Esta página foi útil?
Você também pode entrar em contato com a Equipe de vendas ou Enviar um tíquete em caso de ajuda.
comentários