tencent cloud

TencentDB for DBbrain

Release Notes and Announcements
Release Notes
Announcements
Product Introduction
Overview
Features
Strengths
Use Cases
Feature List
Region List
Purchase Guide
Operation Guide
Cloud Access Management
Self-Built Database Access
Instance Overview
Instance Management
Monitoring and Alarms
Health Report and Kill Session Report Management
MySQL/TDSQL-C for MySQL Performance Optimization
TDSQL for MySQL/MariaDB Performance Optimization
Distributed cache database (Distributed Cache) diagnostic optimization
MongoDB Performance Optimization
Full-Link Analysis
Practical Tutorial
Fixing High CPU Utilization on MySQL Instance
Fixing Lock Conflict on MySQL Instance
How to Address High CPU Utilization Issues in Distributed Cache Instances
Fixing High CPU Utilization in MongoDB Instance
Fixing Short Node Oplog Retention Period in MongoDB Instance
API Documentation
History
Introduction
Introduction
API Category
Making API Requests
Session Killing APIs
Exception Detection APIs
Other APIs
Redis related APIs
Health Report Email Sending APIs
Space Analysis APIs
Slow Log Analysis APIs
Security Audit APIs
Database Audit APIs
Data Types
Error Codes
DBbrain APIs 2019-10-16
FAQs
Self-Built Database Issues
MySQL Performance
Product
Service Level Agreement
Glossary
Contact Us

Latency Analysis (Hot Key Analysis)

PDF
Focus Mode
Font Size
Last updated: 2026-03-19 17:23:59
In Tencent Cloud Distributed Cache, frequently accessed keys are called hot keys. When a Distributed Cache database receives a lot of requests to access a hot key, the traffic gets too concentrated and reaches the upper limit of the physical ENI, which will cause problems or even downtime of the Distributed Cache service.
With DBbrain's hot key analysis feature, you can find hot keys quickly to optimize the service accordingly.

Viewing Hot Key Analysis

1. Log in to the DBbrain Console.
2. In the left sidebar, choose Performance Optimization.
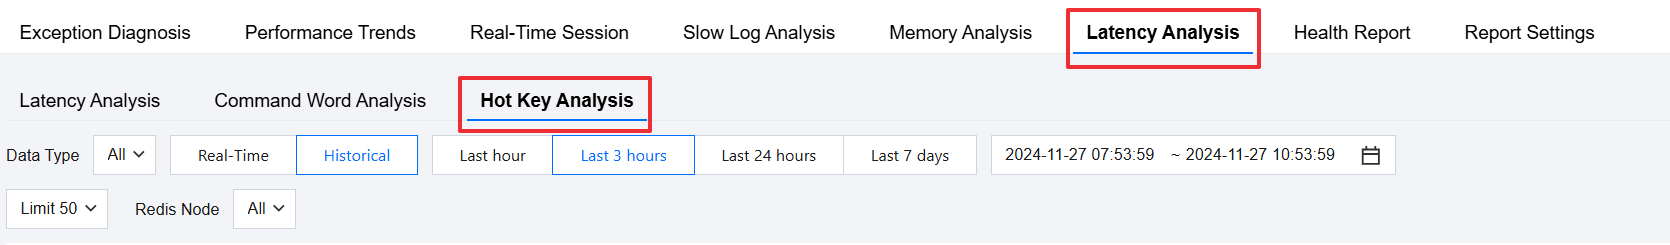
3. At the top of the page, select the corresponding database and instance ID, then select Latency Analysis > Hot Key Analysis tab.


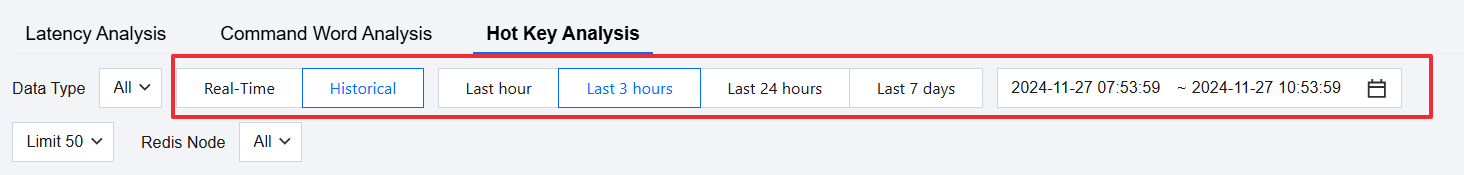
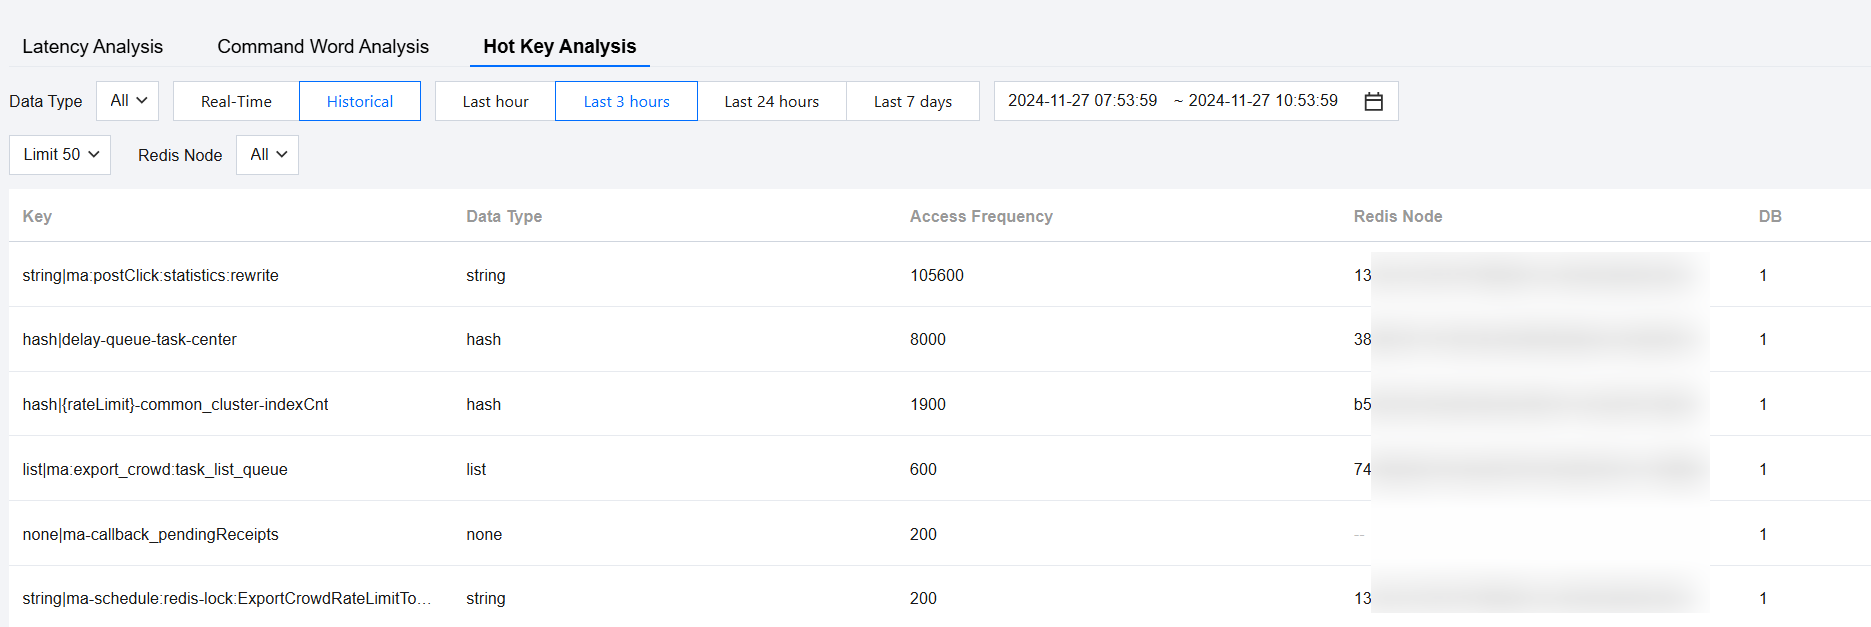
4. On the Hot Key Analysis page, select the data type and time period. The time period can be switched between real-time and historical views to analyze the data.
Data type: Supports All, string, list, set, hash, sortedset, stream, and none.
Real-time view: Displays the analysis results at each time point in real-time.
Historical view: Displays the analysis results in the last hour, last 3 hours, last 24 hours, last 7 days, or a custom time range.


Select the Redis Node to be analyzed and the List Item Limit (supporting a limit of 50 items, and a limit of 100 items), and view the analysis data.


Help and Support

Was this page helpful?

Help us improve! Rate your documentation experience in 5 mins.

Feedback