tencent cloud

TencentDB for DBbrain

Release Notes and Announcements
Release Notes
Announcements
Product Introduction
Overview
Features
Strengths
Use Cases
Feature List
Region List
Purchase Guide
Operation Guide
Cloud Access Management
Self-Built Database Access
Instance Overview
Instance Management
Monitoring and Alarms
Health Report and Kill Session Report Management
MySQL/TDSQL-C for MySQL Performance Optimization
TDSQL for MySQL/MariaDB Performance Optimization
Distributed cache database (Distributed Cache) diagnostic optimization
MongoDB Performance Optimization
Full-Link Analysis
Practical Tutorial
Fixing High CPU Utilization on MySQL Instance
Fixing Lock Conflict on MySQL Instance
How to Address High CPU Utilization Issues in Distributed Cache Instances
Fixing High CPU Utilization in MongoDB Instance
Fixing Short Node Oplog Retention Period in MongoDB Instance
API Documentation
History
Introduction
Introduction
API Category
Making API Requests
Session Killing APIs
Exception Detection APIs
Other APIs
Redis related APIs
Health Report Email Sending APIs
Space Analysis APIs
Slow Log Analysis APIs
Security Audit APIs
Database Audit APIs
Data Types
Error Codes
DBbrain APIs 2019-10-16
FAQs
Self-Built Database Issues
MySQL Performance
Product
Service Level Agreement
Glossary
Contact Us

Latency Analysis (Command Word Analysis)

PDF
Focus Mode
Font Size
Last updated: 2026-03-19 17:23:59
In addition to the analysis of big keys and hot keys, DBbrain also provides Tencent Cloud Distributed Cache command word analysis to help you better understand the current conditions of your database.

Viewing command word analysis

1. Log in to the DBbrain Console.
2. In the left sidebar, choose Performance Optimization.
3. At the top of the page, select the corresponding database and instance ID, then select Latency Analysis > Command Word Analysis tab.

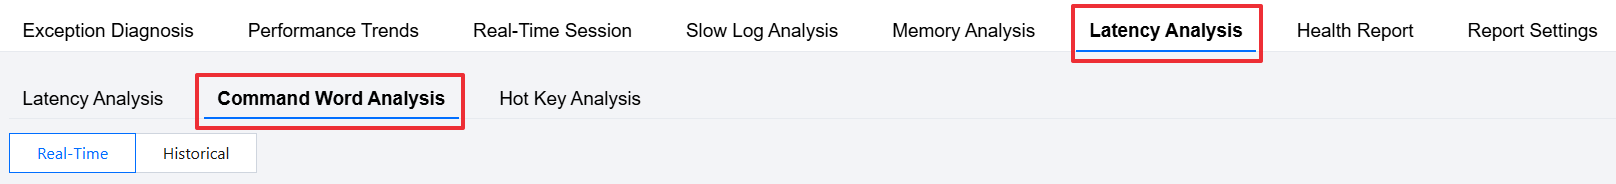
4. On the Command Word Analysis page, select a real-time or historical time range.
Real-time view: Displays the analysis results at each time point in real-time.
Historical view: Displays the analysis results in the last 30 minutes, last 6 hours, last 24 hours, or a custom time range.

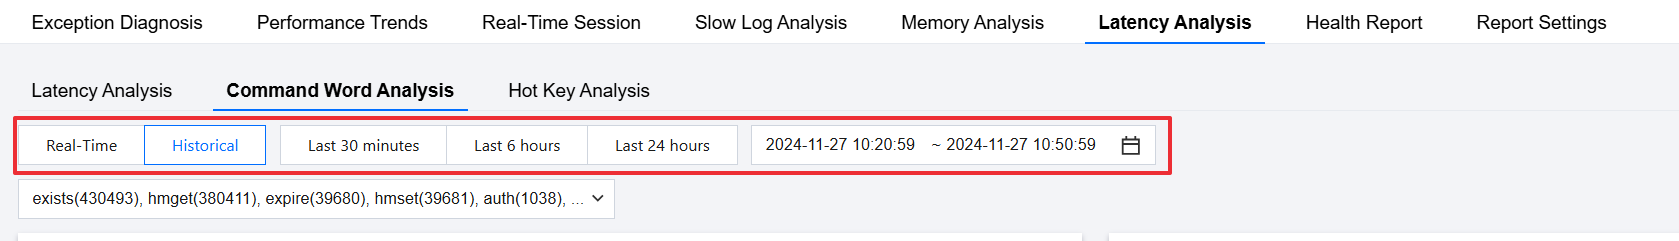
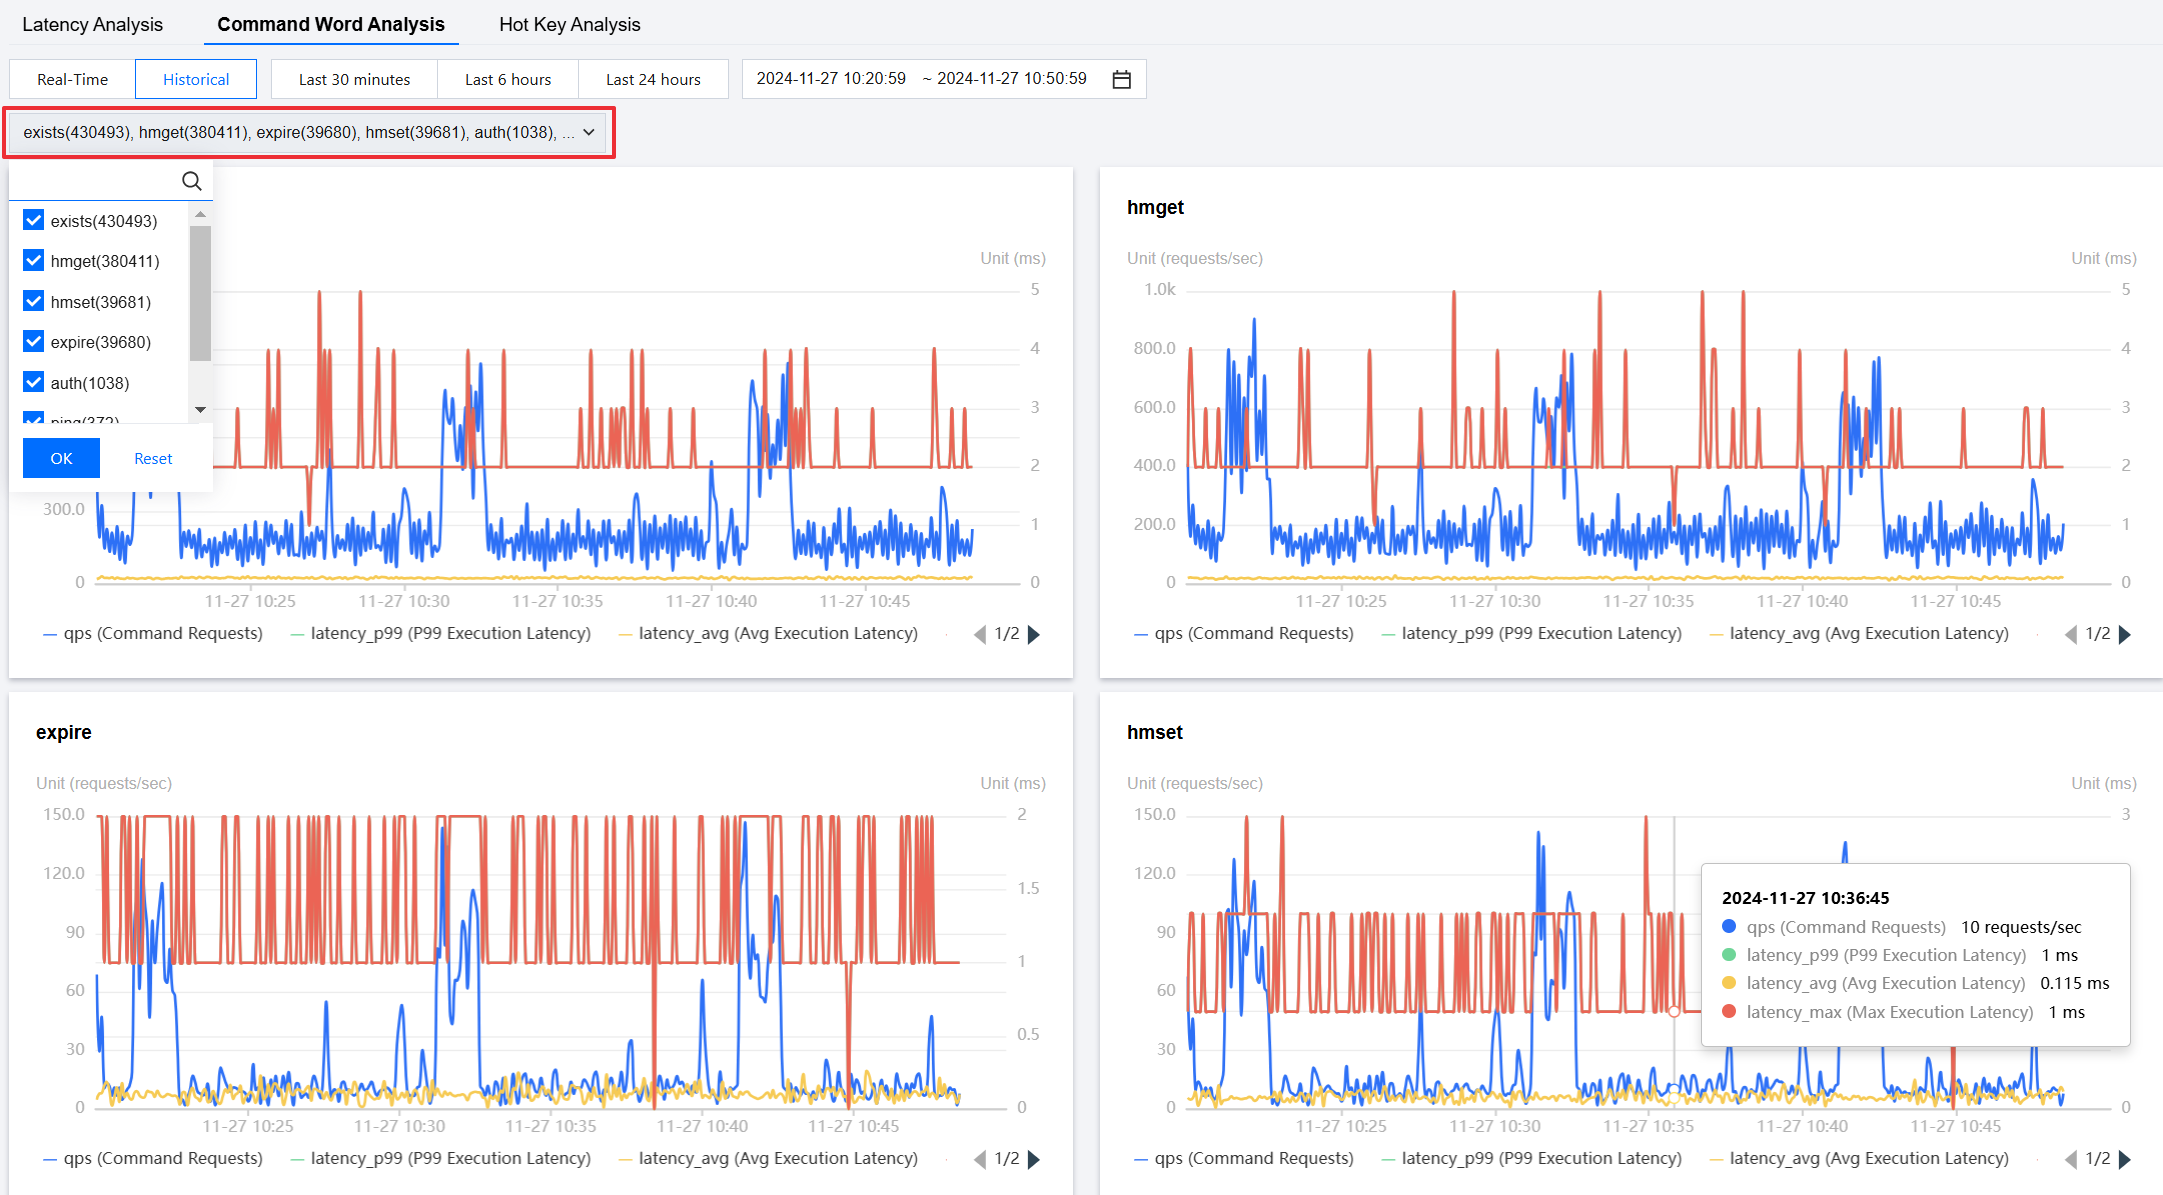
5. Select a command type, click OK to view the command word analysis.


Help and Support

Was this page helpful?

Help us improve! Rate your documentation experience in 5 mins.

Feedback