2. Click Test Statistics on the left sidebar and select API monitoring.
3. On the Test Statistics page, analyze the test data in multiple dimensions such as map, line chart, figure, and detailed data.
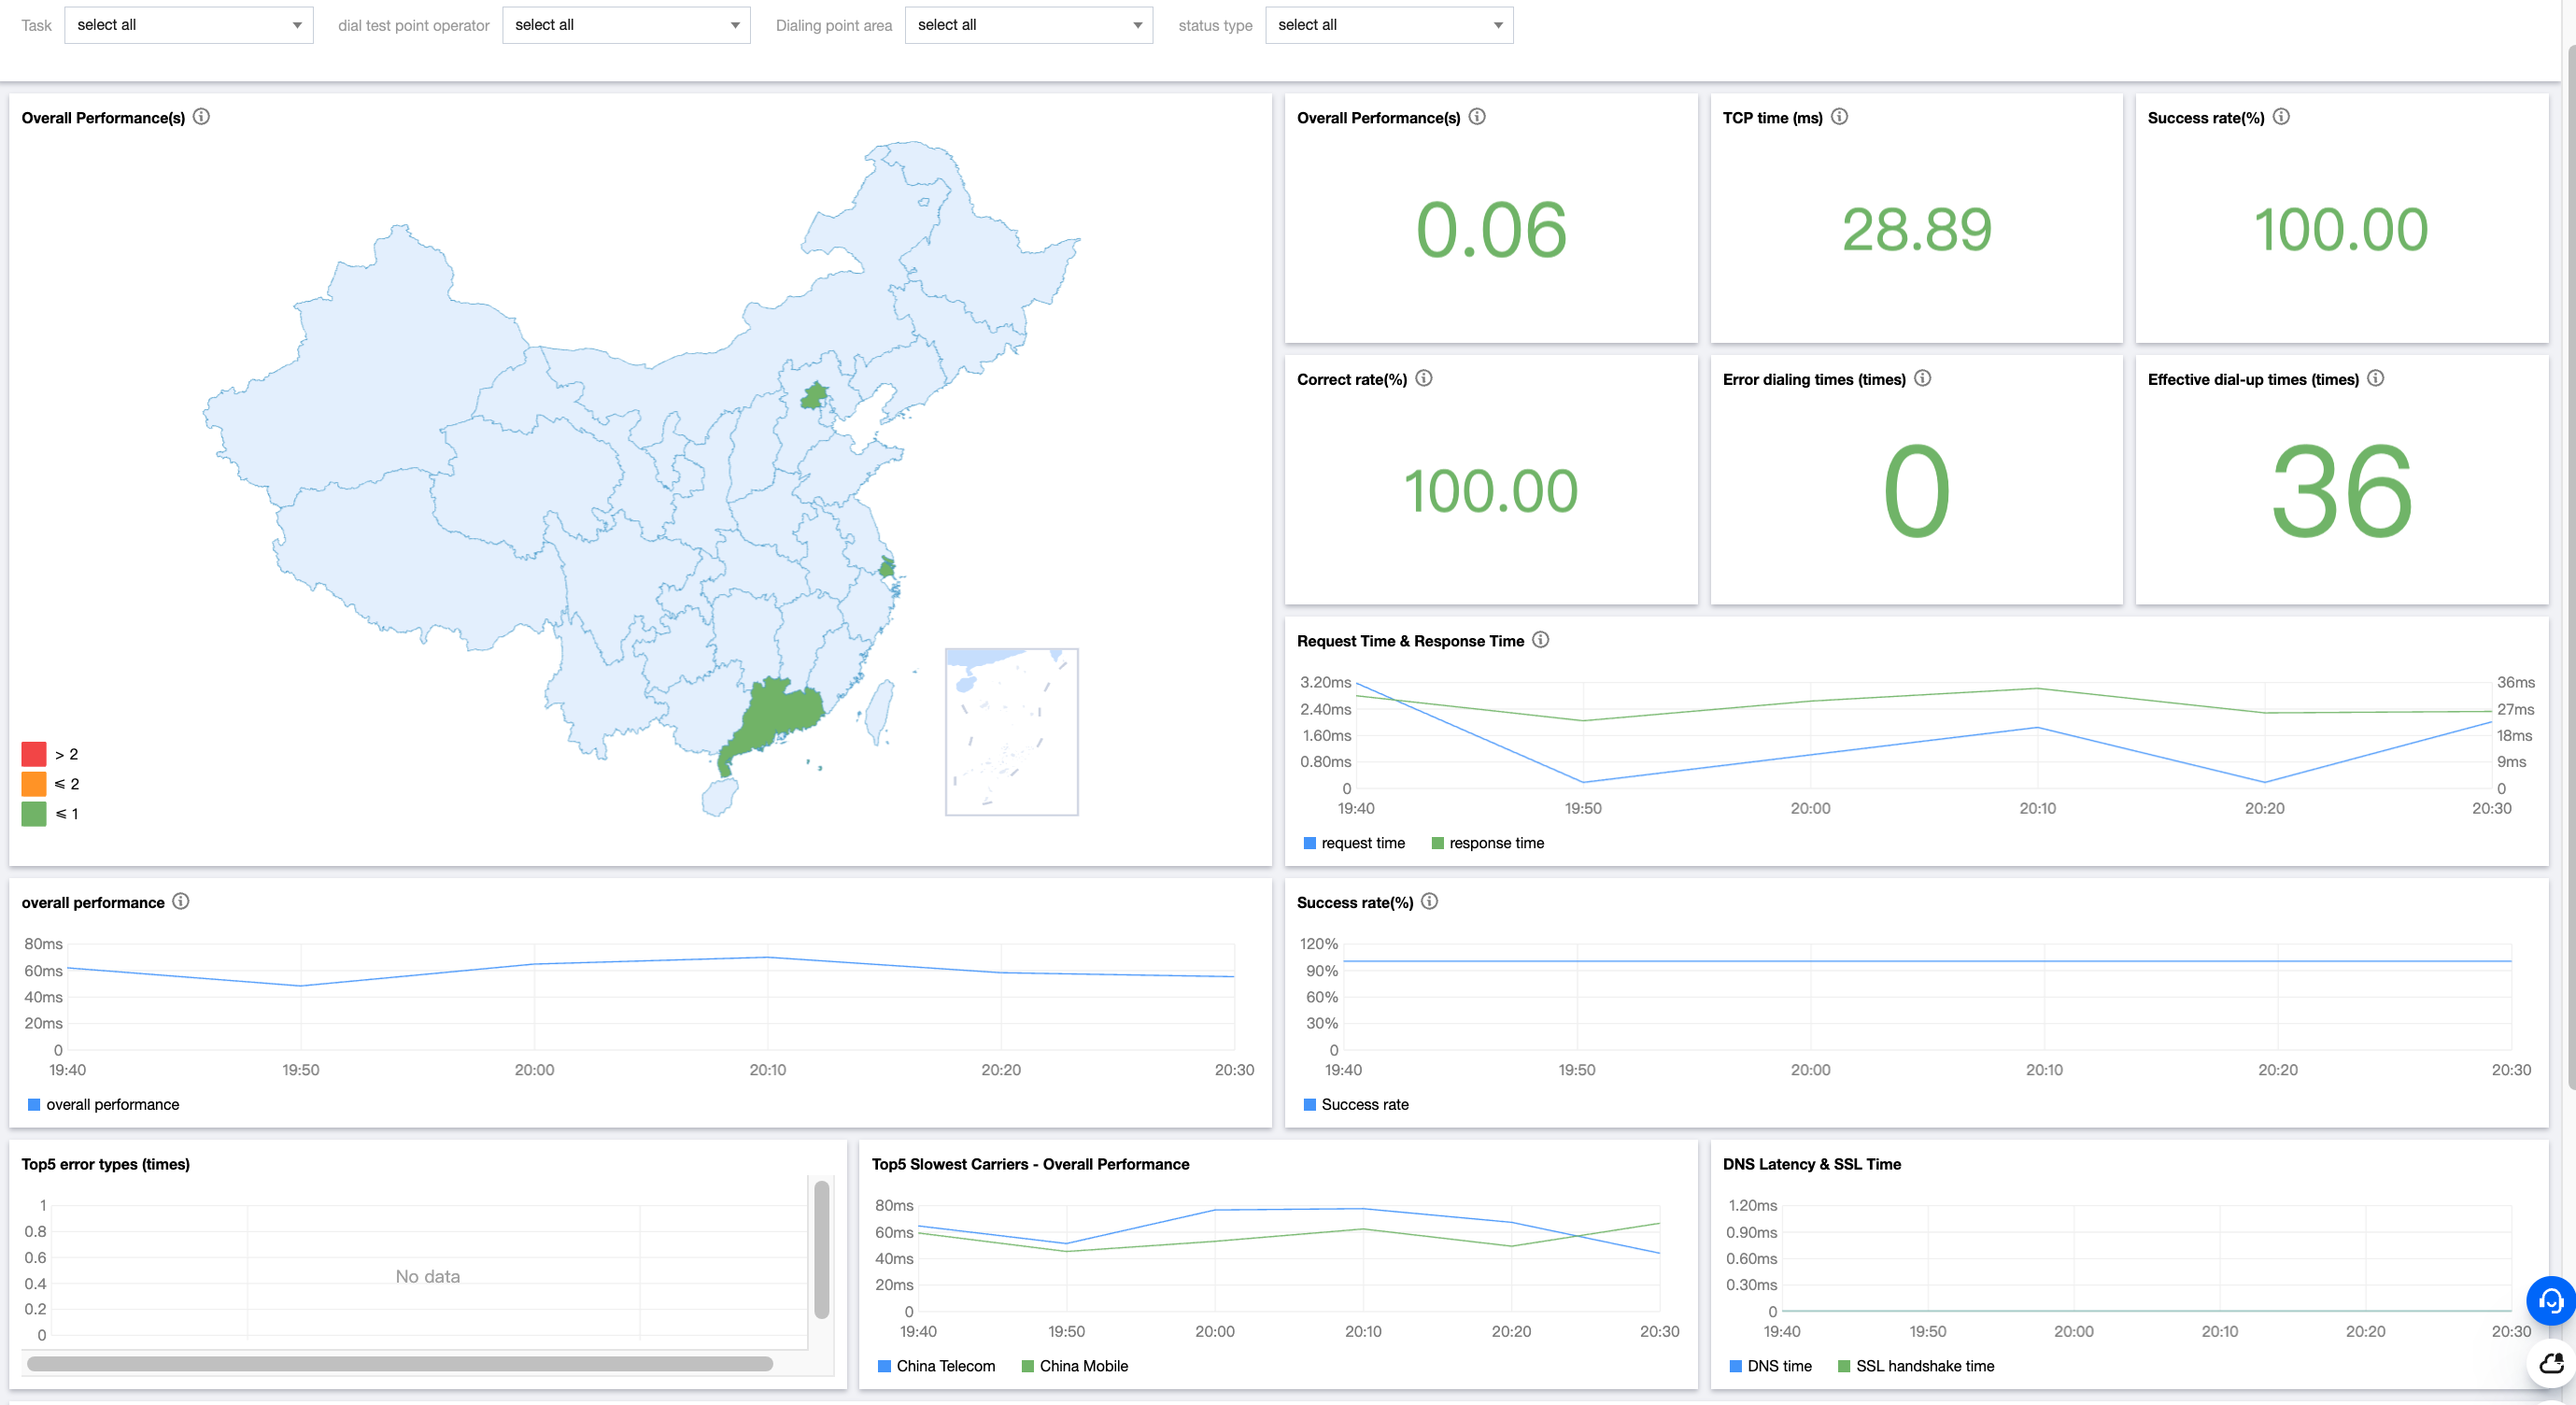
Metric description
Metric
Description
Overall performance (s)
The time from the start of the DNS process to the data receiving.
TCP time (s)
The time taken to establish a TCP connection between the client and the target server.
Success rate (%)
The rate of successful access requests to the target by the client performing the test tasks, which is calculated as the number of valid test tasks / total number of test tasks * 100%.
Accuracy (%)
The ratio of the data that passed the verification to all the returned correct data. Passing the verification means passing the verification in the verification method configured in the protocol configuration item.
Errors
Number of errors in the protocol test.
Valid tests
Number of valid data samples.
Request time (s)
The time taken to send a protocol request.
Response time (s)
The time taken for the client to receive the first response packet from the server after sending the data.
SSL handshake time (s)
The time taken by an SSL handshake.
Top 5 error types
The top five error types of the most errors.
Top 5 slowest ISPs
The top five ISPs with the poorest overall performance.