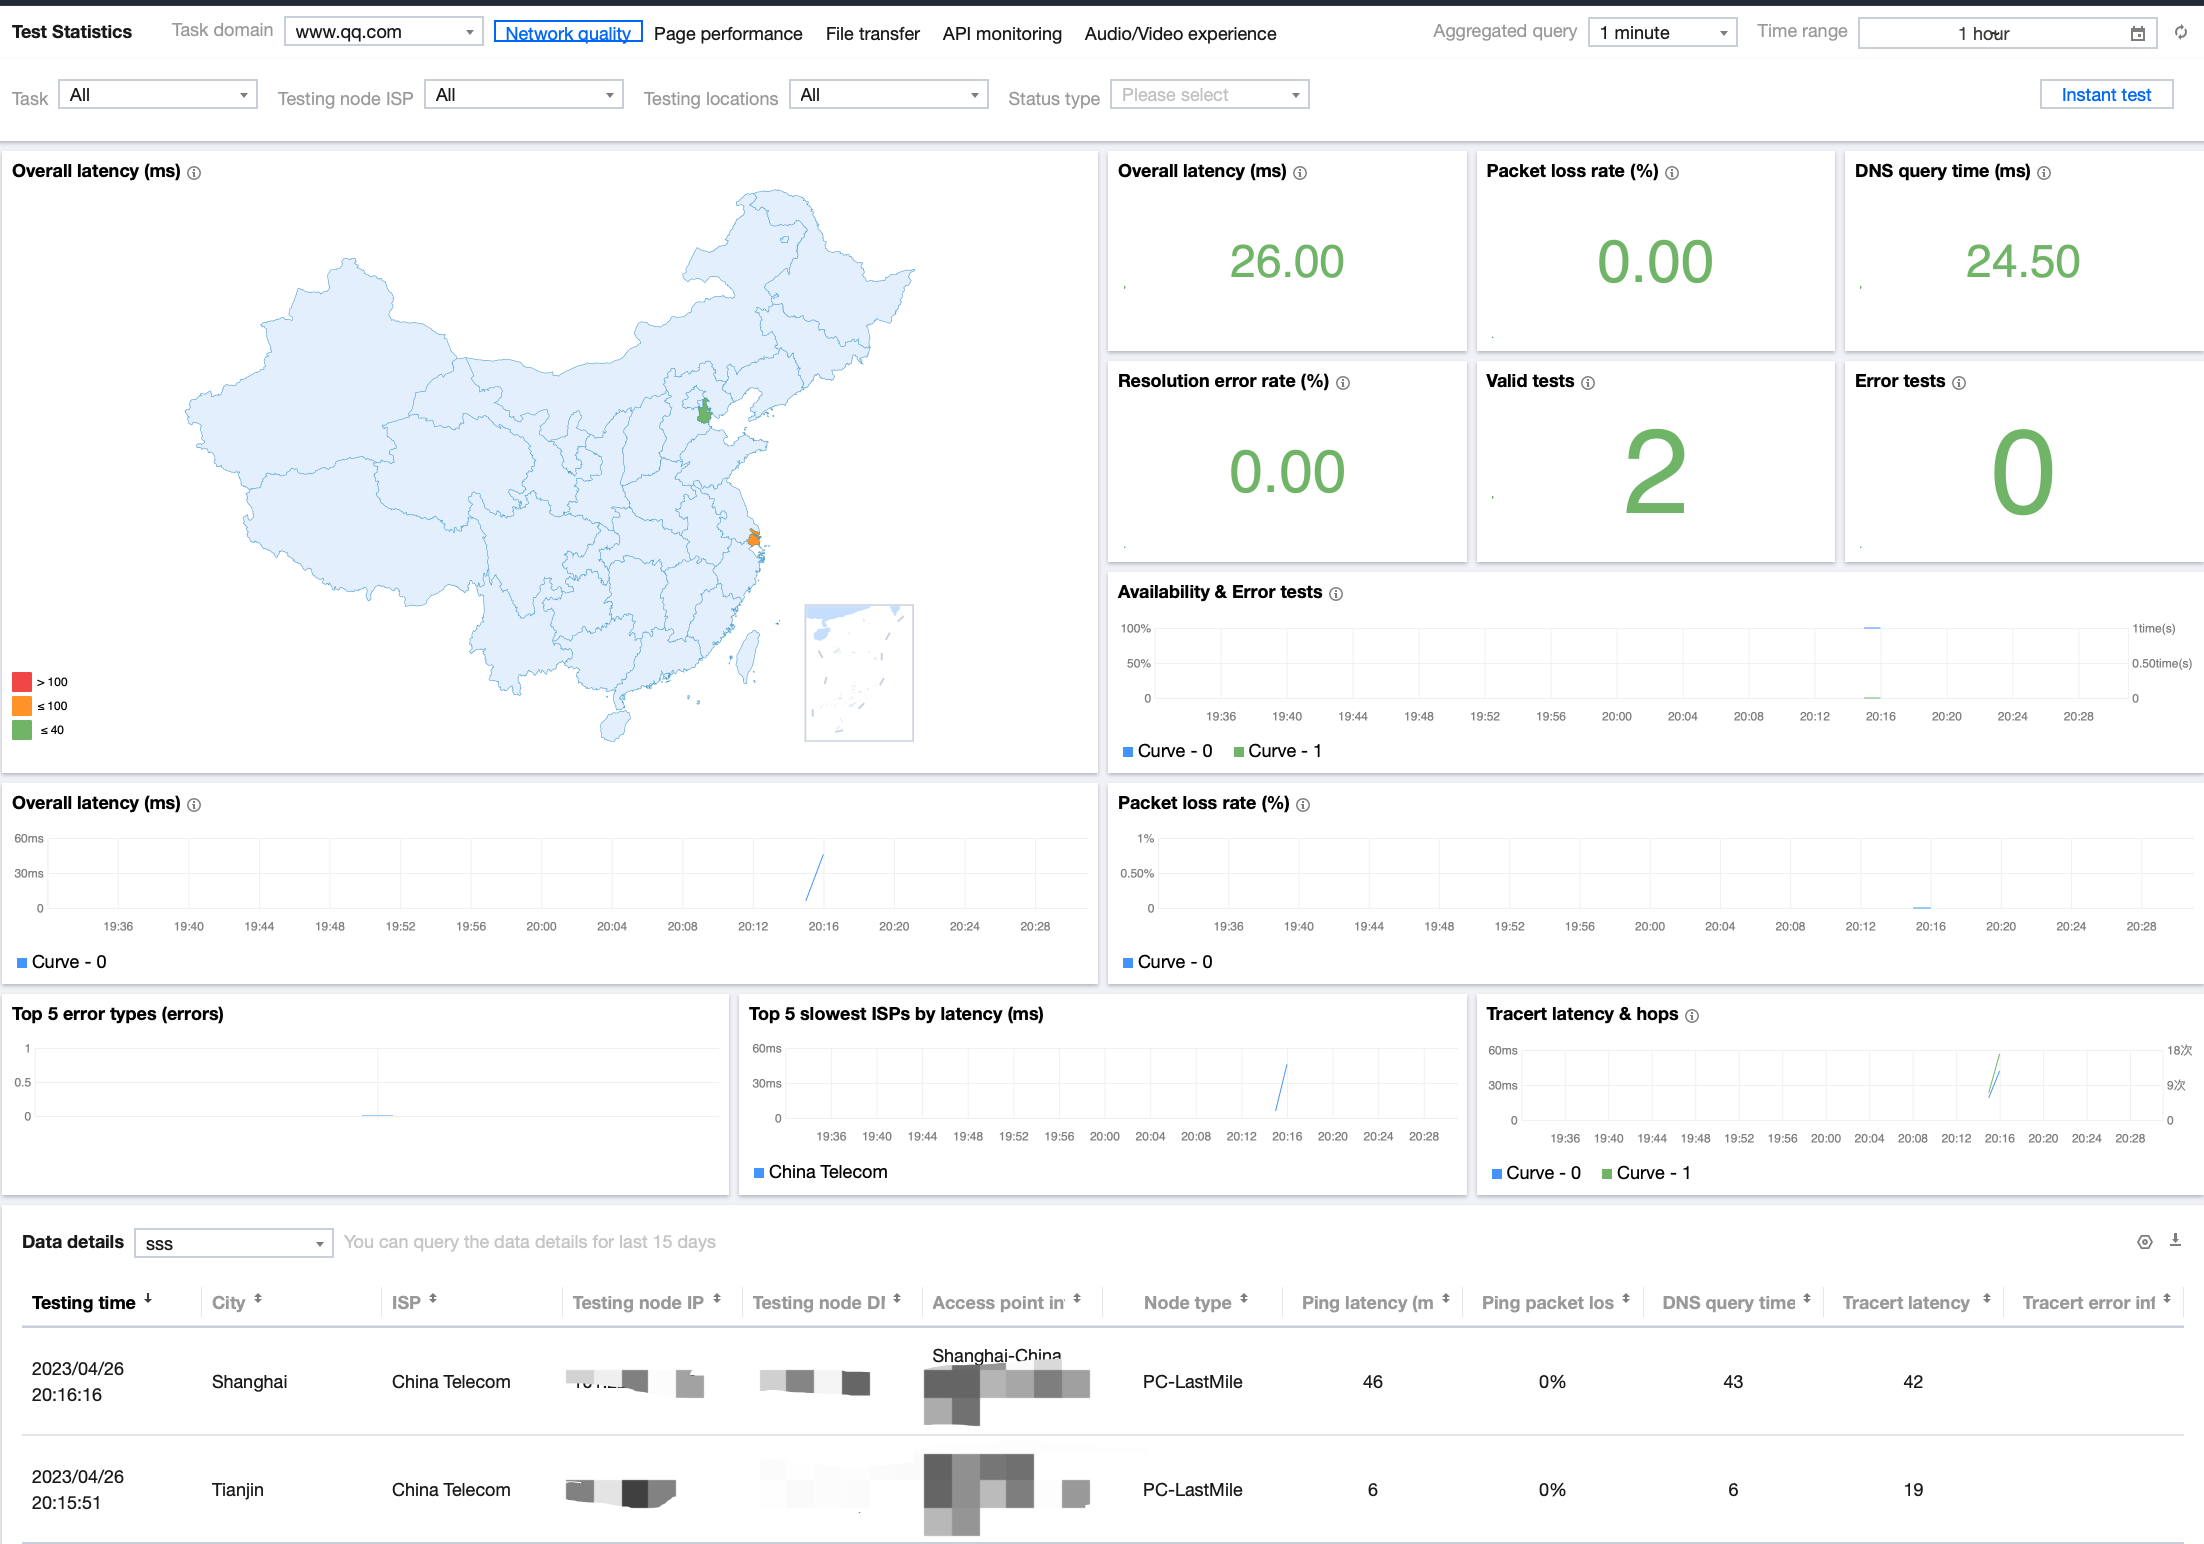
2. Click Test Statistics on the left sidebar and select Network quality.
3. On the Test Statistics page, analyze the test data in multiple dimensions such as map, line chart, figure, and detailed data.
Metric description
Metric
Description
Latency (ms)
The time taken by a message or packet to travel from source to destination, which is subject to the internet routing. If a channel is slow or too crowded, the latency may be high, or data packets may be lost.
Packet loss rate (%)
The ratio of the number of lost packets to the total number of transferred packets, which may be due to physical line failure, device failure, network congestion, route error, etc.
DNS query duration (ms)
The time taken to convert an input domain to an IP.
DNS error rate (%)
The ratio of DNS errors, which is calculated as the number of DNS errors / total number of domains * 100%.
Valid tests
Number of valid data samples.
Invalid tests
Number of invalid data samples.
Availability (%)
The rate of successful access requests to the target by the client performing the test task, which is calculated as the number of valid test tasks / total number of test tasks * 100%.
Tracert latency (%)
The average latency of all hops in a Tracert.
Tracert hops
Number of network devices passed.
Top 5 error types
The top five error types of the most errors.
Top 5 slowest ISPs
The top five ISPs with the highest average latency.