In PTS, the overall situation of requests and checkpoints can be viewed in the TCOP Console > PTS > Test Scenarios under Service Details and Checkpoint Details. The details of sending and receiving individual requests can be viewed in the console under Request Samples. For specific viewing methods, see Report Interpretation.
If there are other requirements for viewing requests or checkpoints in addition to the content in Report Interpretation, for example:
View other request details not recorded in request sampling.
View the configured assertion check failure messages.
View the request content when the assertion check fails.
Others
You can print the content you want to view in Engine Output under Pressure Tester > Logs during execution through log printing.
Notes:
Printing extra logs during the execution of the performance testing task will occupy the resources of the performance testing machine, and the rate of log collection and display in the console is limited. If not necessary, it is not recommended to use this method during formal performance testing.
Request Logs
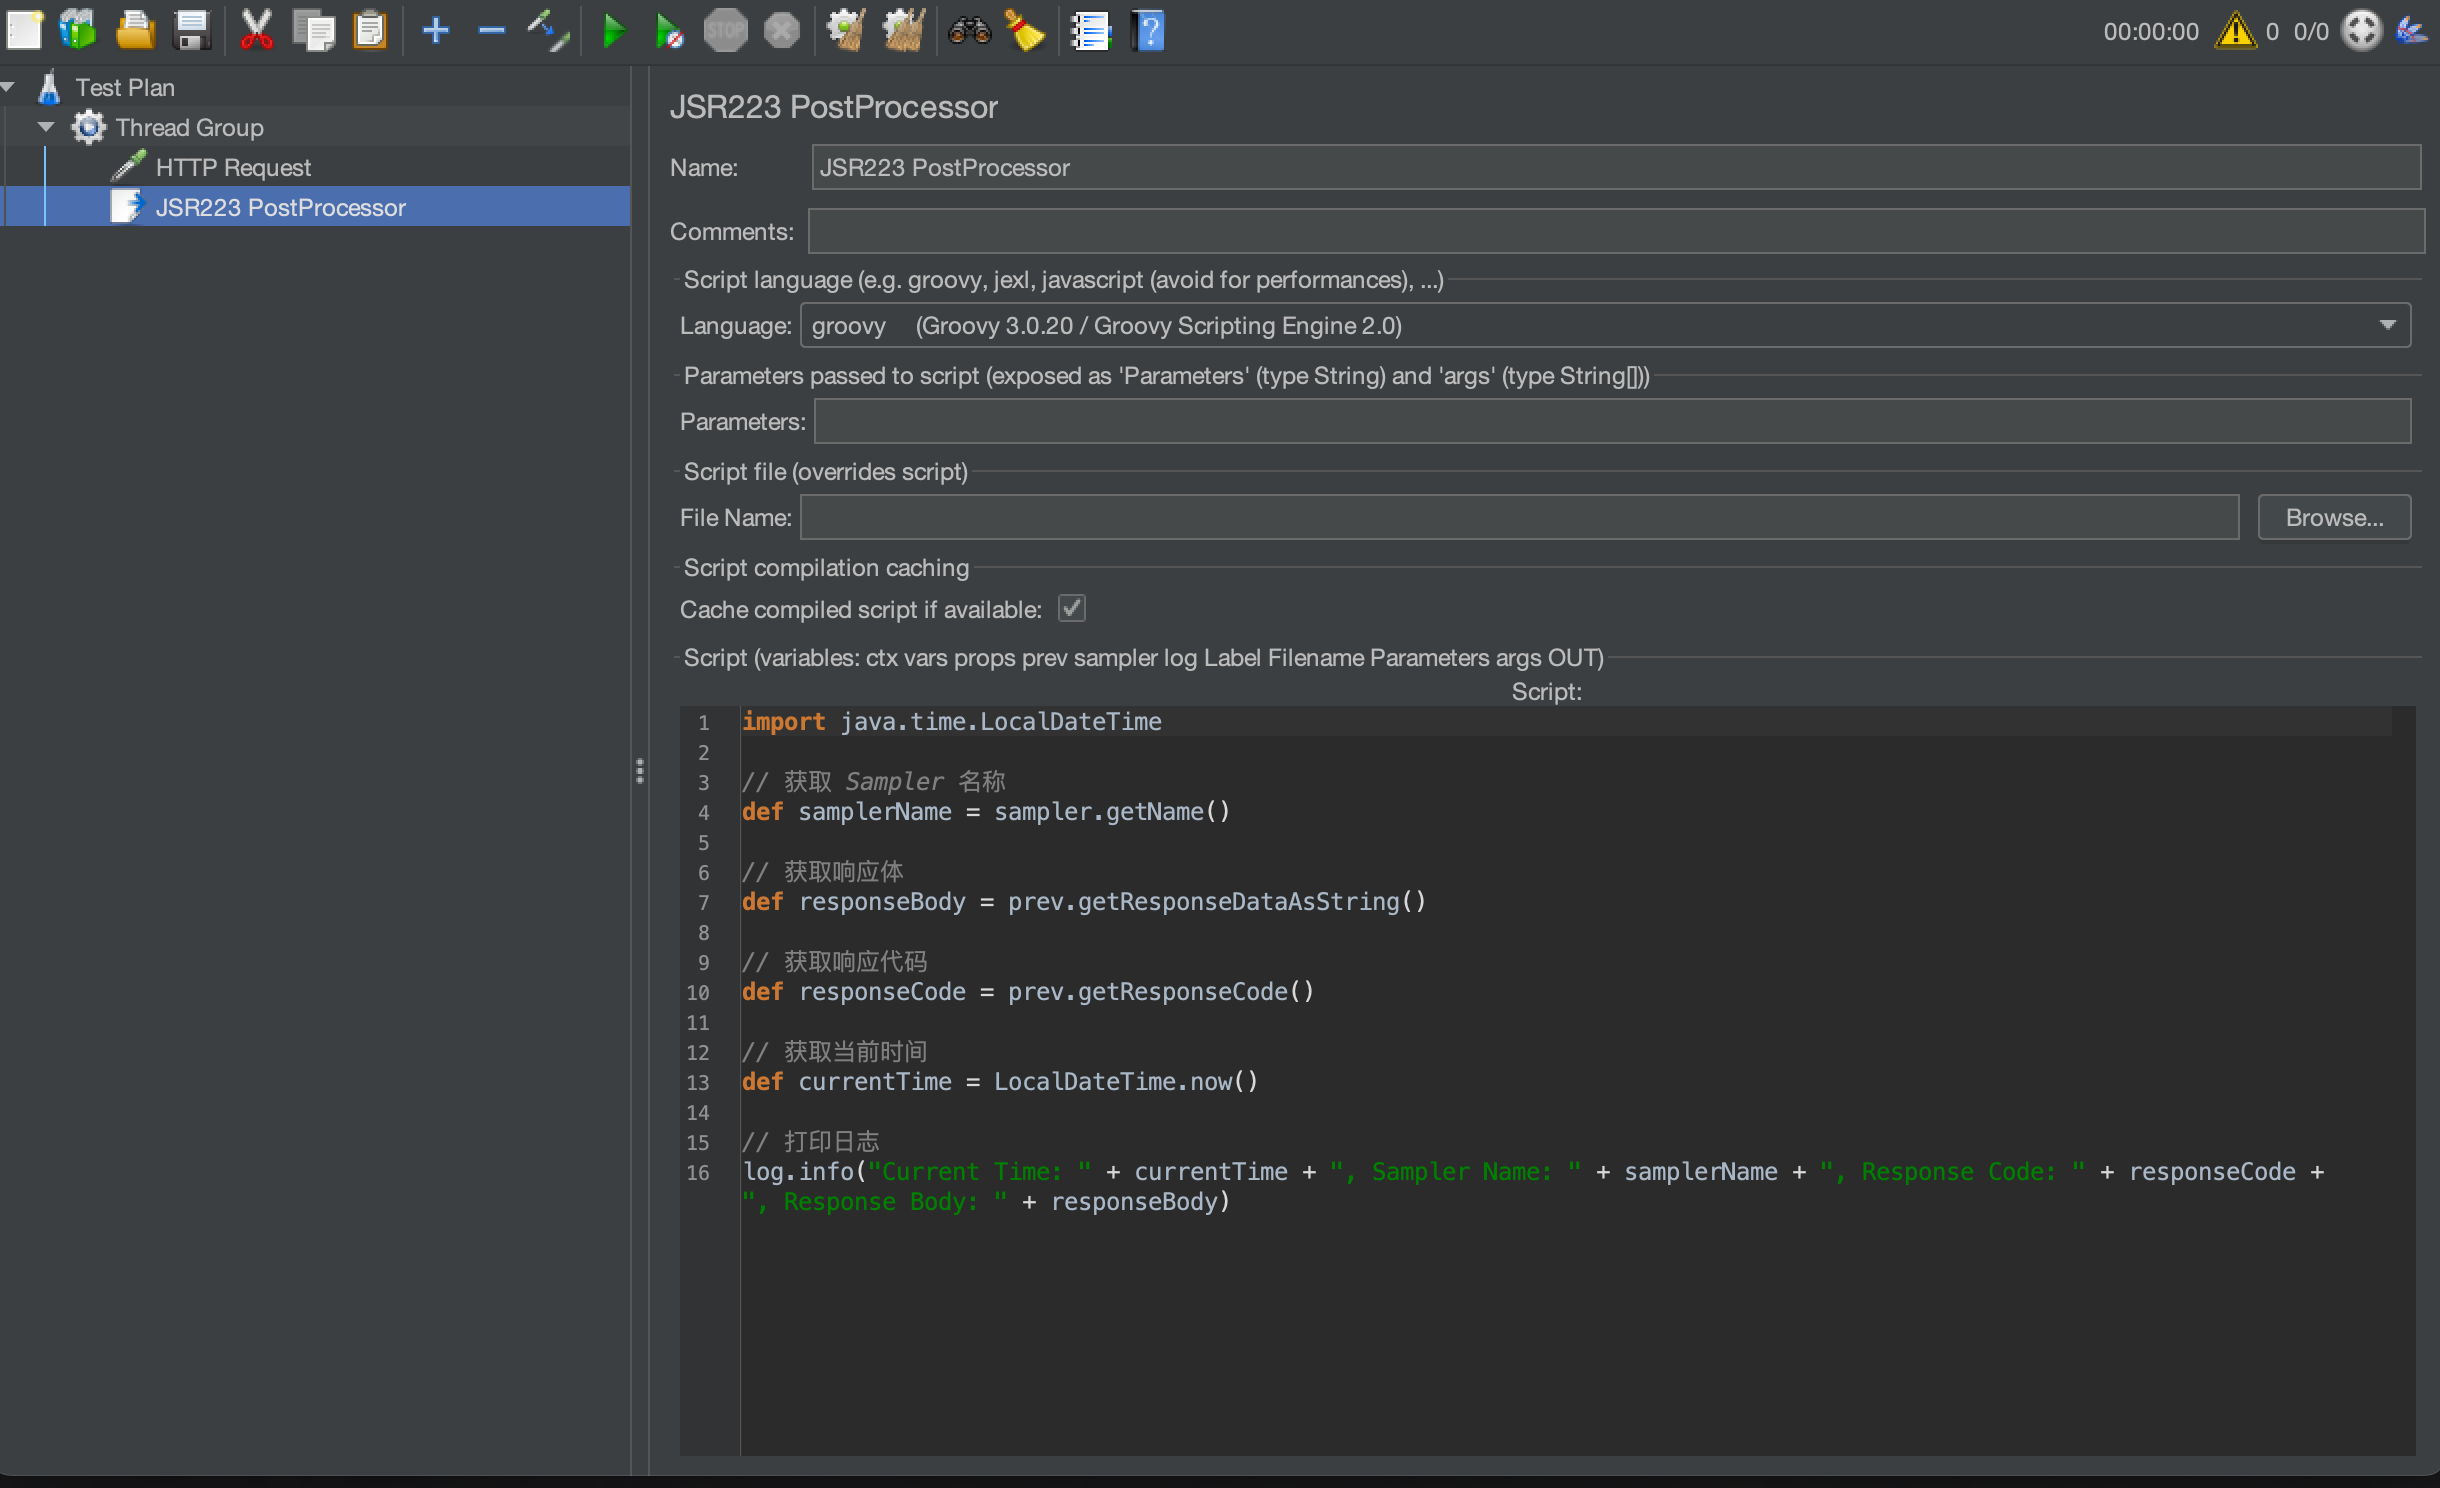
According to the execution order in JMeter, the execution status of requests can be known in the stages after the Sampler is requested. Therefore, you can add a JSR223 PostProcessor after the Sampler of JMeter. As the name implies, the JSR223 PostProcessor can be used after the Sampler to print request details to the engine logs for viewing through a script.
The following is a sample of the Groovy script, where prev represents the result of the request sampling, SampleResult. You can see JMeter Official Documentation for the corresponding methods. If there is any other content to be printed, you can obtain and output the data as needed.
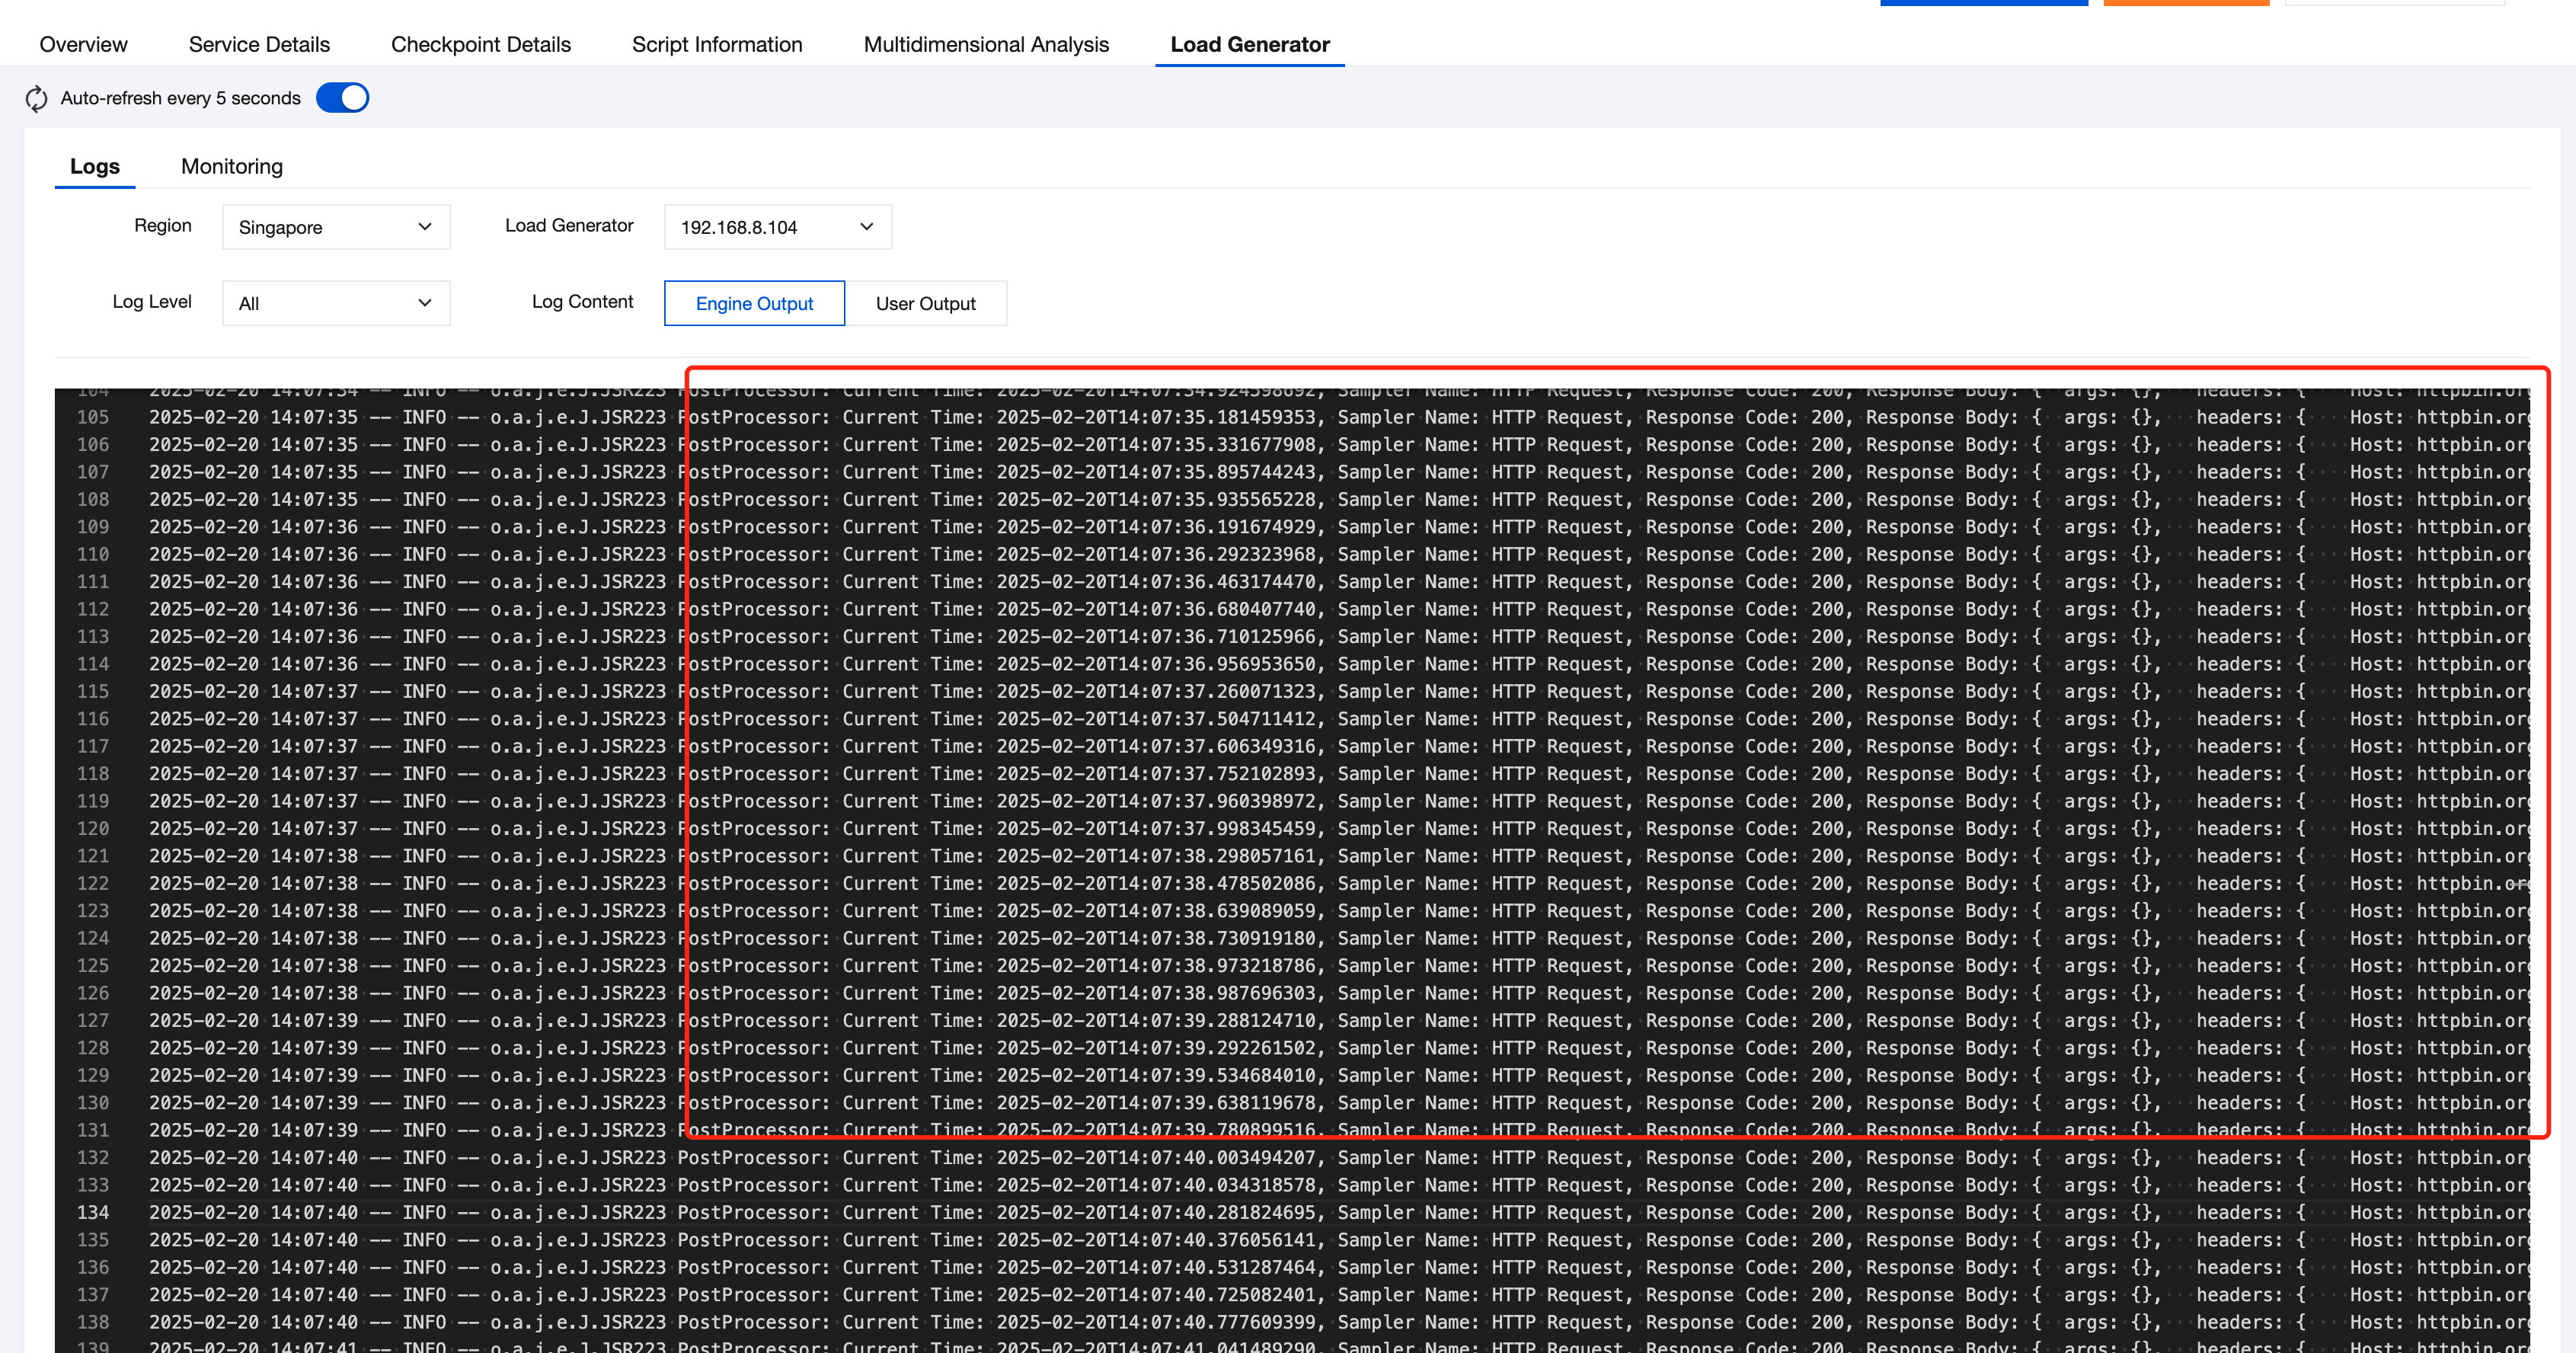
Execute the JMX script on PTS. In Engine Output on the Load Generator tab page in the console, you can view the printed request logs.
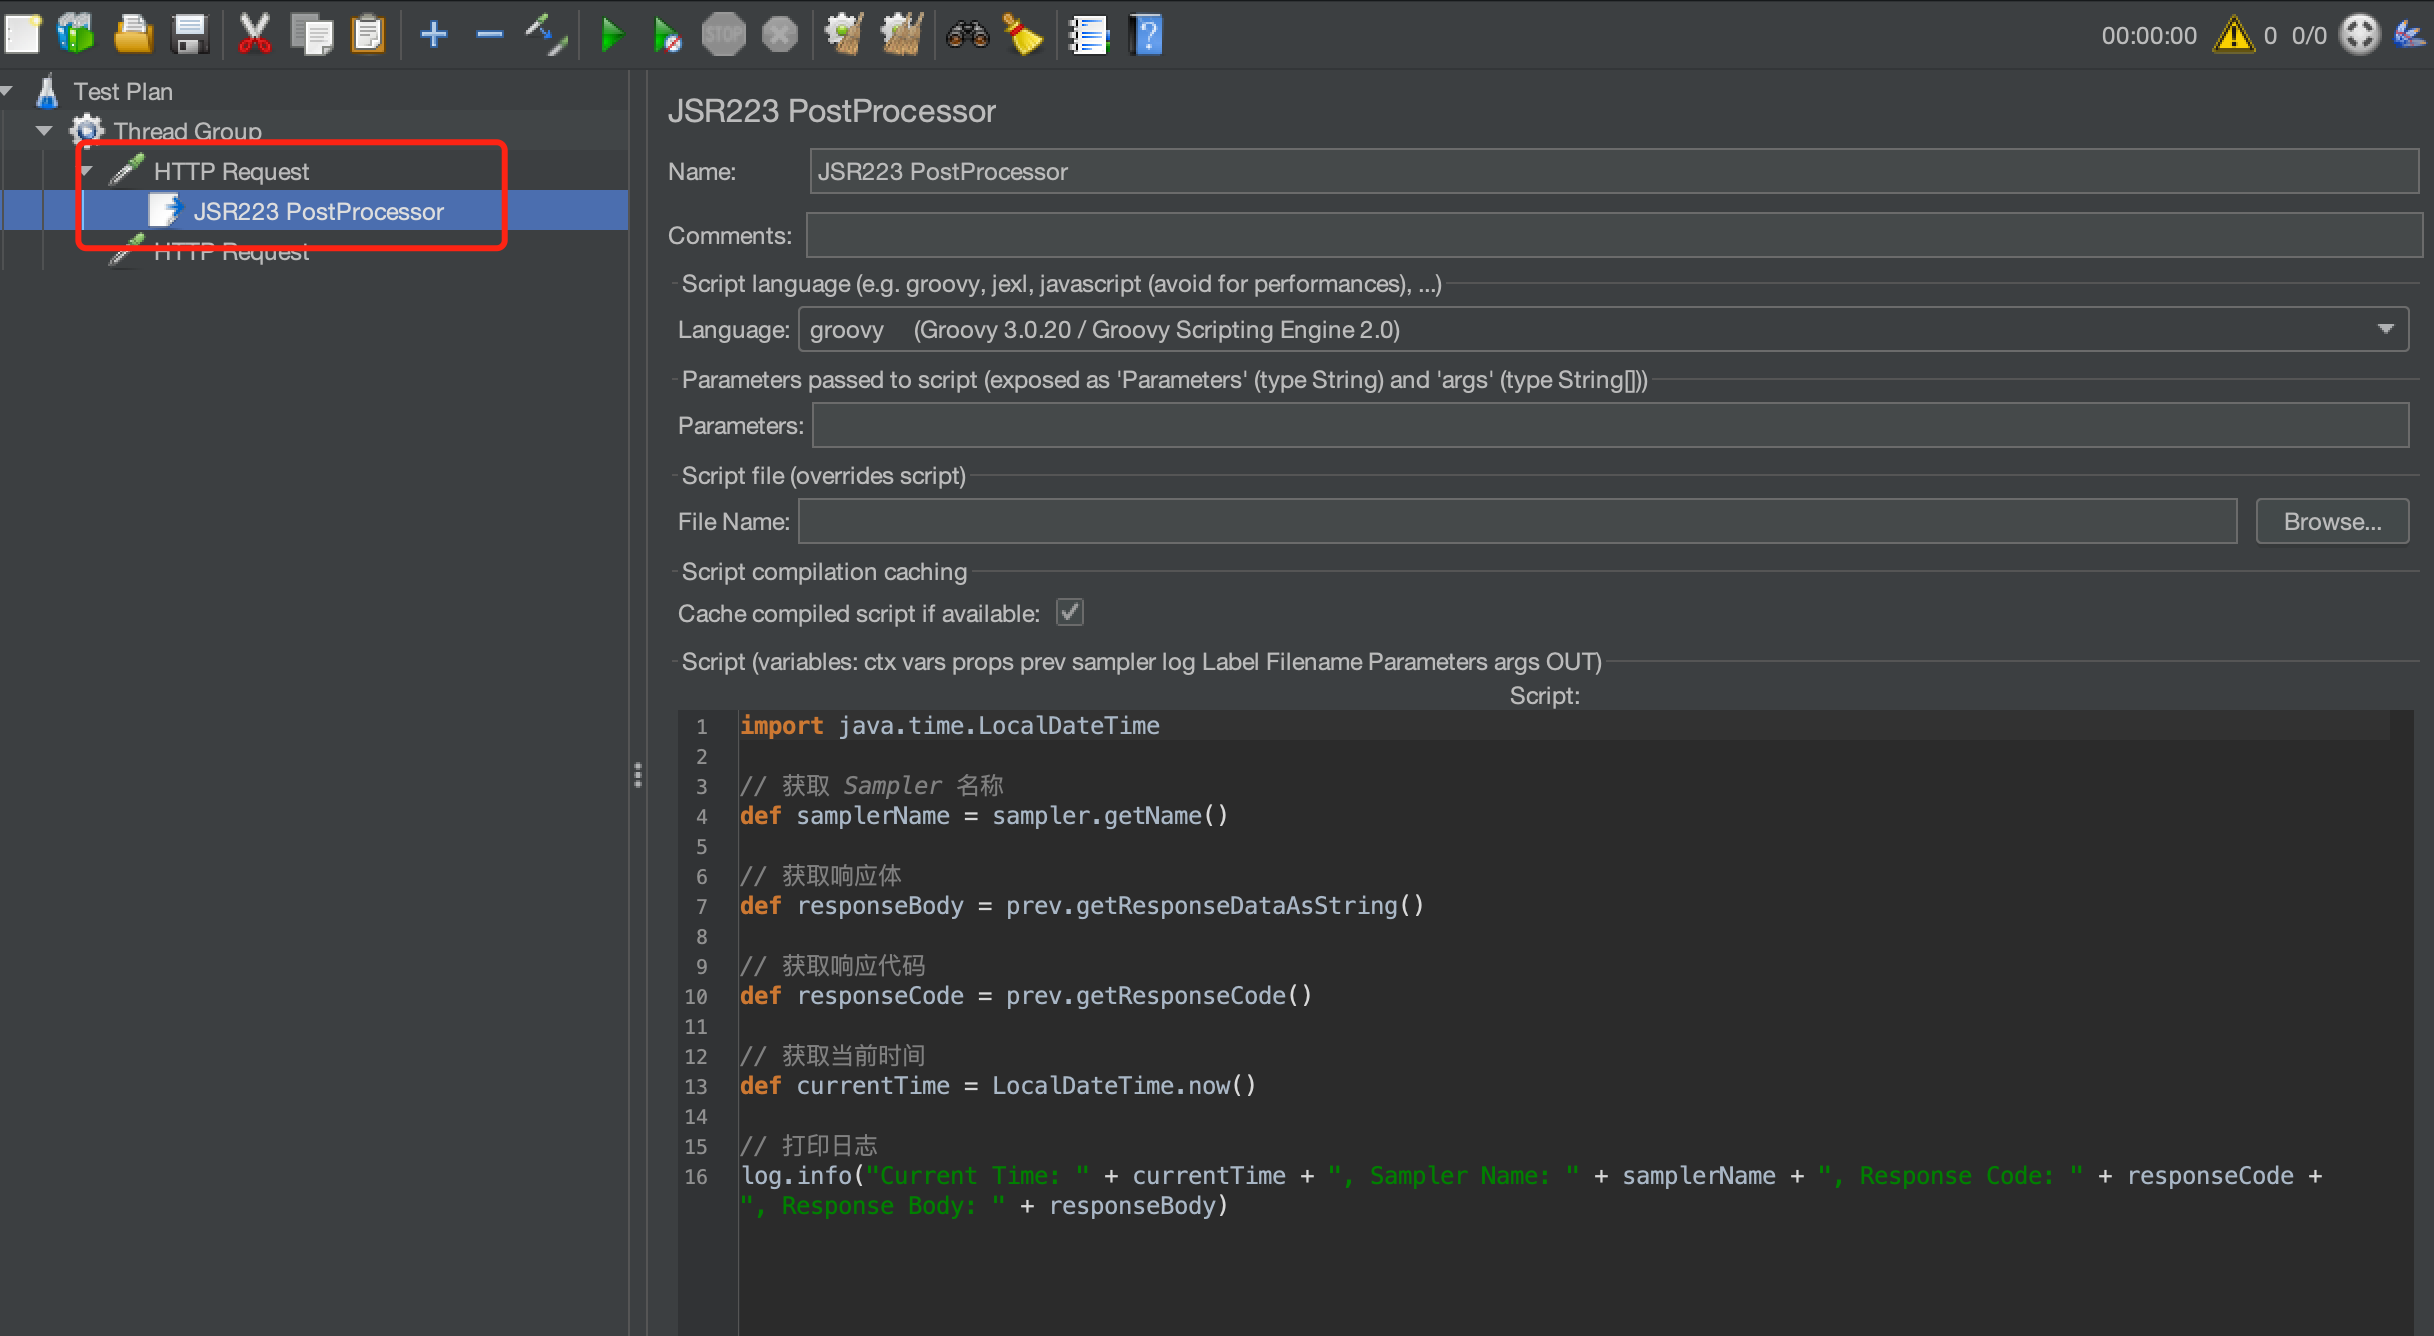
If there are multiple requests in the script but you only need to print details of a single request without printing all of them, you can put the Post Processor into the corresponding request, as shown in the figure below.
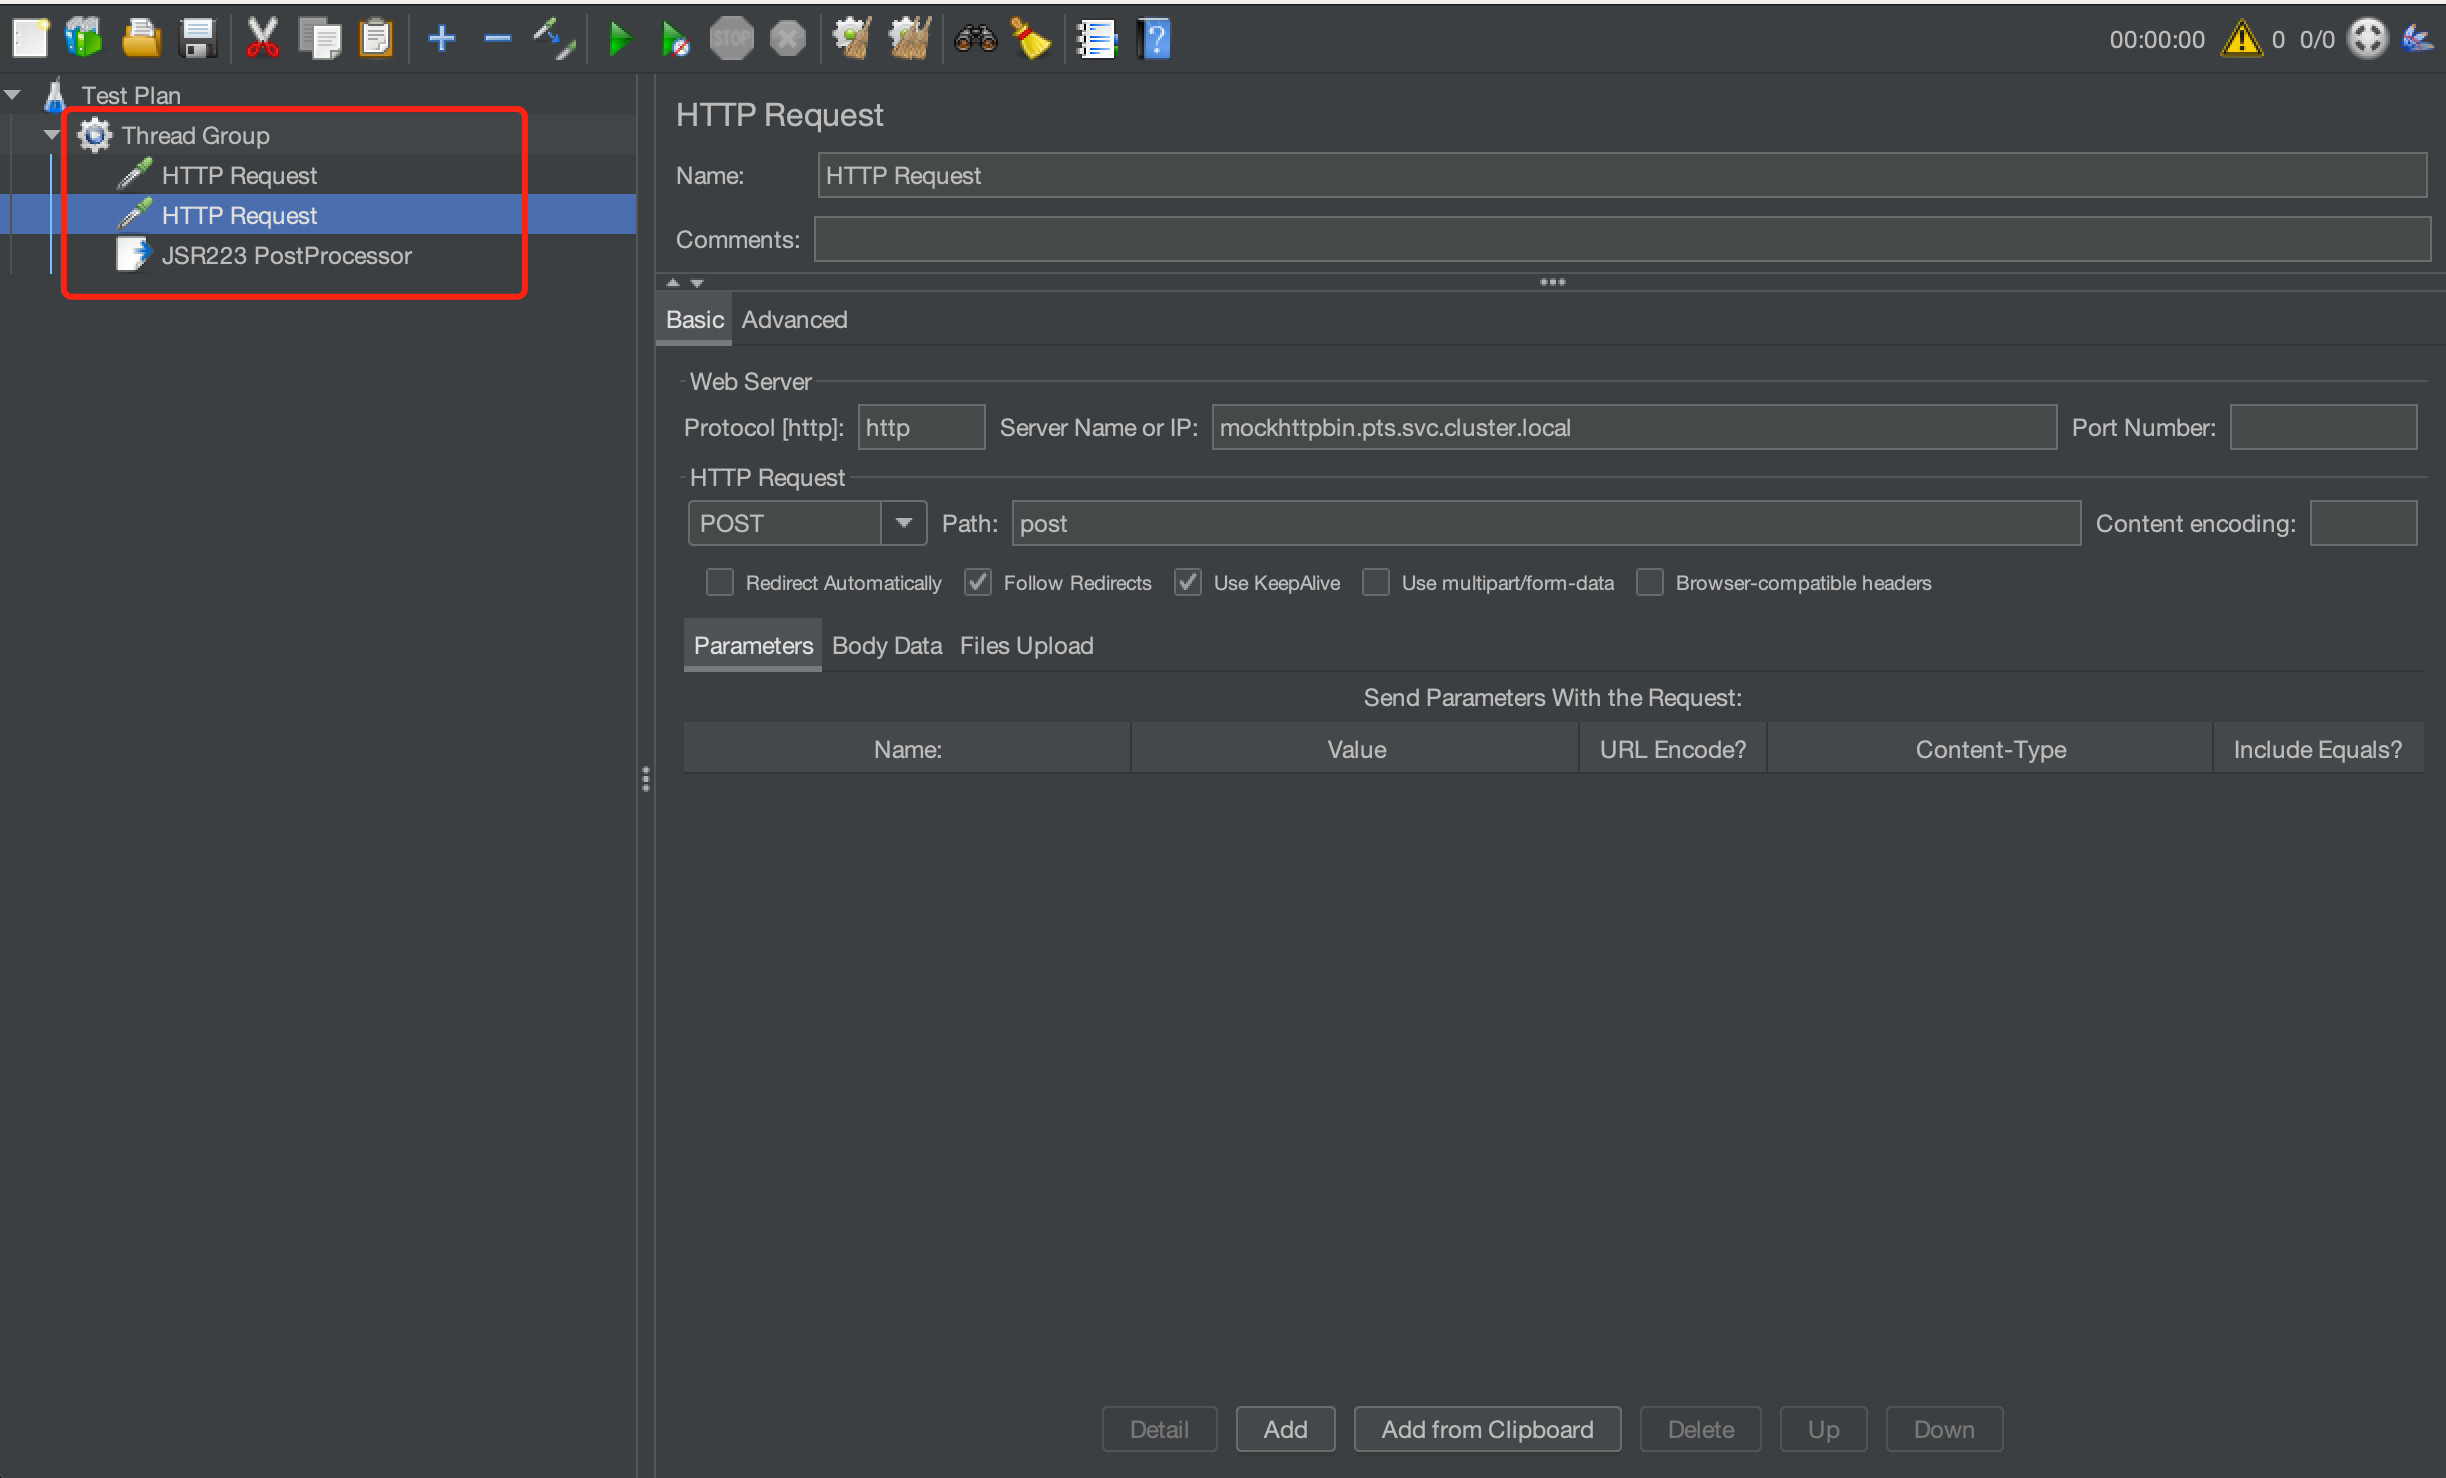
If you need to print all request details, you can put the Post Processor in a parallel position with the request, as shown in the figure below.
Checkpoint Logs
According to the execution order in JMeter, the results for checkpoints cannot be obtained by using the Post Processor because in that execution stage, the assertion check has not been executed. The assertion check results can be known only in the stage where the Listener is used. Therefore, you can use the JSR223 Listener to print the checkpoint details to the engine logs for viewing through a script. The following is a sample of the Groovy script. You can see JMeter Official Documentation for AssertionResult returned by the getAssertionResults() method.
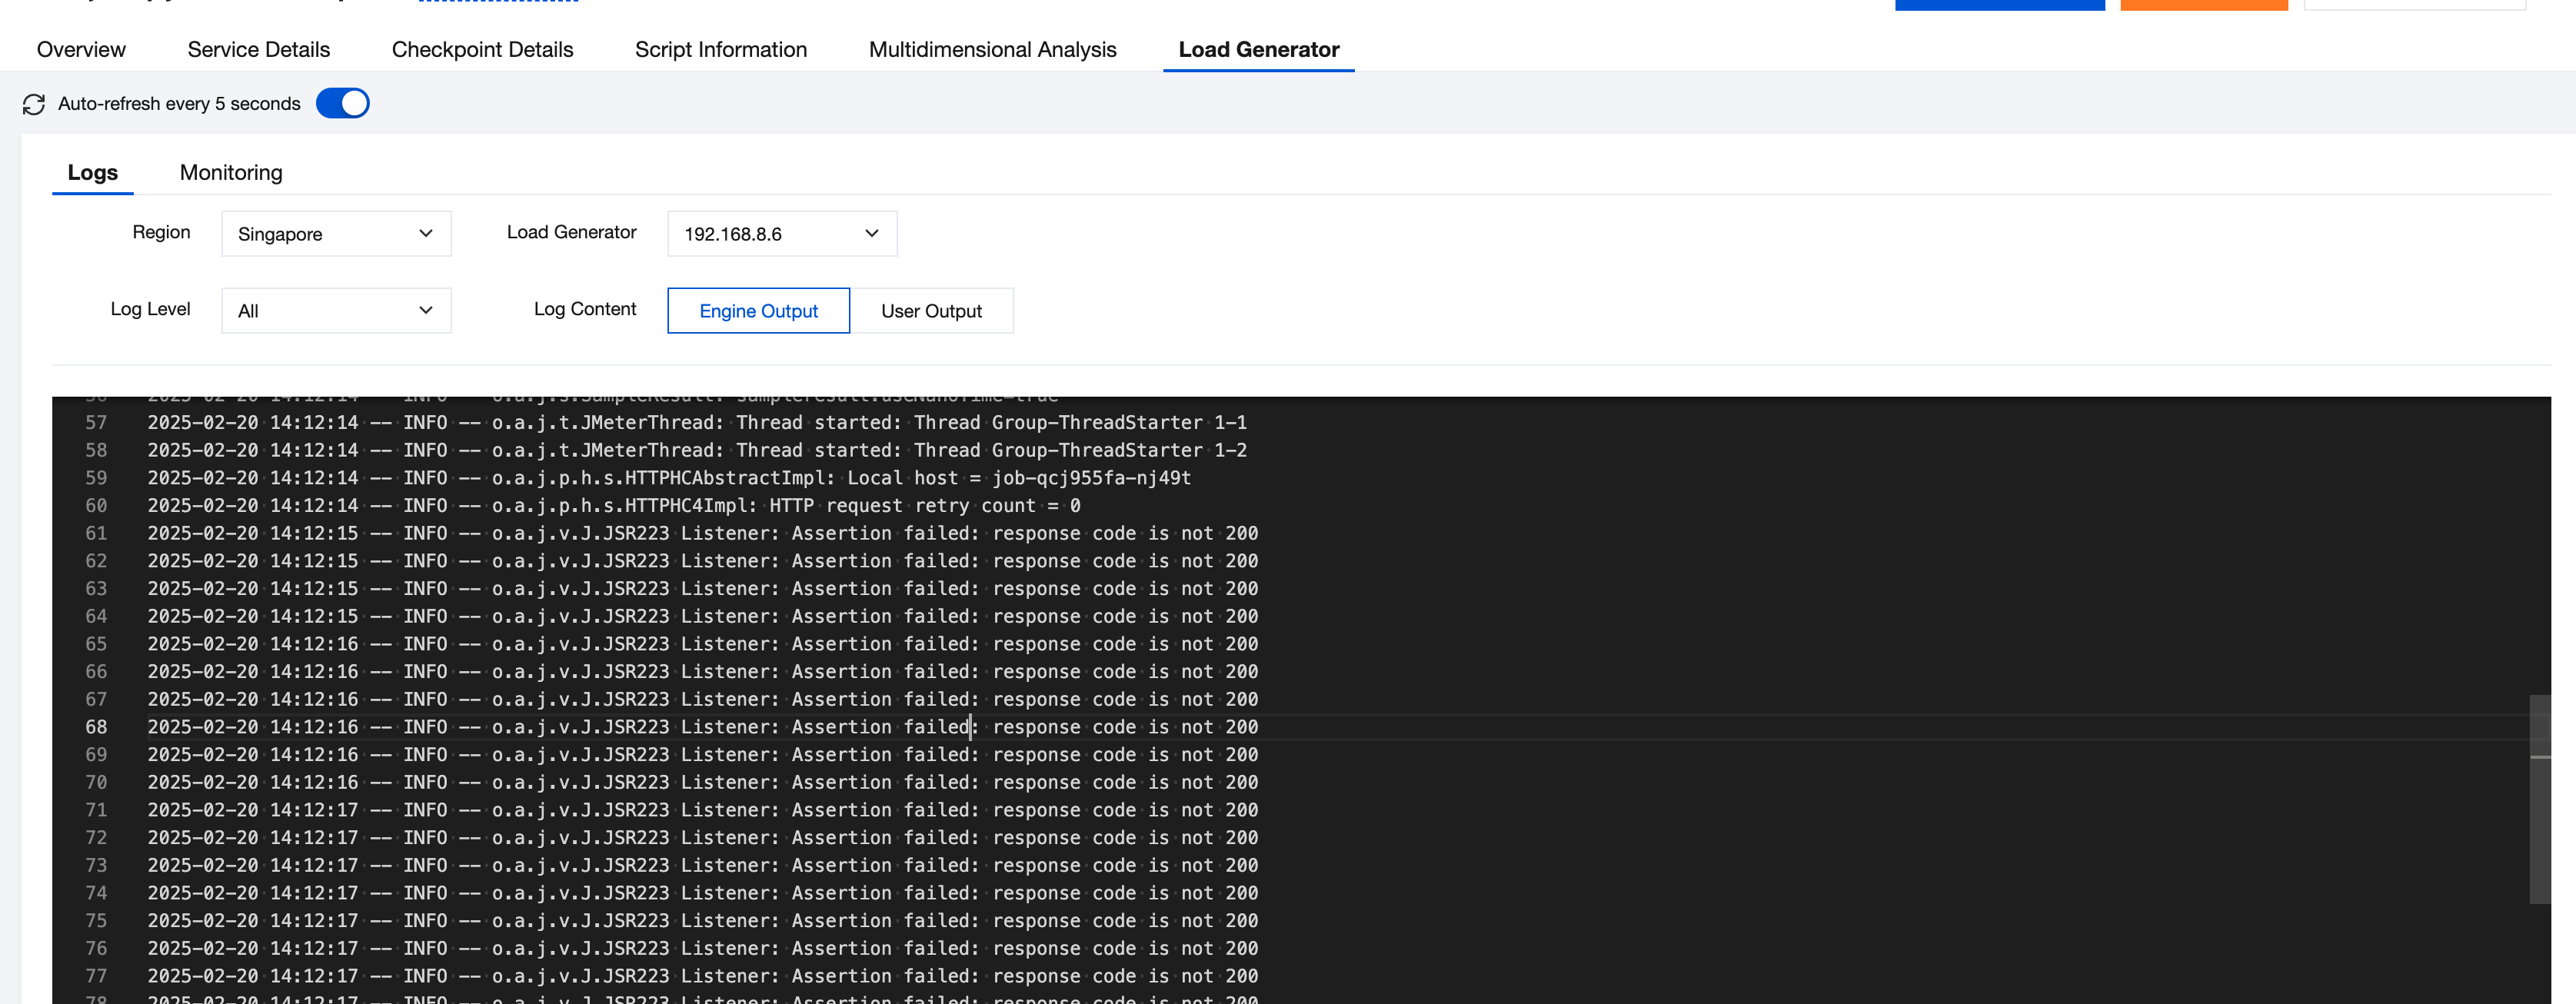
Execute the JMX script on PTS. In Engine Output on the Load Generator tab page in the console, you can view the printed logs.
Here, only the assertion check results and failure messages are printed. If necessary, you can also print the details of the failed assertion check requests according to the previous request logs.
If there are multiple assertion checks in the JMX script, and you need to print a single or all of them, you can put the Listener in different positions accordingly by referring to the previous method of printing logs with multiple requests.