TMP has adjusted the free storage period for free metrics to 15 days on October 27, 2022. For instances with a storage period of more than 15 days, storage fees for their free metrics will be charged based on the excessive storage period. For more information on the billing rules, see Billing Rules for Free Metrics Exceeding Free Storage Period.
This document describes how to streamline the TMP collection metrics to avoid unnecessary expenses.
Prerequisites
Before configuring monitoring collection items, you need to perform the following operations:
1. Log in to the TKE console and click TMP in the left sidebar.
2. On the instance list page, select an instance name that needs to configure data collection rules to go to its details page.
3. On the Cluster monitoring page, click Data collection on the right of the cluster to enter the collection configuration list page.
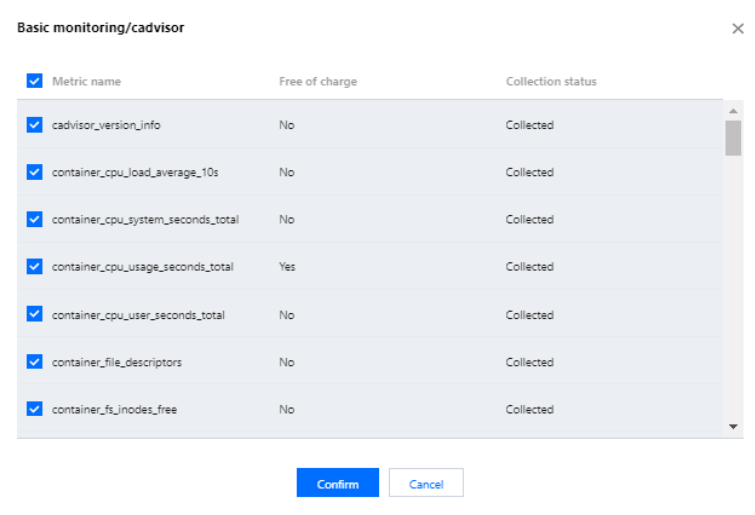
4. You can add or remove the basic metrics to be collected by selecting/unselecting the metrics. Click Metric details on the right.
5. The following shows whether the metrics are free. If you select a metric, it will be collected. We recommend you deselect paid metrics to avoid additional costs. Only metrics for basic monitoring are free of charge. For more information on free metrics, see Free Metrics in Pay-as-You-Go Mode. For more information on paid metrics, see Pay-as-You-Go.
Streamlining metrics through YAML
Currently, TMP is billed by the number of monitoring data points. We recommend you optimize your collection configuration to collect only required metrics and filter out unnecessary ones. This will save costs and reduce the overall reported data volume. For more information on the billing mode and cloud resource usage, see here.
The following describes how to add filtering configurations to ServiceMonitors, PodMonitors, and RawJobs to streamline custom metrics.
1. Log in to the TKE console and click TMP in the left sidebar.
2. On the instance list page, select an instance name that needs to configure data collection rules to go to its details page.
3. On the Cluster monitoring page, click Data collection on the right of the cluster to enter the collection configuration list page.
4. Click Edit on the right of the instance to view the metric details.
ServiceMonitor and PodMonitor
RawJob
A ServiceMonitor and a PodMonitor use the same filtering fields, and this document uses a ServiceMonitor as an example.
Sample for ServiceMonitor:
apiVersion: monitoring.coreos.com/v1
kind: ServiceMonitor
metadata:
labels:
app.kubernetes.io/name: kube-state-metrics
app.kubernetes.io/version: 1.9.7
name: kube-state-metrics
namespace: kube-system
spec:
endpoints:
-bearerTokenSecret:
key:""
interval: 15s # It indicates the collection frequency. You can increase it to reduce the data storage costs. For example, set it to `300s` for less important metrics, which can reduce the amount of monitoring data collected by 20 times.
port: http-metrics
scrapeTimeout: 15s # It indicates the collection timeout period. TMP configuration requires that this value does not exceed the collection interval, i.e., `scrapeTimeout` <= `interval`.
jobLabel: app.kubernetes.io/name
namespaceSelector:{}
selector:
matchLabels:
app.kubernetes.io/name: kube-state-metrics
To collect kube_node_info and kube_node_role metrics, you need to add the metricRelabelings field to the endpoint list of the ServiceMonitor. Note that it is metricRelabelings but not relabelings.
Sample for adding metricRelabelings:
apiVersion: monitoring.coreos.com/v1
kind: ServiceMonitor
metadata:
labels:
app.kubernetes.io/name: kube-state-metrics
app.kubernetes.io/version: 1.9.7
name: kube-state-metrics
namespace: kube-system
spec:
endpoints:
-bearerTokenSecret:
key:""
interval: 15s # It indicates the collection frequency. You can increase it to reduce the data storage costs. For example, set it to `300s` for less important metrics, which can reduce the amount of monitoring data collected by 20 times.
port: http-metrics
scrapeTimeout: 15s
# The following four lines are added:
metricRelabelings:# Each collected item is subject to the following processing.
-sourceLabels:["__name__"]# The name of the label to be detected. `__name__` indicates the name of the metric or any label that comes with the item.
regex: kube_node_info|kube_node_role # Whether the above label satisfies this regex. Here, `__name__` should satisfy the requirements of `kube_node_info` or `kube_node_role`.
action: keep # Keep the item if it meets the above conditions, or drop it otherwise.
jobLabel: app.kubernetes.io/name
namespaceSelector:{}
selector:
If Prometheus' RawJob is used, see the following method for metric filtering.
Sample job:
scrape_configs:
-job_name: job1
scrape_interval: 15s # It indicates the collection frequency. You can increase it to reduce the data storage costs. For example, set it to `300s` for less important metrics, which can reduce the amount of monitoring data collected by 20 times.
static_configs:
-targets:
-'1.1.1.1'
If you only need to collect kube_node_info and kube_node_role metrics, add the metric_relabel_configs field. Note that it is metric_relabel_configs but not relabel_configs.
Sample for adding metric_relabel_configs:
scrape_configs:
-job_name: job1
scrape_interval: 15s # It indicates the collection frequency. You can increase it to reduce the data storage costs. For example, set it to `300s` for less important metrics, which can reduce the amount of monitoring data collected by 20 times.
static_configs:
-targets:
-'1.1.1.1'
# The following four lines are added:
metric_relabel_configs:# Each collected item is subject to the following processing.
-source_labels:["__name__"]# The name of the label to be detected. `__name__` indicates the name of the metric or any label that comes with the item.
regex: kube_node_info|kube_node_role # Whether the above label satisfies this regex. Here, `__name__` should satisfy the requirements of `kube_node_info` or `kube_node_role`.
action: keep # Keep the item if it meets the above conditions, or drop it otherwise.
5. Click OK.
Blocking collection targets
Blocking the monitoring of the entire namespace
TMP will monitor all the ServiceMonitors and PodMonitors in a cluster by default after the cluster is associated. If you want to block the monitoring of a namespace, you can add the label of tps-skip-monitor: "true" as instructed in Labels and Selectors.
Blocking certain targets
TMP collects monitoring data by creating CRD resources of ServiceMonitor and PodMonitor types in your cluster. If you want to block the collection of the specified ServiceMonitor and PodMonitor resources, you can add the label of tps-skip-monitor: "true" to these CRD resources as instructed in Labels and Selectors.