tencent cloud

Tencent Kubernetes Engine

Release Notes and Announcements
Release Notes
Announcements
Release Notes
Product Introduction
Overview
Strengths
Architecture
Scenarios
Features
Concepts
Native Kubernetes Terms
Common High-Risk Operations
Regions and Availability Zones
Service Regions and Service Providers
Open Source Components
Purchase Guide
Purchase Instructions
Purchase a TKE General Cluster
Purchasing Native Nodes
Purchasing a Super Node
Getting Started
Beginner’s Guide
Quickly Creating a Standard Cluster
Examples
Container Application Deployment Check List
Cluster Configuration
General Cluster Overview
Cluster Management
Network Management
Storage Management
Node Management
GPU Resource Management
Remote Terminals
Application Configuration
Workload Management
Service and Configuration Management
Component and Application Management
Auto Scaling
Container Login Methods
Observability Configuration
Ops Observability
Cost Insights and Optimization
Scheduler Configuration
Scheduling Component Overview
Resource Utilization Optimization Scheduling
Business Priority Assurance Scheduling
QoS Awareness Scheduling
Security and Stability
TKE Security Group Settings
Identity Authentication and Authorization
Application Security
Multi-cluster Management
Planned Upgrade
Backup Center
Cloud Native Service Guide
Cloud Service for etcd
TMP
TKE Serverless Cluster Guide
TKE Registered Cluster Guide
Use Cases
Cluster
Serverless Cluster
Scheduling
Security
Service Deployment
Network
Release
Logs
Monitoring
OPS
Terraform
DevOps
Auto Scaling
Containerization
Microservice
Cost Management
Hybrid Cloud
AI
Troubleshooting
Disk Full
High Workload
Memory Fragmentation
Cluster DNS Troubleshooting
Cluster kube-proxy Troubleshooting
Cluster API Server Inaccessibility Troubleshooting
Service and Ingress Inaccessibility Troubleshooting
Common Service & Ingress Errors and Solutions
Engel Ingres appears in Connechtin Reverside
CLB Ingress Creation Error
Troubleshooting for Pod Network Inaccessibility
Pod Status Exception and Handling
Authorizing Tencent Cloud OPS Team for Troubleshooting
CLB Loopback
API Documentation
History
Introduction
API Category
Making API Requests
Elastic Cluster APIs
Resource Reserved Coupon APIs
Cluster APIs
Third-party Node APIs
Relevant APIs for Addon
Network APIs
Node APIs
Node Pool APIs
TKE Edge Cluster APIs
Cloud Native Monitoring APIs
Scaling group APIs
Super Node APIs
Other APIs
Data Types
Error Codes
TKE API 2022-05-01
FAQs
TKE General Cluster
TKE Serverless Cluster
About OPS
Hidden Danger Handling
About Services
Image Repositories
About Remote Terminals
Event FAQs
Resource Management
Service Agreement
TKE Service Level Agreement
TKE Serverless Service Level Agreement
Contact Us
Glossary

Audit Dashboard

PDF
Mode fokus
Ukuran font
Terakhir diperbarui: 2024-12-17 17:41:52

Overview

TKE Serverless cluster provides out-of-the-box audit dashboards and can automatically configure dashboards of audit overview, K8s object operation overview, and aggregated search for the clusters with cluster auditing enabled. With user-defined filters and built-in CLS global search, TKE Serverless cluster makes it convenient for you to observe and search for cluster operations, so as to promptly find and locate problems.

Feature Description

Four dashboards are configured in Auditing Search, namely Audit Overview, K8s Object Operation Overview, Aggregated Search, and Global Search. Follow the steps below to enter the Auditing Search page to use the features:
1. Log in to the TKE console.
2. Enable cluster auditing. For more information, see Cluster Auditing.
3. On the left sidebar, click Cluster Ops > Auditing Search.
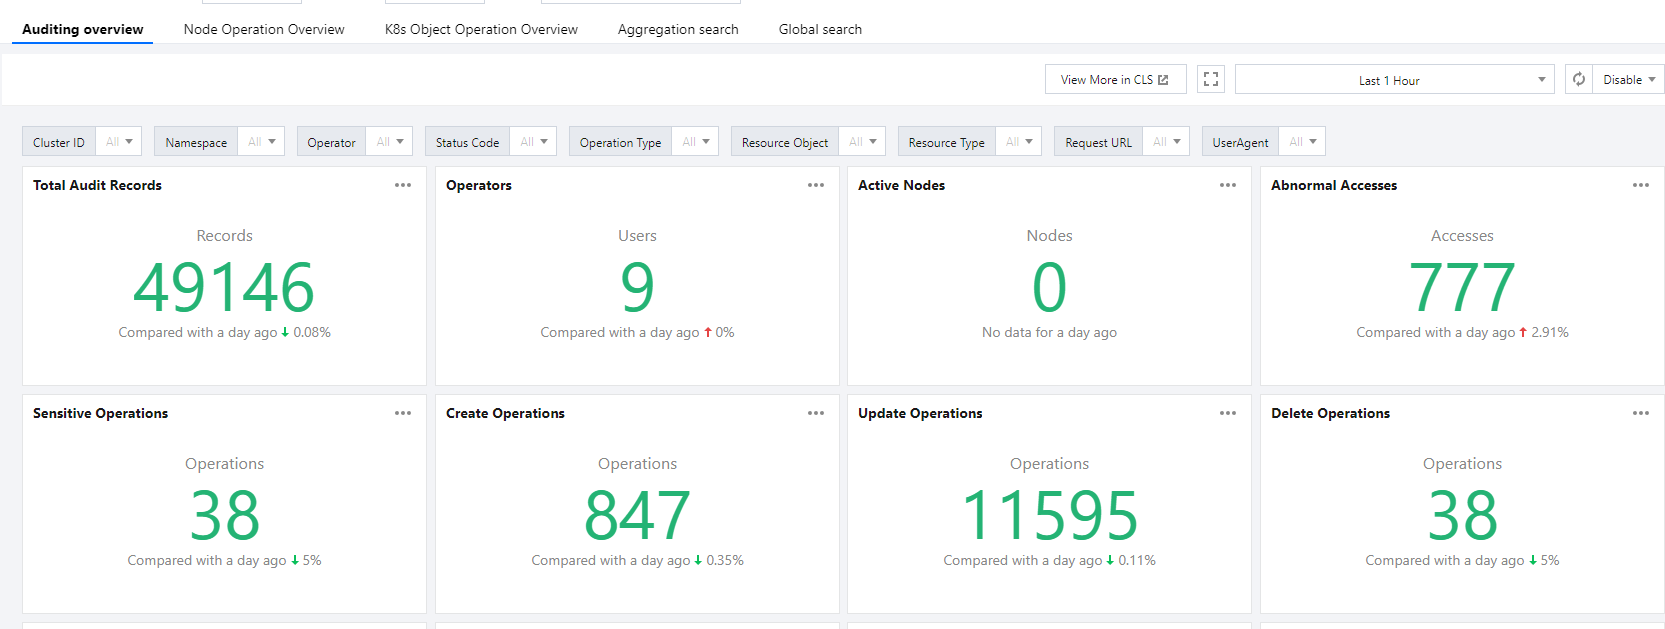
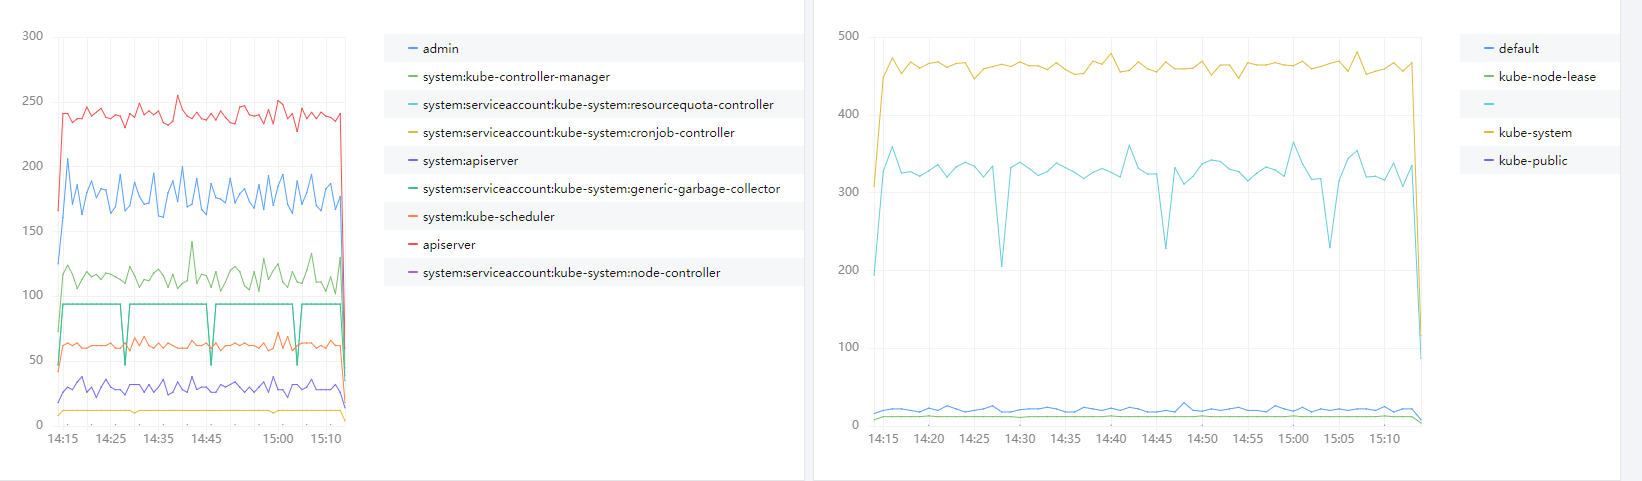
Audit overview

If you want to observe the operations of the API server in the entire cluster, you can set filters on the Audit Overview page to view the aggregated statistics of the core audit logs and display the data comparison within a period, for example, core audit log statistics, distribution, important operation trends. You can customize up to filters as needed.

You can view more statistics on this page as shown below:
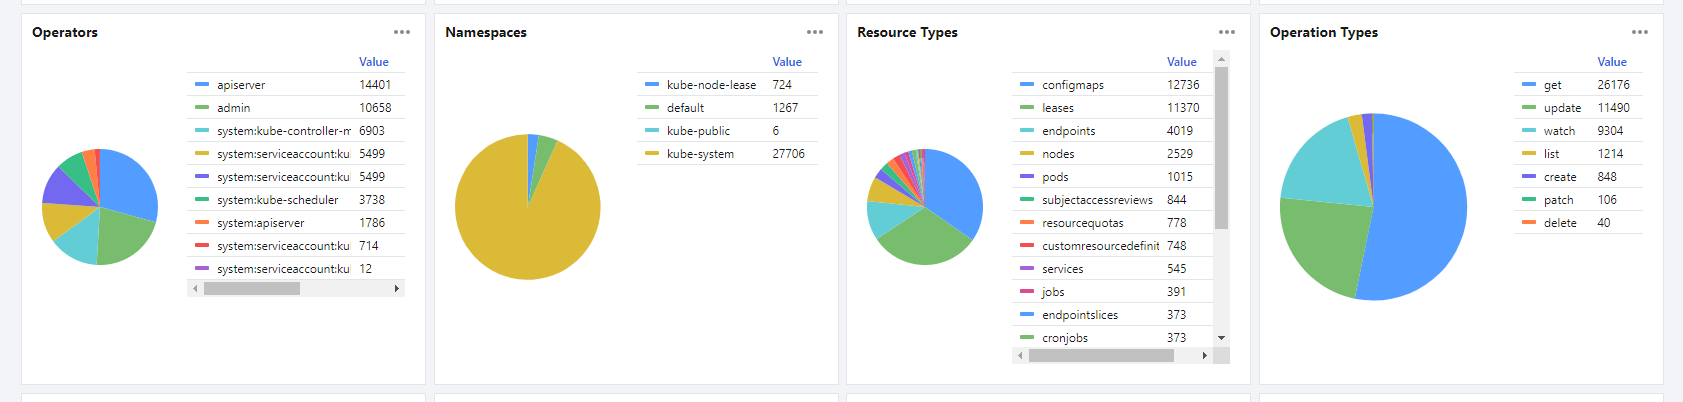
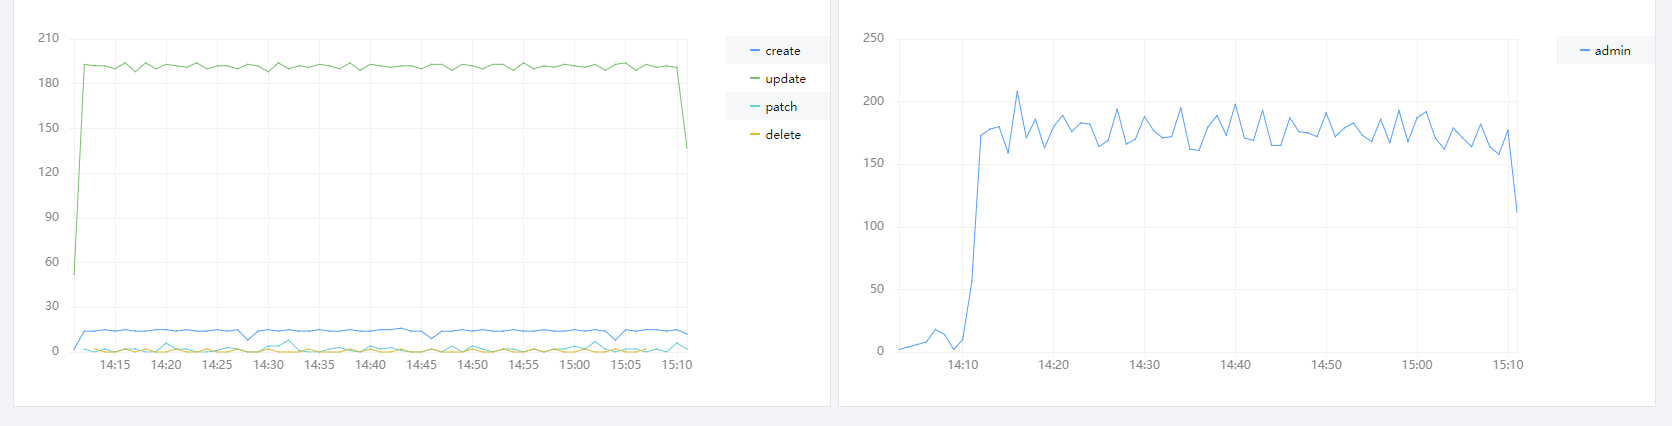
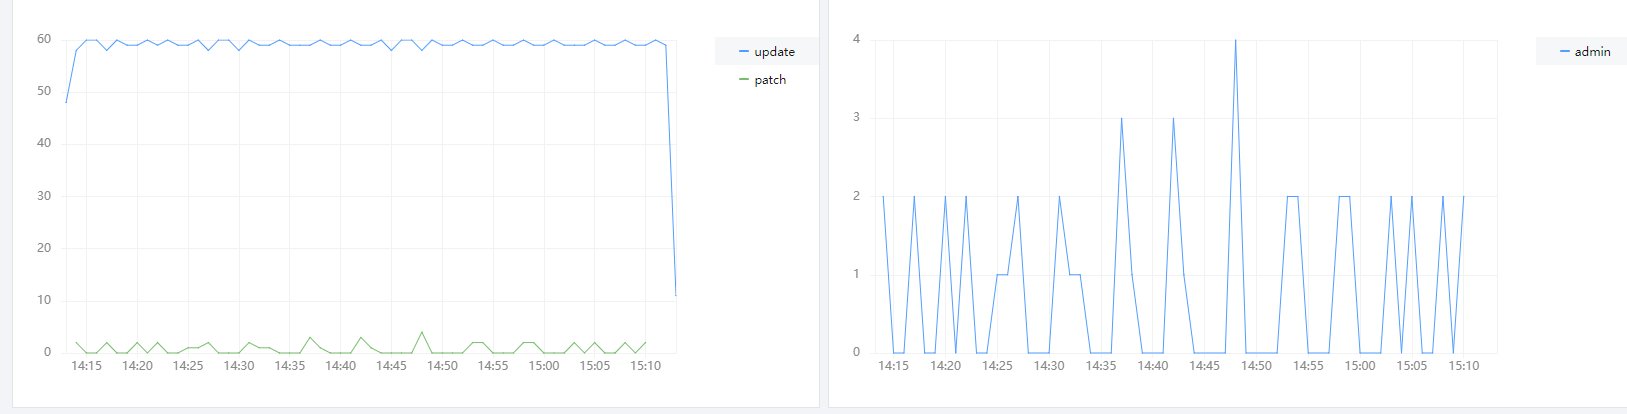
Core audit log statistics dashboard:

Distribution dashboard:

Important operation trend dashboard:


K8s object operation overview

When you need to troubleshoot issues with K8s objects (such as a certain workload), you can switch to the K8s Object Operation Overview tab, where you can set filters to view the operation overview, operators, and audit log lists of various types of K8s objects .

If you want to observe the distribution trend of audit logs in a certain dimension, you can set filters on the Aggregated Search tab to view the sequence diagrams of important operations, including user, namespace, operation type, status code, resource type, and audit log list.
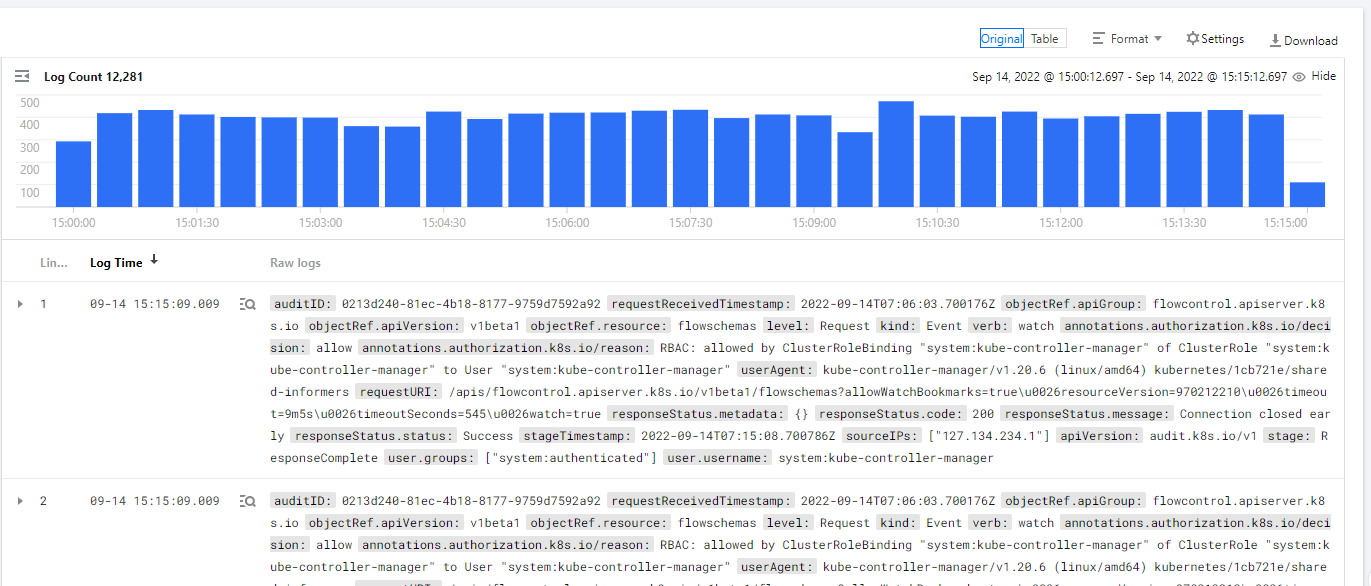
The global search dashboard with built-in CLS search and analysis makes it convenient for you to quickly search all audit logs in the TKE console .


Configuring alarm by dashboard

You can configure alarms based on the preset dashboards as instructed below, so that alarms will be triggered when the configured conditions are reached:
1. Click

on the right of the target dashboard and select Quickly Add Alarm from the drop-down list .
2. For more information on how to configure alarm policies, see Configuring Alarm Policies.

Bantuan dan Dukungan

Apakah halaman ini membantu?

masukan