From now to December 31, 2021, users are exempt from CLS service fees incurred by audit log/event data generated by TKE Serverless for auto-created logsets or auto-created log topics in existing logsets.
Overview
Cluster audit is a feature based on Kubernetes Auditing that can store and search the records of JSON logs with configurable policies generated by kube-apiserver. This feature records the access events of kube-apiserver and records the activities of each user, admin, or system component that has an impact on the cluster in sequence.
Advantages
The cluster audit feature provides another cluster monitoring dimension different from metrics. After cluster audit is enabled, Kubernetes can record every audit log that operates on the cluster. An audit log is a structured record in JSON format, and includes three parts: metadata, requestObject, and responseObject. The metadata (containing the request context information, such as who initiated the request, where it was initiated, and the accessed URI) is a required part. requestObject and responseObject are optional, depending on the audit level. You can learn the following information from logs:
Activities that occur in the cluster.
Activity occurrence time and objects.
Activity triggering time, triggering positions, and observation points.
Unlike common logs, the level of Kubernetes audit logs is more like a kind of verbose configuration, which is used to indicate the degree of detail of the recorded information. There are four audit levels, as listed in the following table:
Parameter
Description
None
Nothing is recorded.
Metadata
The metadata of the request (for example, user, time, resources, and operation) is recorded, excluding the request message body and response message body.
Request
The metadata and request message body are recorded, excluding the response message body.
RequestResponse
All the information is recorded, including the metadata, request message body, and response message body.
Audit stage (stage)
Logs can be recorded at different stages, as listed in the following table:
Parameter
Description
RequestReceived
The log is recorded immediately after a request is received.
ResponseStarted
The log is recorded after the message header of the response is sent. This parameter only applies to persistent connection requests, such as WATCH.
ResponseComplete
The log is recorded after the entire response is sent.
Panic
An error occurs to the internal server and the request fails.
Audit policy
By default, TKE serverless clusters record audit logs when receiving requests. For most operations, audit logs at the RequestResponse level are recorded. The following list shows the exceptions:
For GET, LIST, and WATCH requests, logs at the Request level are recorded.
For requests of Secret, ConfigMap, or TokenReview resources, logs at the Metadata level are recorded.
Logs will not be recorded for the following requests:
Requests sent by system:kube-proxy for monitoring endpoint, service, or service/status resources.
GET requests sent by system:unsecured for ConfigMap resources in the kube-system namespace.
GET requests sent by kubelet for node or node/status resources.
GET and UPDATE requests sent by system:kube-controller-manager, system:kube-scheduler, or system:serviceaccount:endpoint-controller for endpoint resources in the kube-system namespace.
GET requests sent by system:apiserver for namespace, namespace/status, or namespace/finalize resources.
Requests sent to URLs that match /healthz*, /version, or /swagger*.
Directions
Enabling cluster audit
Note
To enable the cluster audit feature, you need to restart kube-apiserver. We recommend that you do not frequently enable and disable the feature.
2. In the left sidebar, choose Operation Management > Feature Management.
3. On the Feature Management page, select a region and the Serverless cluster type.
4. Locate the cluster for which you want to enable the cluster audit feature in the following cluster list. Click Set in the Operation column on the right.
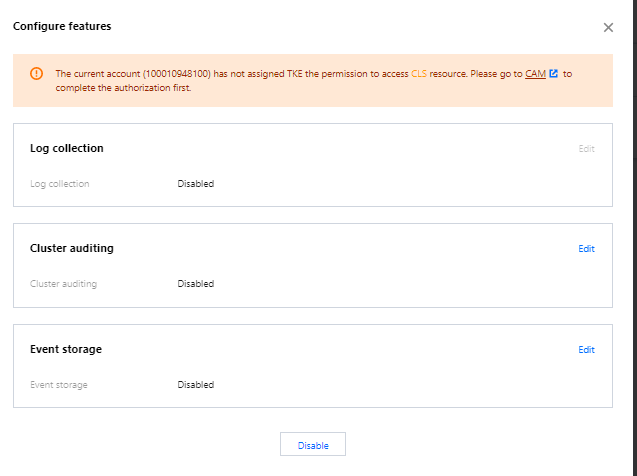
5. In the Configure features pop-up window, click Edit for the Cluster Auditing feature, as shown below:
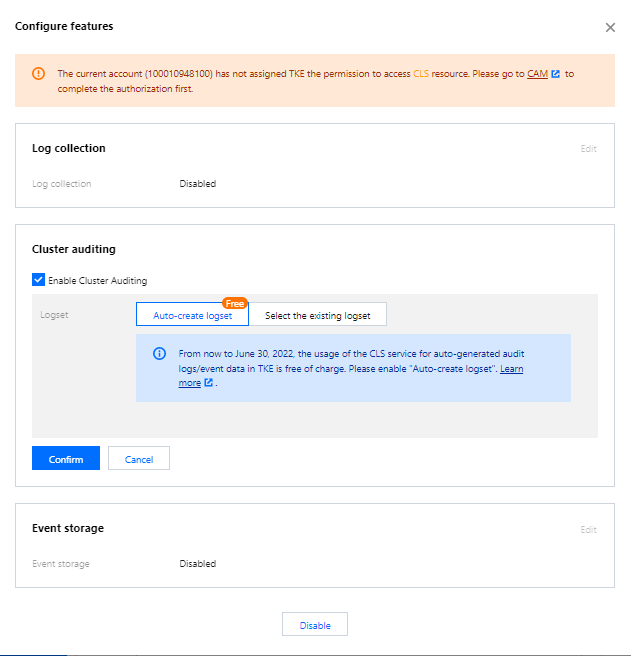
6. Check Enable Cluster Auditing. Select the logset and log topic for storing audit logs. We recommend that you select Auto-create Logset, as shown below:
7. Click Confirm to enable the cluster audit feature.