Observability Integration
Download
Mode fokus
Ukuran font
Overview
This document introduces how to configure Nginx Ingress to integrate monitoring and logging systems to enhance observability, including integration with Tencent Cloud hosted products like Prometheus, Grafana, and CLS, as well as with self-built Prometheus and Grafana.
Integrating with Prometheus Monitoring
If you use TKE Cluster Associated with Tencent Cloud Prometheus Monitoring Service, or if you have installed Prometheus Operator to monitor the cluster, you can enable ServiceMonitor to collect monitoring data for Nginx Ingress.
values.yaml configuration method:controller:metrics:enabled: true # Specifically create a service for Prometheus for Nginx Ingress service discoveryserviceMonitor:enabled: true # Enable monitoring and collection rules when ServiceMonitor custom resources are distributed
Integrating with Grafana Monitoring Dashboards
If you are using TKE Cluster Associated with Tencent Cloud Prometheus Monitoring Service and have also linked Tencent Cloud Grafana Service, or If you have your own Grafana, simply import the two monitoring dashboards (json files) provided by the official Nginx Ingress Grafana Dashboards into Grafana.
Integrating with CLS
The following content introduces how to collect the access log of Nginx Ingress Controller to CLS and analyze logs using the CLS dashboard.
1. Configure the format of the Nginx access logs in
values.yaml and set the timezone to display the local time for better readability:controller:config:log-format-upstream:$remote_addr - $remote_user [$time_local] "$request"$status $body_bytes_sent "$http_referer" "$http_user_agent"$request_length $request_time [$proxy_upstream_name] [$proxy_alternative_upstream_name] $upstream_addr$upstream_response_length $upstream_response_time $upstream_status $req_id $hostextraEnvs:- name: TZvalue: Asia/Shanghai
2. Ensure that the log collection feature is enabled for the cluster.
3. Prepare CLS log sets and log topics for Nginx Ingress Controller. If you do not have them, go to the CLS Console, create them as needed, and record the log topic ID.
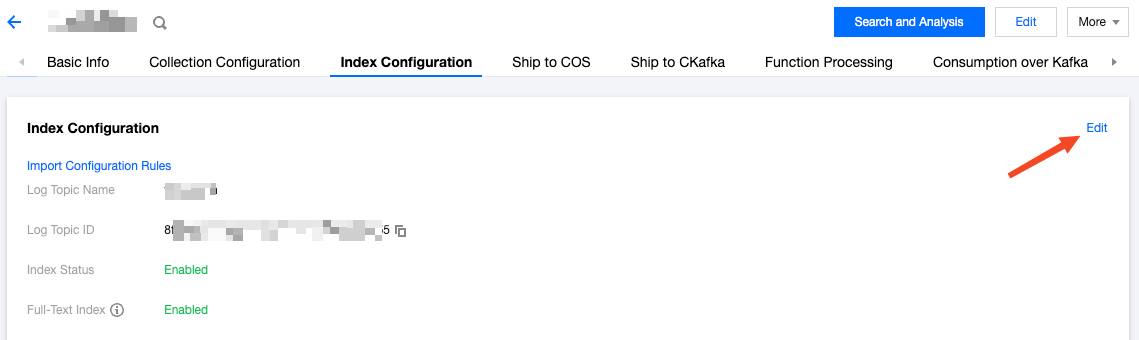
4. Enable indexing for the log topic:
Go to the Index Configuration page of Log Topic, and click Edit:
Enable indexing. The full-text segmentation symbol is
@&?|#()='",;:<>[]{}/ \\n\\t\\r\\\\ :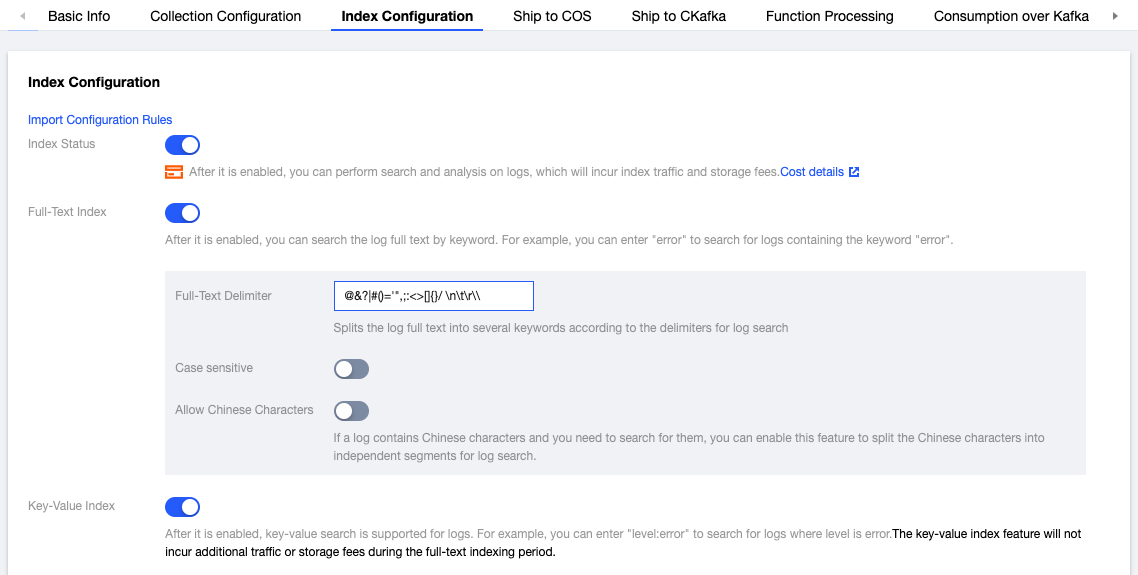
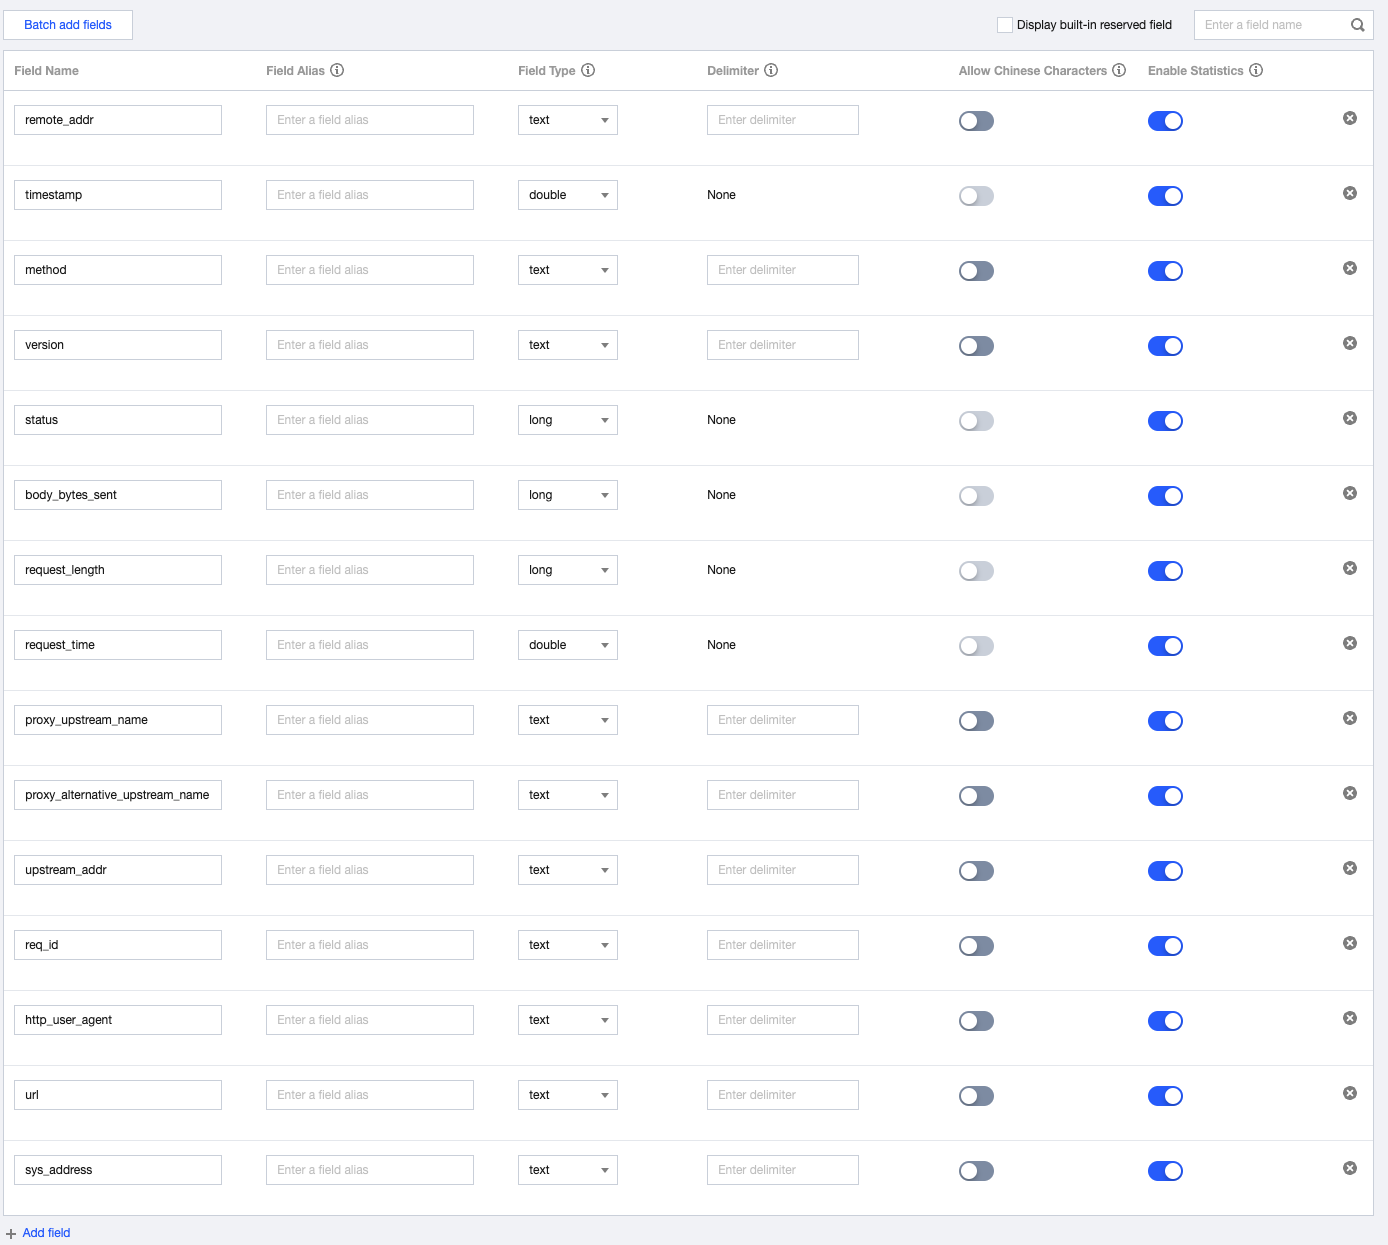
Bulk add index fields (match the configuration shown below):
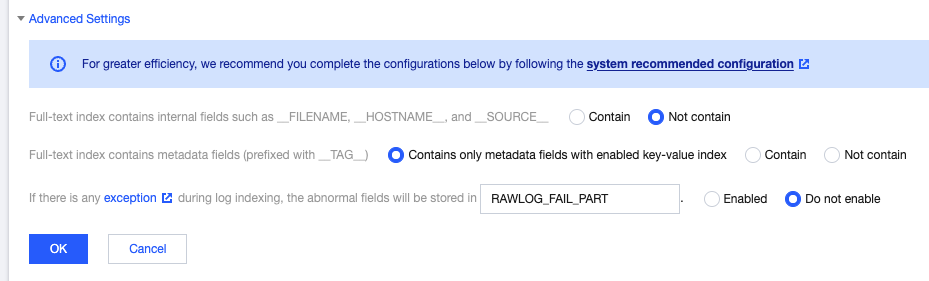
Perform advanced settings:
5. Create TKE log collection rules (choose one based on actual situation):
Note:
The configuration item that must be replaced is
topicId, which is the log topic ID, indicating that the collected logs will be sent to the corresponding CLS log topic.Depending on your situation, choose whether to collect standard output or log files. By default, Nginx Ingress outputs logs to standard output. You can also choose to save logs to log files. For details, refer to [Log Rotation].
Collect standard output:
apiVersion: cls.cloud.tencent.com/v1kind: LogConfigmetadata:name: ingress-nginx-controller # Name of the log collection rule. If there are multiple Nginx Ingress instances, ensure they do not conflict here.spec:clsDetail:topicId: "********-****-****-****-************" # Log topic ID to be replaced.logType: fullregex_logextractRule:beginningRegex: (\\S+)\\s-\\s(\\S+)\\s\\[([^\\]]+)\\]\\s\\"(\\w+)\\s(\\S+)\\s([^\\"]+)\\"\\s(\\S+)\\s(\\S+)\\s\\"([^\\"]*)\\"\\s\\"([^\\"]*)\\"\\s(\\S+)\\s(\\S+)\\s\\[([^\\]]*)\\]\\s\\[([^\\]]*)\\]\\s(\\S+)\\s(\\S+)\\s(\\S+)\\s(\\S+)\\s(\\S+)\\s(\\S+)logRegex: (\\S+)\\s-\\s(\\S+)\\s\\[([^\\]]+)\\]\\s\\"(\\w+)\\s(\\S+)\\s([^\\"]+)\\"\\s(\\S+)\\s(\\S+)\\s\\"([^\\"]*)\\"\\s\\"([^\\"]*)\\"\\s(\\S+)\\s(\\S+)\\s\\[([^\\]]*)\\]\\s\\[([^\\]]*)\\]\\s(\\S+)\\s(\\S+)\\s(\\S+)\\s(\\S+)\\s(\\S+)\\s(\\S+)keys:- remote_addr- remote_user- time_local- timestamp- method- url- version- status- body_bytes_sent- http_referer- http_user_agent- request_length- request_time- proxy_upstream_name- proxy_alternative_upstream_name- upstream_addr- upstream_response_length- upstream_response_time- upstream_status- req_id- sys_addressinputDetail:type: container_stdoutcontainerStdout:namespace: ingress-nginx # Namespace where Nginx Ingress is located.workload:kind: deploymentname: ingress-nginx-controller # Select the deployment name of Nginx Ingress Controller.
Collecting log files:
apiVersion: cls.cloud.tencent.com/v1kind: LogConfigmetadata:name: ingress-nginx-controller # Name of the log collection rule. If there are multiple Nginx Ingress instances, ensure they do not conflict here.spec:clsDetail:topicId: "********-****-****-****-************" # Log topic ID to be replaced.logType: fullregex_logextractRule:beginningRegex: (\\S+)\\s-\\s(\\S+)\\s\\[([^\\]]+)\\]\\s\\"(\\w+)\\s(\\S+)\\s([^\\"]+)\\"\\s(\\S+)\\s(\\S+)\\s\\"([^\\"]*)\\"\\s\\"([^\\"]*)\\"\\s(\\S+)\\s(\\S+)\\s\\[([^\\]]*)\\]\\s\\[([^\\]]*)\\]\\s(\\S+)\\s(\\S+)\\s(\\S+)\\s(\\S+)\\s(\\S+)\\s(\\S+)logRegex: (\\S+)\\s-\\s(\\S+)\\s\\[([^\\]]+)\\]\\s\\"(\\w+)\\s(\\S+)\\s([^\\"]+)\\"\\s(\\S+)\\s(\\S+)\\s\\"([^\\"]*)\\"\\s\\"([^\\"]*)\\"\\s(\\S+)\\s(\\S+)\\s\\[([^\\]]*)\\]\\s\\[([^\\]]*)\\]\\s(\\S+)\\s(\\S+)\\s(\\S+)\\s(\\S+)\\s(\\S+)\\s(\\S+)keys:- remote_addr- remote_user- time_local- timestamp- method- url- version- status- body_bytes_sent- http_referer- http_user_agent- request_length- request_time- proxy_upstream_name- proxy_alternative_upstream_name- upstream_addr- upstream_response_length- upstream_response_time- upstream_status- req_id- sys_addressinputDetail:type: container_filecontainerFile:namespace: ingress-nginx # Namespace where Nginx Ingress is located.workload:kind: deploymentname: ingress-nginx-controller # Select the deployment name of Nginx Ingress Controller.container: controllerlogPath: /var/log/nginxfilePattern: nginx_access.log
6. Test Ingress requests to generate log data.
7. Go to the Search and Analyze page in the CLS console, select the log topic used by Nginx Ingress, and ensure the logs can be retrieved properly.
8. If everything is normal, you can use the Nginx Access Dashboard and Nginx Monitoring Dashboard of CLS, and select the log topic used by Nginx Ingress to display the analysis panel of Nginx access logs.
9. In the Nginx Access Dashboard and Nginx Monitoring Dashboard of CLS, you can directly set monitoring and alarm rules using the panels. For details, refer to the Monitoring Alarm Overview.
Bantuan dan Dukungan
Apakah halaman ini membantu?
Anda juga dapat Menghubungi Penjualan atau Mengirimkan Tiket untuk meminta bantuan.
masukan