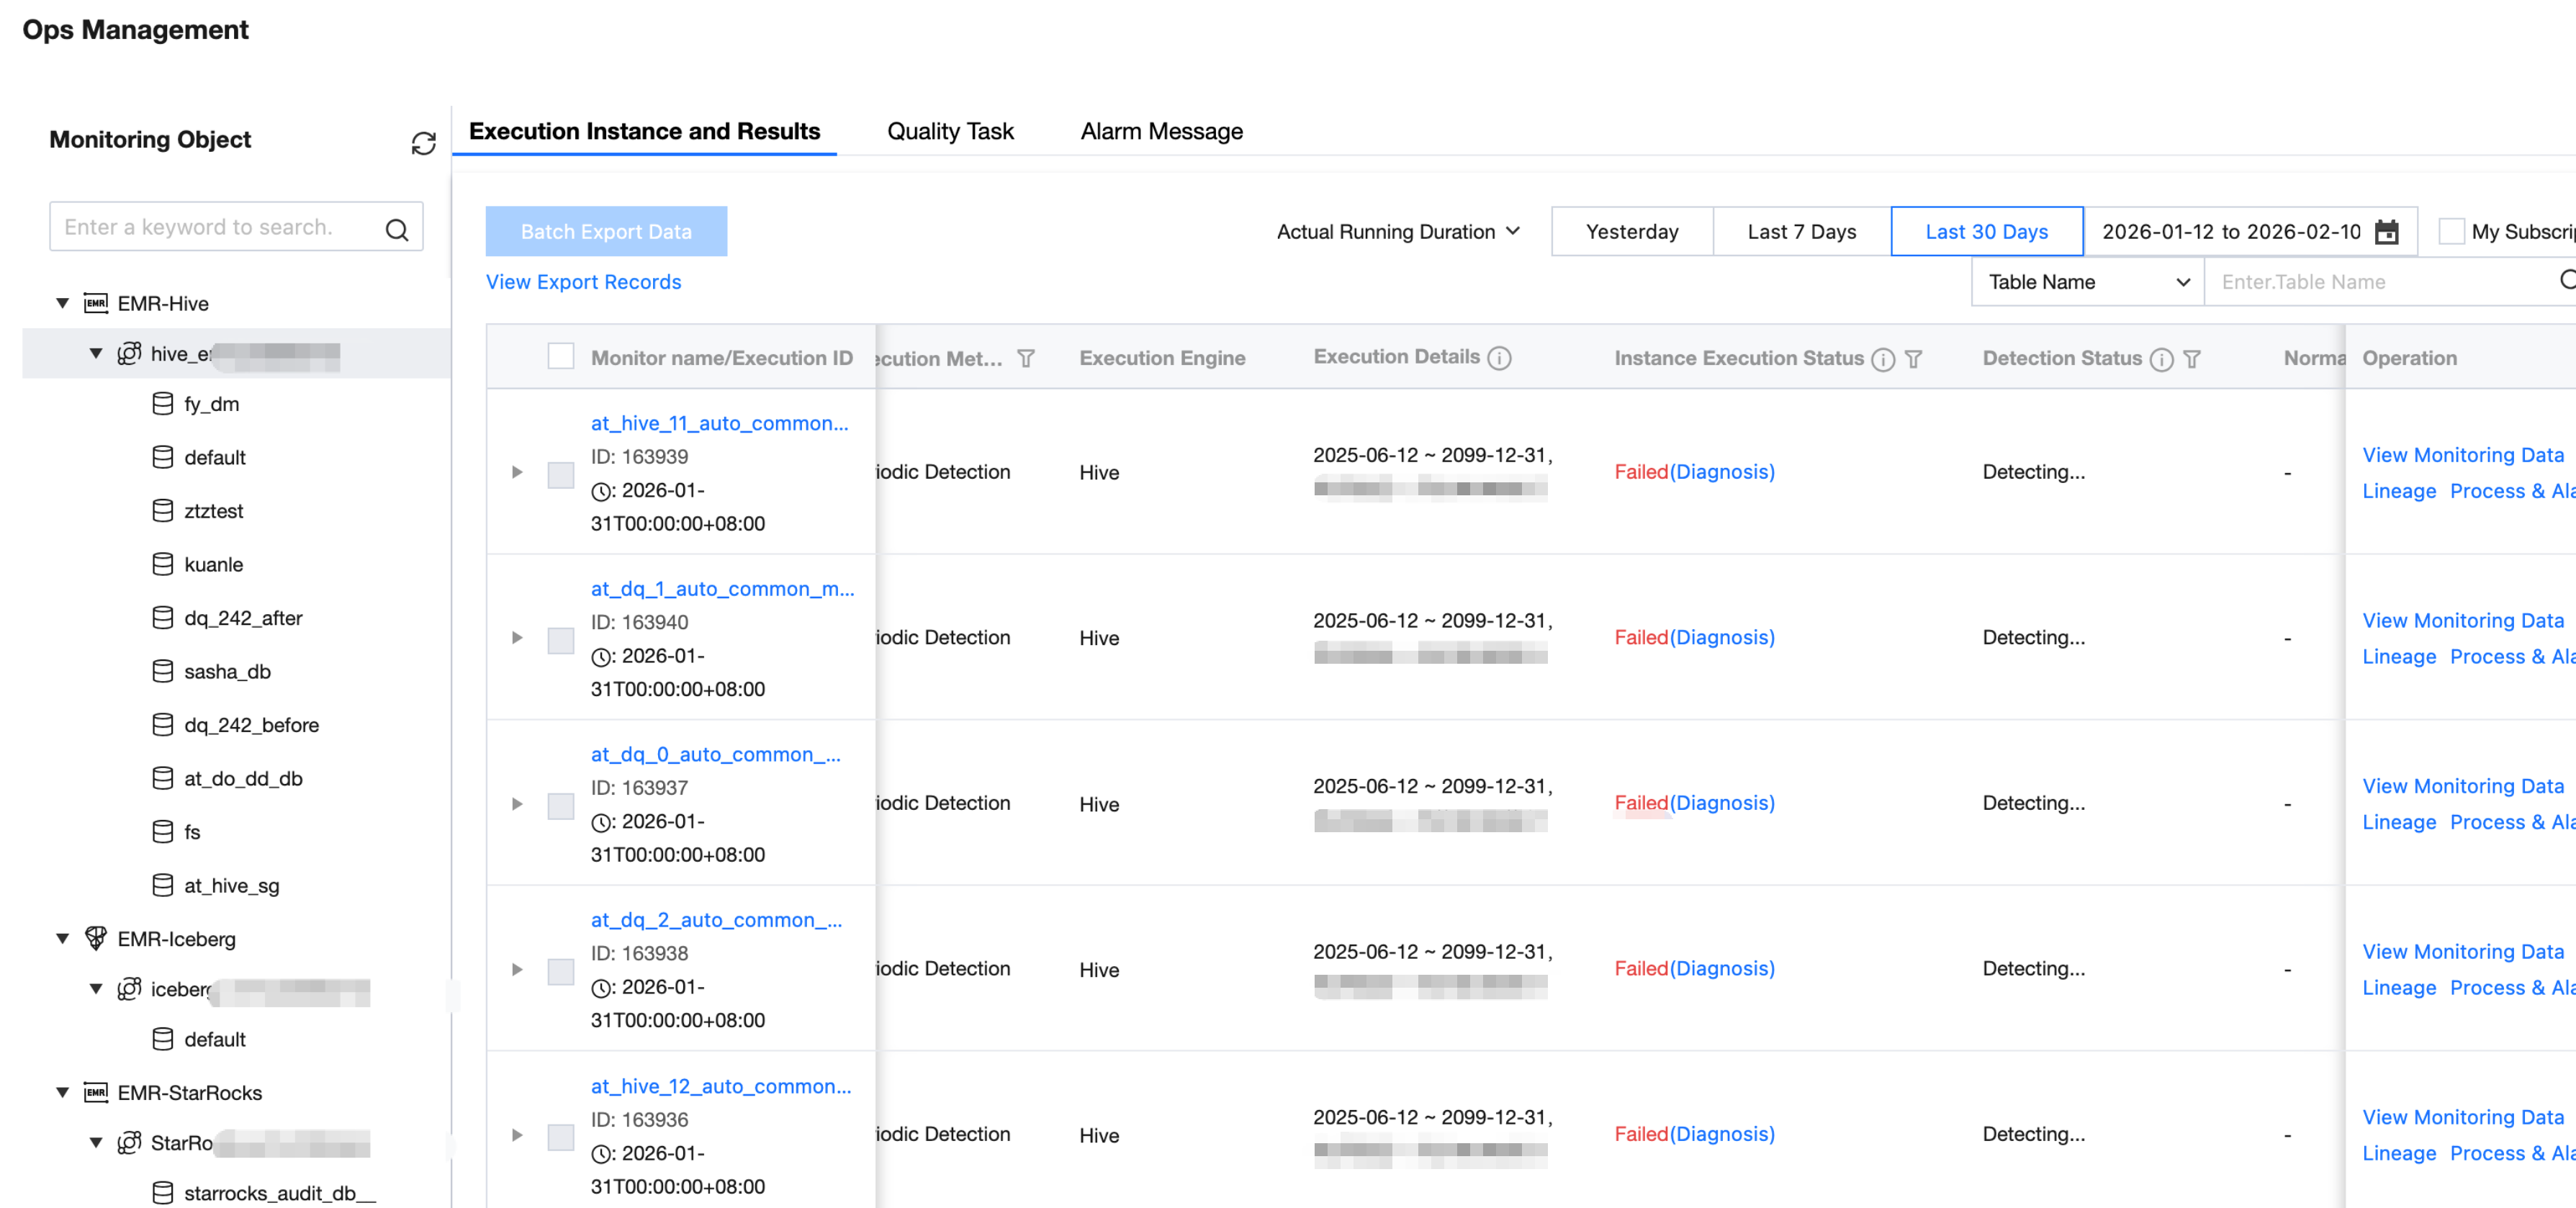
Users can view the operating status of quality inspection tasks on the Ops management - execution instance and result page.
Users can filter quality inspection tasks by data source, database, execution time, and subscription status, and query tasks by table name, task execution ID, table owner, etc.
Field
Details
Monitor name
Execution ID
Quality Monitoring Task Name
Quality Monitoring Task ID
table owner
Quality inspection table owner
Execution Time
Trigger execution time of quality inspection task
Execution Method
Triggering method for quality inspection tasks, including trial run, periodic detection, and scheduling detection (associated production scheduling task).
Execution Engine
The execution engine for quality inspection tasks currently supports Hive, Spark, DLC, TCHouse-P, and Doris.
Execution Details
If the task execution method is periodic detection, the display setting will show periodic detection information (time range, execution frequency).
If it is scheduling triggering, display the associated scheduling task ID.
Instance execution status
Instance execution status is the execution status of the quality task distributed to the scheduling side, including:
1. Pending execution: The scheduling task instance is waiting on the scheduling side.
2. In execution: The scheduling task instance is in execution.
3. Success: The scheduling task instance is distributed successfully.
4. Failed: Scheduling task instance distribution failed (possible reasons: execution machine environment impact, user manual kill, business exception reporting)
Detection status
Detection status is the collection of ALL rule detection results in the current instance.
1. Normal: After successful execution, all rule detection results under the current instance are normal.
2. Abnormal: If any rule under the current instance is triggered, deem abnormal.
3. Detecting: Rules under the instance are being executed.
4. Not detected: The rule has not yet started execution or execution was unsuccessful.
Exception Rule
Exception rule count/total number of rules
Operation
Support redirection to data monitoring to view the table rule configuration.
Support redirection to data operation to view lineage data in the table detail and perform troubleshooting.
Support process & Alarm, manually send anomaly alert.
Viewing Rule Execution Status
The operations management list supports unfolding and viewing the rule triggering conditions for each entry.
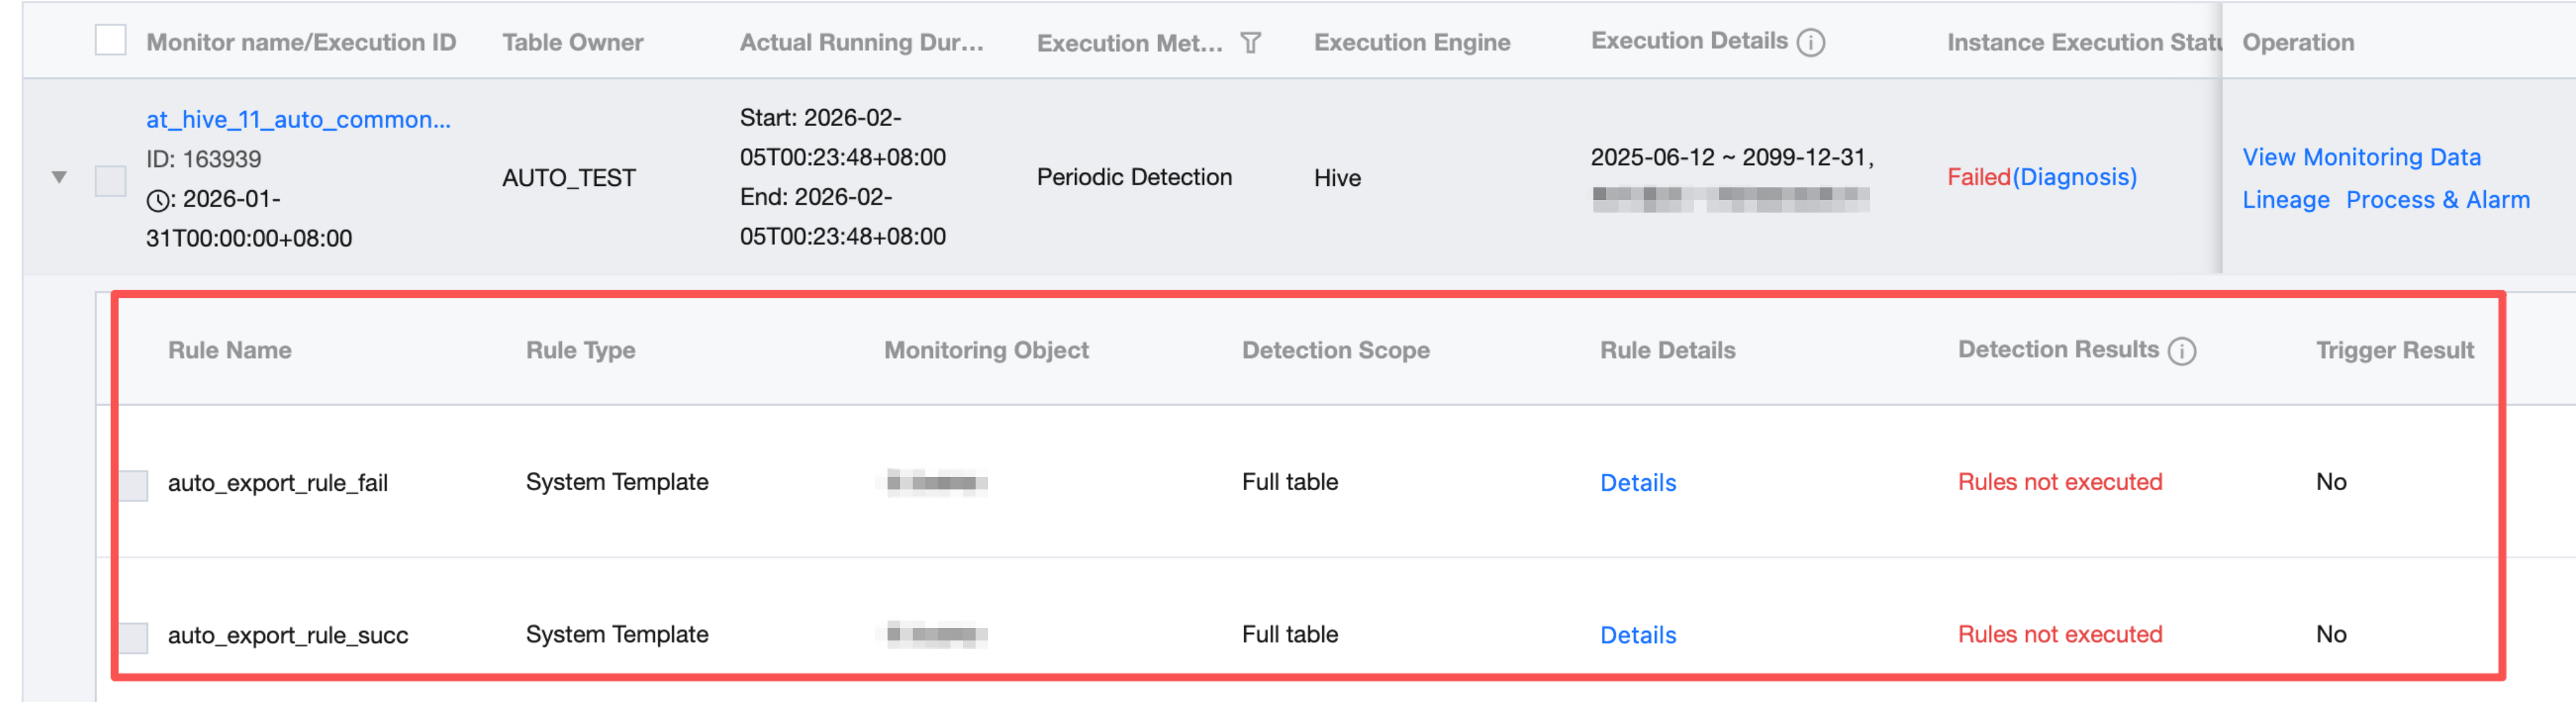
View Rule Execution Result
Users select and click the dropdown identifier on the left side of the list to view rule detection task details (secondary list).
Field
Details
Rule Name
Rule Name
Rule Type
System template Custom template Custom SQL
Data Object
Table-level rule (table) or table field information (field type)
Detection Range
Actual detection range (full table or set partitions)
Rule Details
Rule configuration information, including trigger template, trigger condition, and trigger level.
Detection results
It is divided into 3 statuses: detection passed, trigger rule, and detection failed (task execution failed due to other reasons, not data quality issues).
Trigger Result
It is divided into 3 statuses: no alarm sent, send alarm successfully, block task successfully (the subscribed alarm recipient will receive an alarm through the configured channel).
Comparison of calculation results
The detection result data/configured threshold, exception occurs in the result data will be highlighted in different colors, multiple detection results are separated by comma.
Operation
Support viewing rule task execution results & logs and execution history
View Results & Logs
Click Result & Log in the list operation column of the secondary task to view detection task details, support exporting issue details, redirect to Data Operation table detail for Output and Changes, and view production task.
Export Single Rule Execution Result
Enter Results and logs > result page, enter the export data interface, click Export.
Viewing Production Task
Enter Results and logs > result page, click View Production Task.
View Execution History
Support the view of execution logs, click Execution History to view the last 30 task execution records:
Batch Export Data
Step 1: Submit export task
User can check the execute instance and submit export task.
Step two: Download export data
After the export task is submitted, wait for the task to complete (Export status: Exporting > Export successful), then download data.
Note:
File generation logic: Each quality rule generates 1 file.