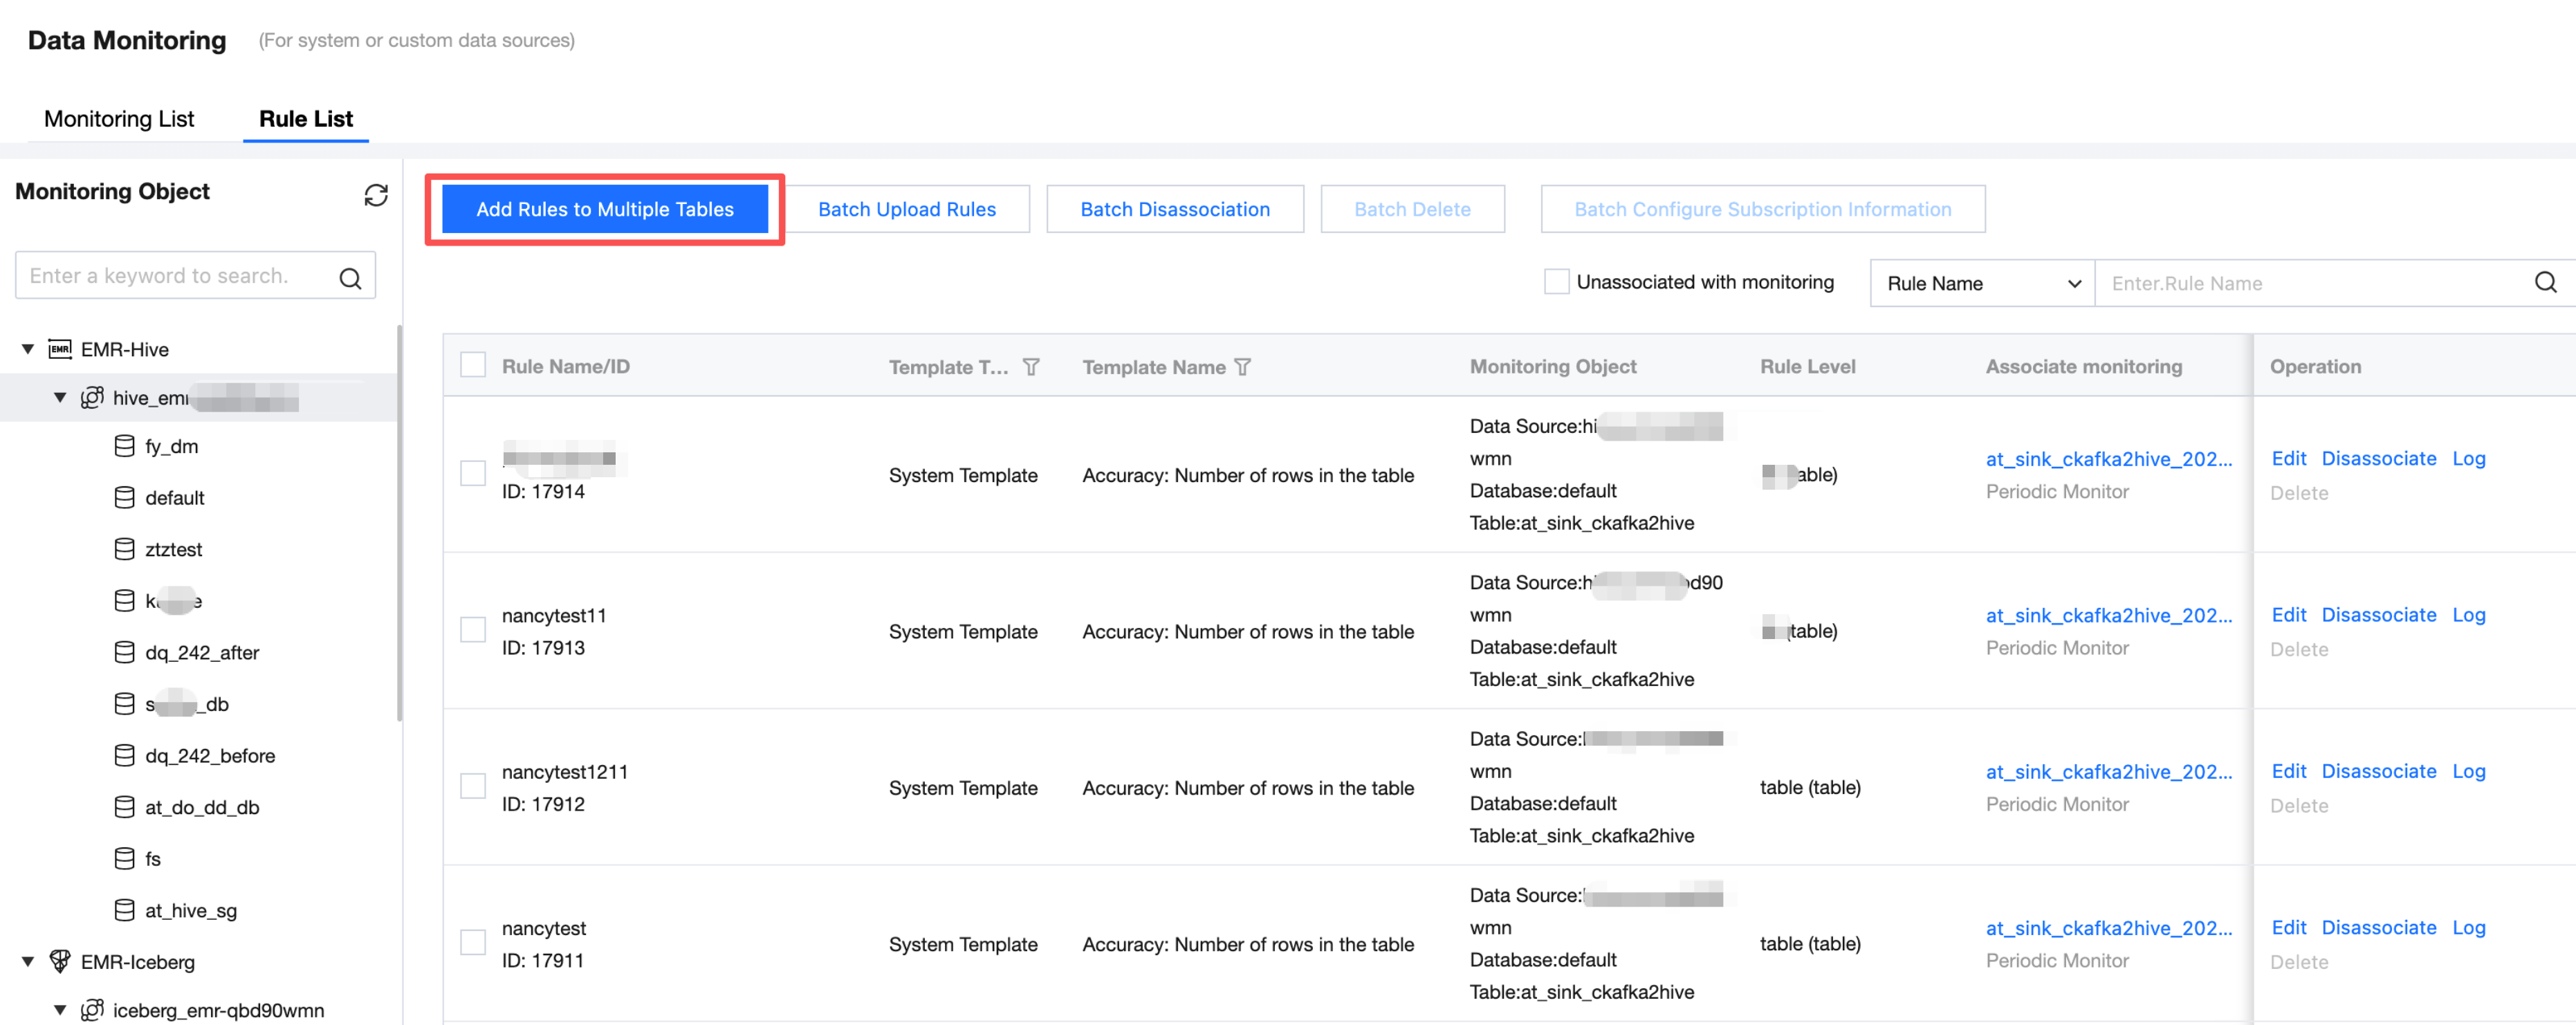
In the rule list, you can add rules to multiple tables and batch upload rules to batch configure quality rules across multiple tables.
Adding Rules to Multiple Tables
Support monitoring rules for multiple tables.
Use cases: Add the same monitoring rule to multiple database tables in one-time.
Step 1: Enter Data Monitoring Page
Enter the Data Quality > Data Monitoring > EMR interface, click Add Rules to Multiple Tables to start adding multiple monitoring rules.
Note:
Currently, WeData supports the following data source types: EMR-Hive, DLC, TCHouse-P, TCHouse-D, and Doris.
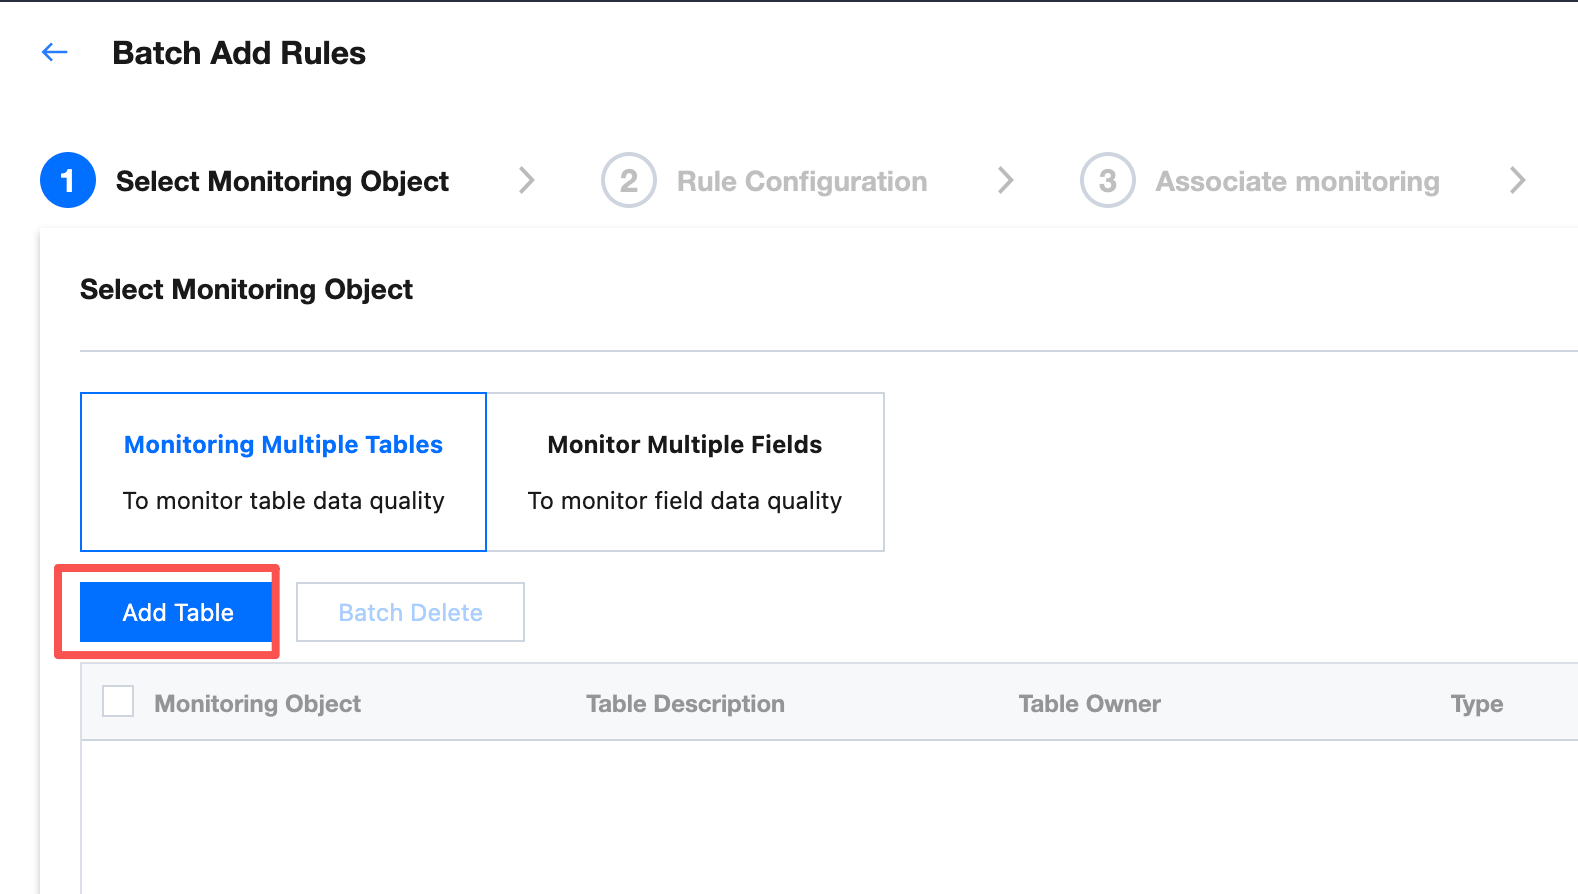
Step 2: Set Monitoring Scope
1. Click Add Rules in Batches, enter the Adding Rules in Batches interface, and you can choose Monitor Multiple Tables or Monitor Multiple Fields.
Multi-table: Add multiple tables from the same data source across databases.
Multi-field: Add multiple tables from the same data source across databases and tables.
2. Click Add Table to add tables/fields:
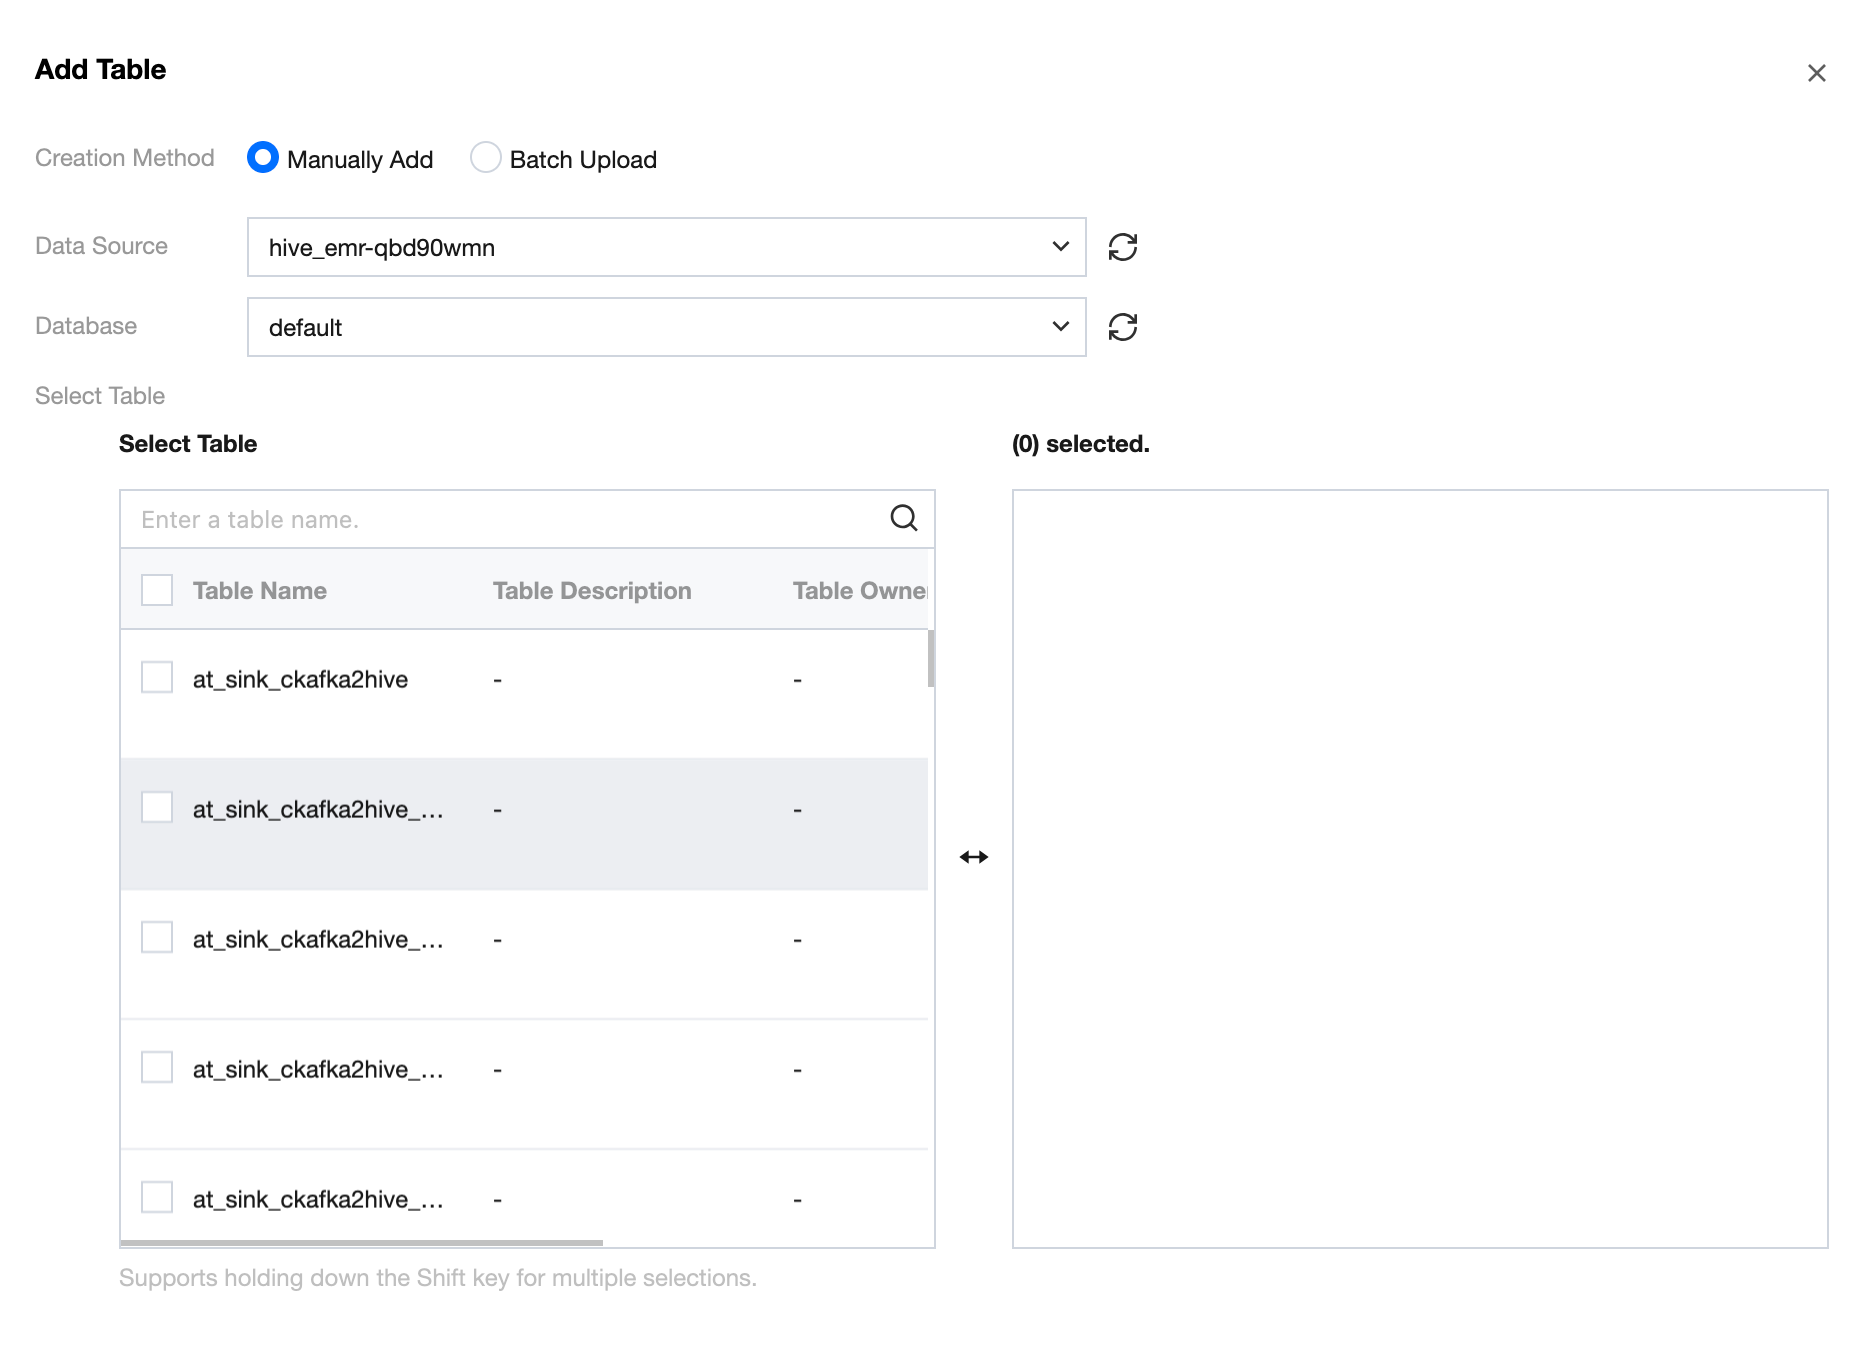
Manually add: Just check the box.
Batch upload: Requires uploading an Excel file. Monitor multiple tables and multi-field templates differ.
Monitor multiple tables: The Excel file contains three columns: data source name, database name, and table name.
Monitor multiple fields: The Excel file contains four columns: data source name, database name, table name, field name.
3. Click Next to enter the rule configuration page.
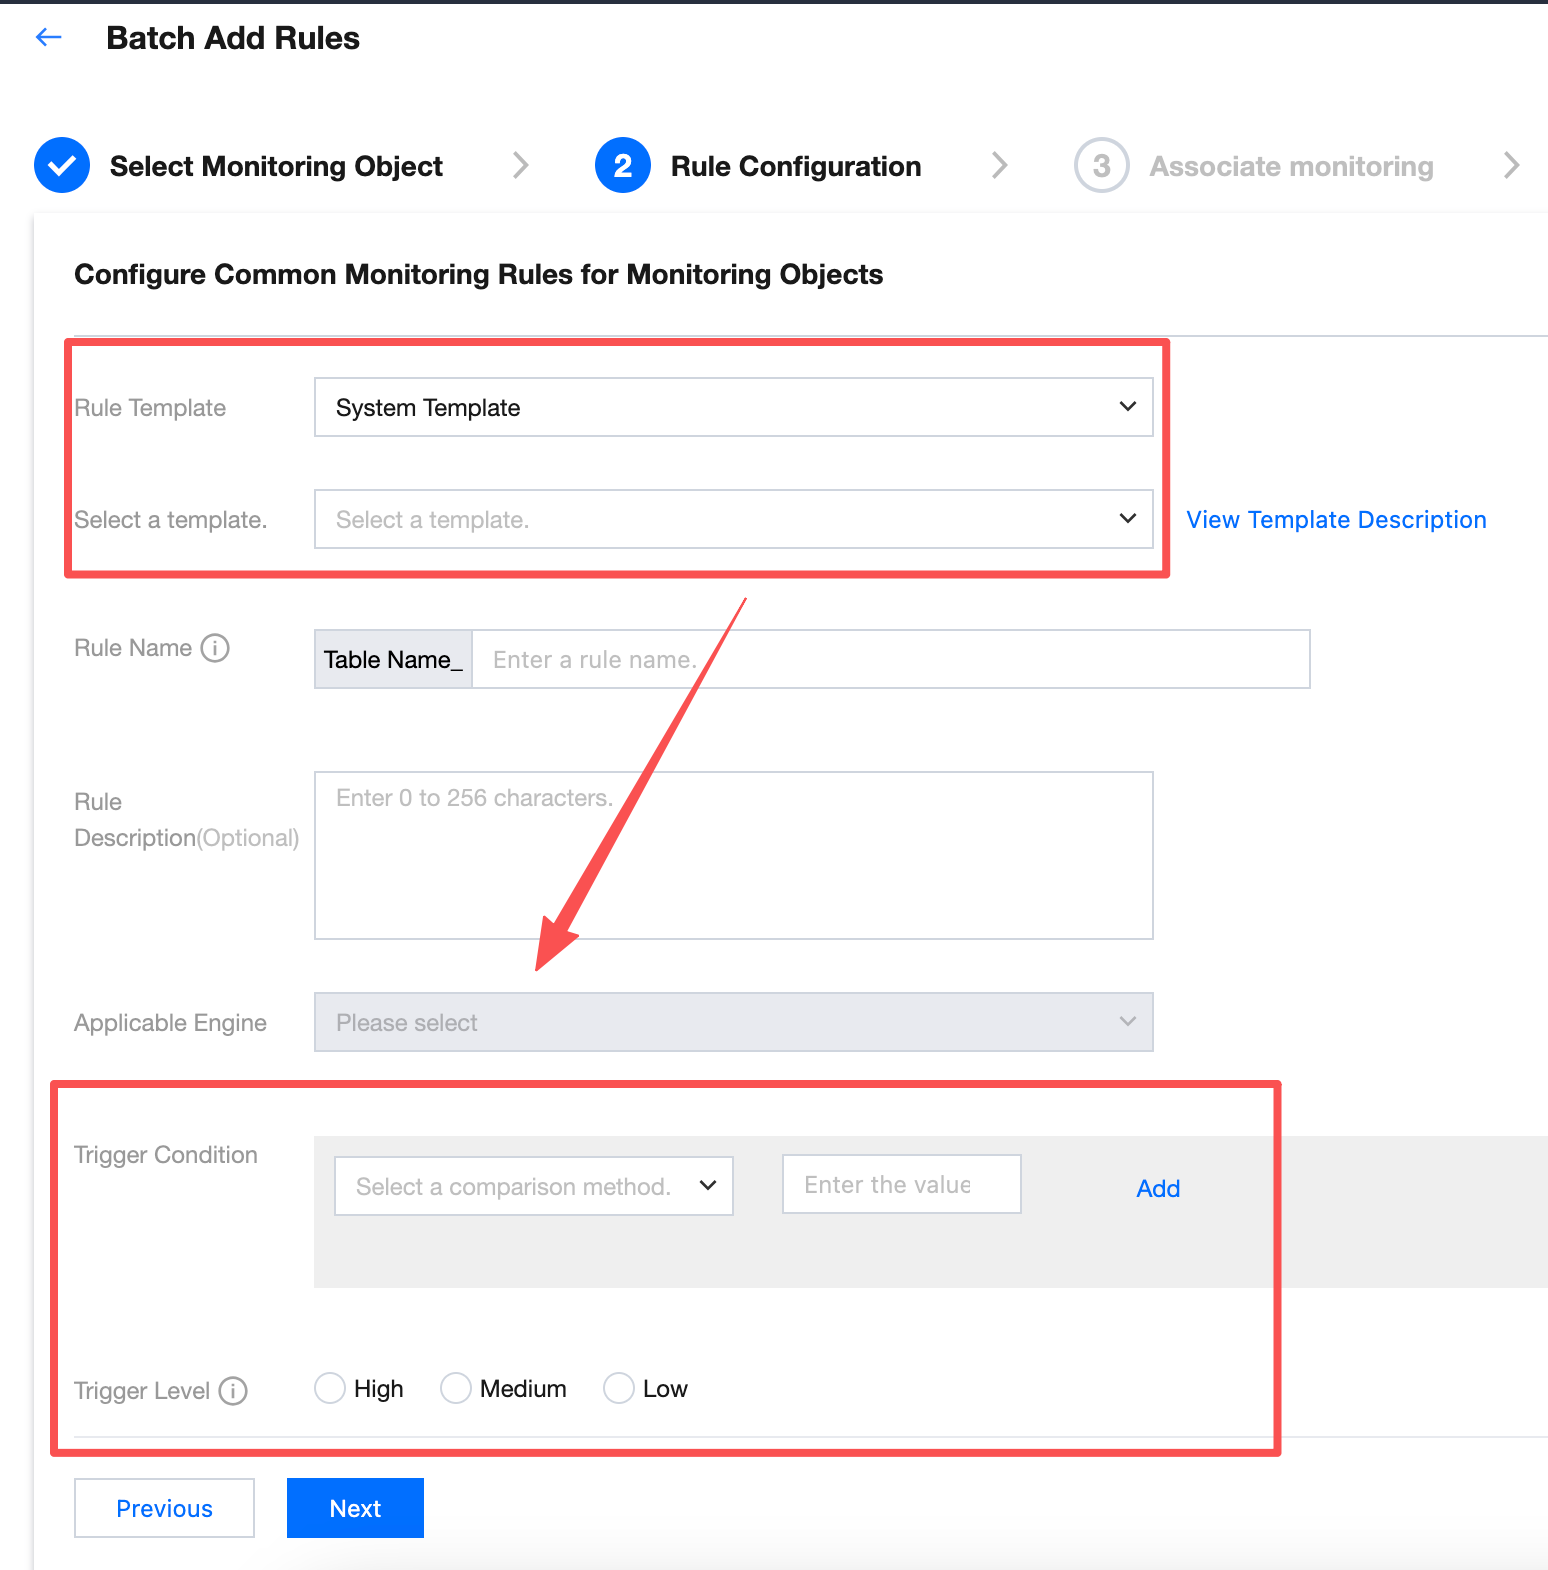
Step 3: Configure Monitoring Rules
1. Select a rule template: Only system template and custom template are supported.
System template: WeData has built-in 56 rule templates that can be used for free. For more details on each template, please refer to system template description.
Custom template: You can add rules applicable to your own business in the rule template menu for easy reuse. For detailed operation instructions, please refer to custom template description.
Database table parameters: The webpage will be rendered based on the SQL statement filled in the custom template, allowing users to choose.
table_1 means the currently selected table; table_2...table_n represent other tables, and the table to be confirmed (currently only support 1).
${table_1.column_1}...${table_1.column_n} means the fields in the table, and the fields to be confirmed need to be selected.
where parameter: The webpage will be rendered based on the SQL statement filled in the custom template, allowing users to choose.
${param_1}...${param_n} represent the parameters in the where condition, and values need to be filled in.
2. Select a template: Here, filtering will be performed based on rule type and monitored object.
For example, select System Template, choose Table Level as the monitoring object. Here, only Number of Rows and Table Size are available.
3. Trigger condition: The comparison operator can be a select interval or size value.
Example: If the number of rows is less than 1, combined with the time variable filled in the detection range, it indicates that an alarm is triggered when no new data was added yesterday.
Comparison operator: select ;
Compare value: fill in 1.
Trigger conditions vary for different templates. For detailed configuration logic, see System Template Instructions.
Note:
The trigger condition filled here is abnormal value, which are the conditions for triggering alarms.
4. Click Next to enter the strategy configuration page.
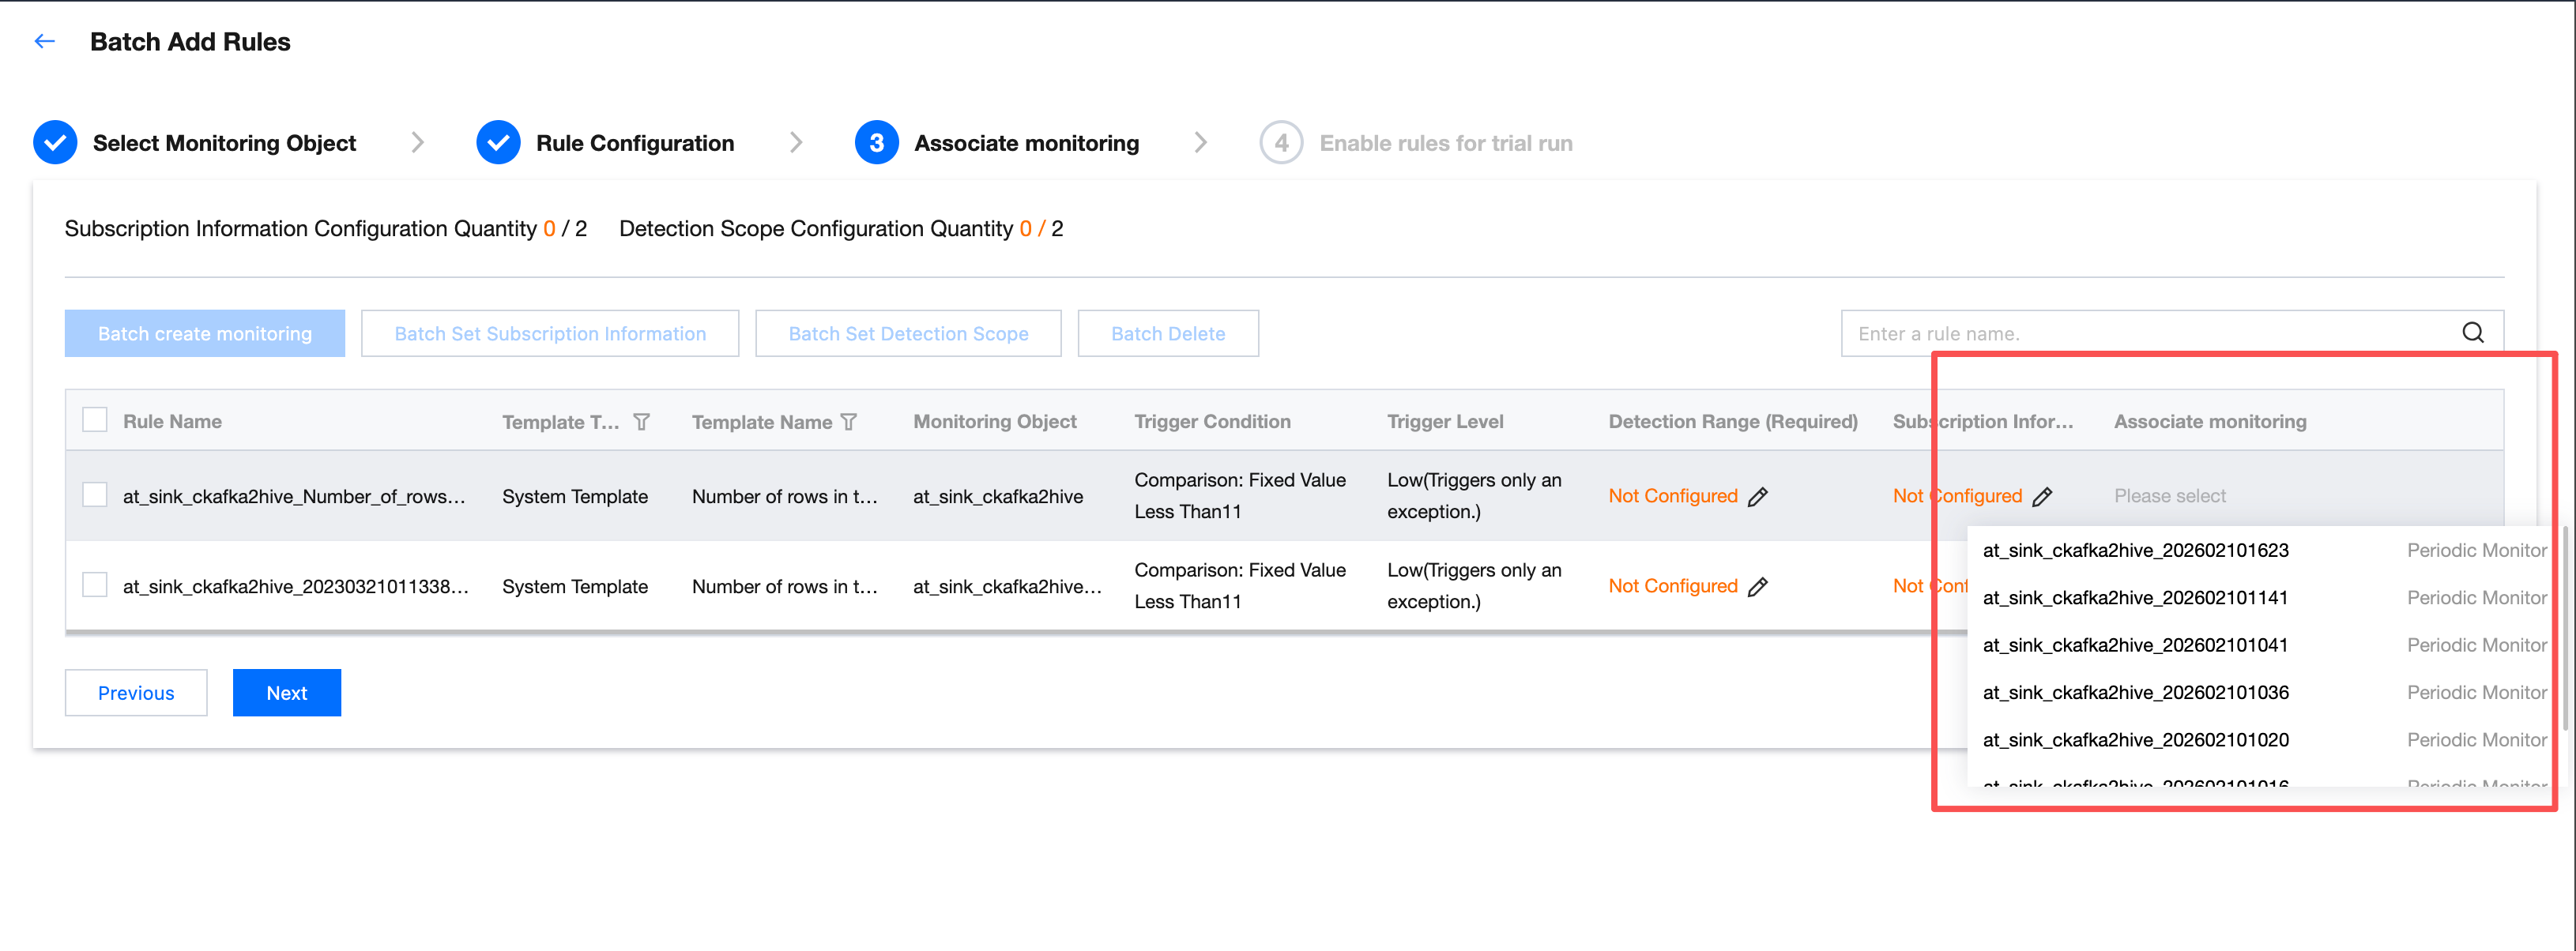
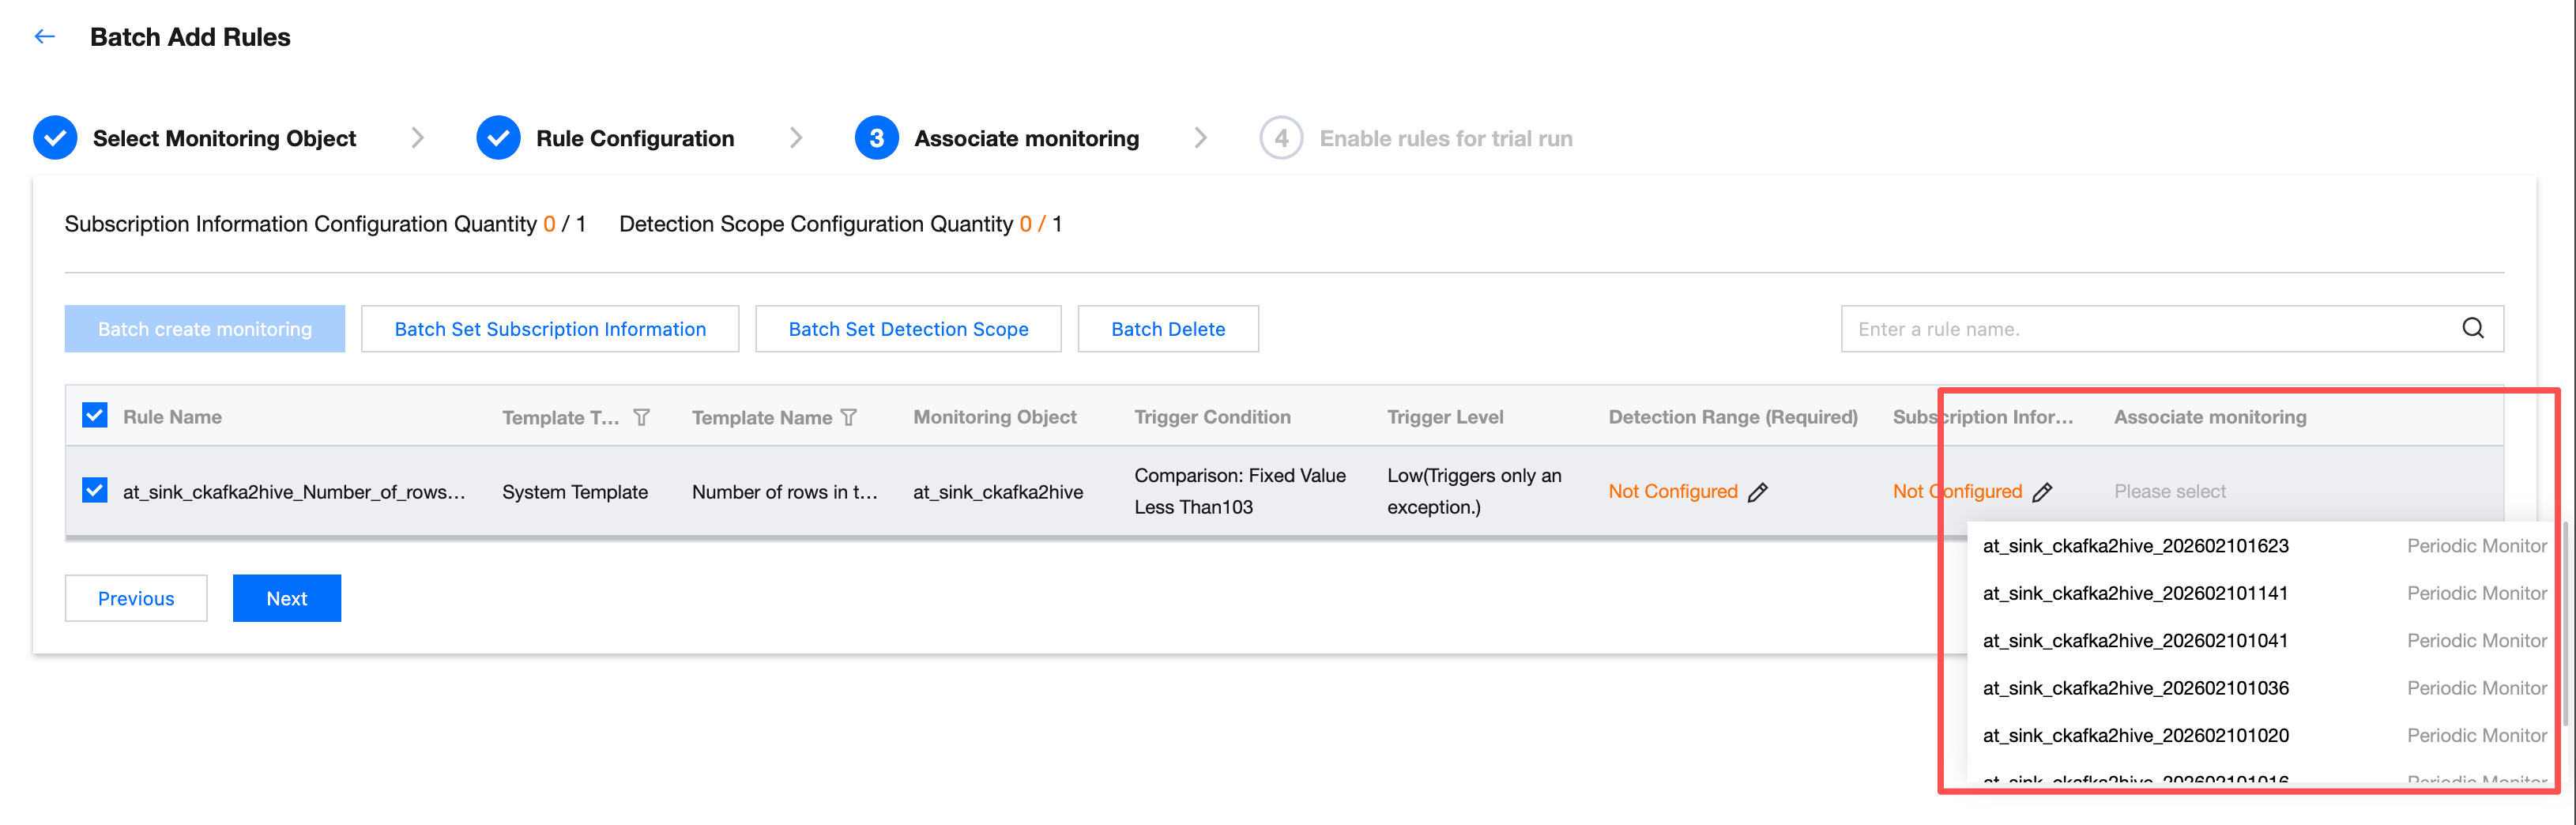
Step 4: Associate Monitoring
1. In the monitor association field, click the dropdown list and select the monitoring task under the rule correspondence table to associate.
2. If you need to batch create and associate quality monitoring tasks, select the corresponding rule and click Batch Create Monitoring.
3. After creating monitoring, the selected rule will be automatically associated with the created monitoring. The created monitoring will be displayed in the monitoring list.
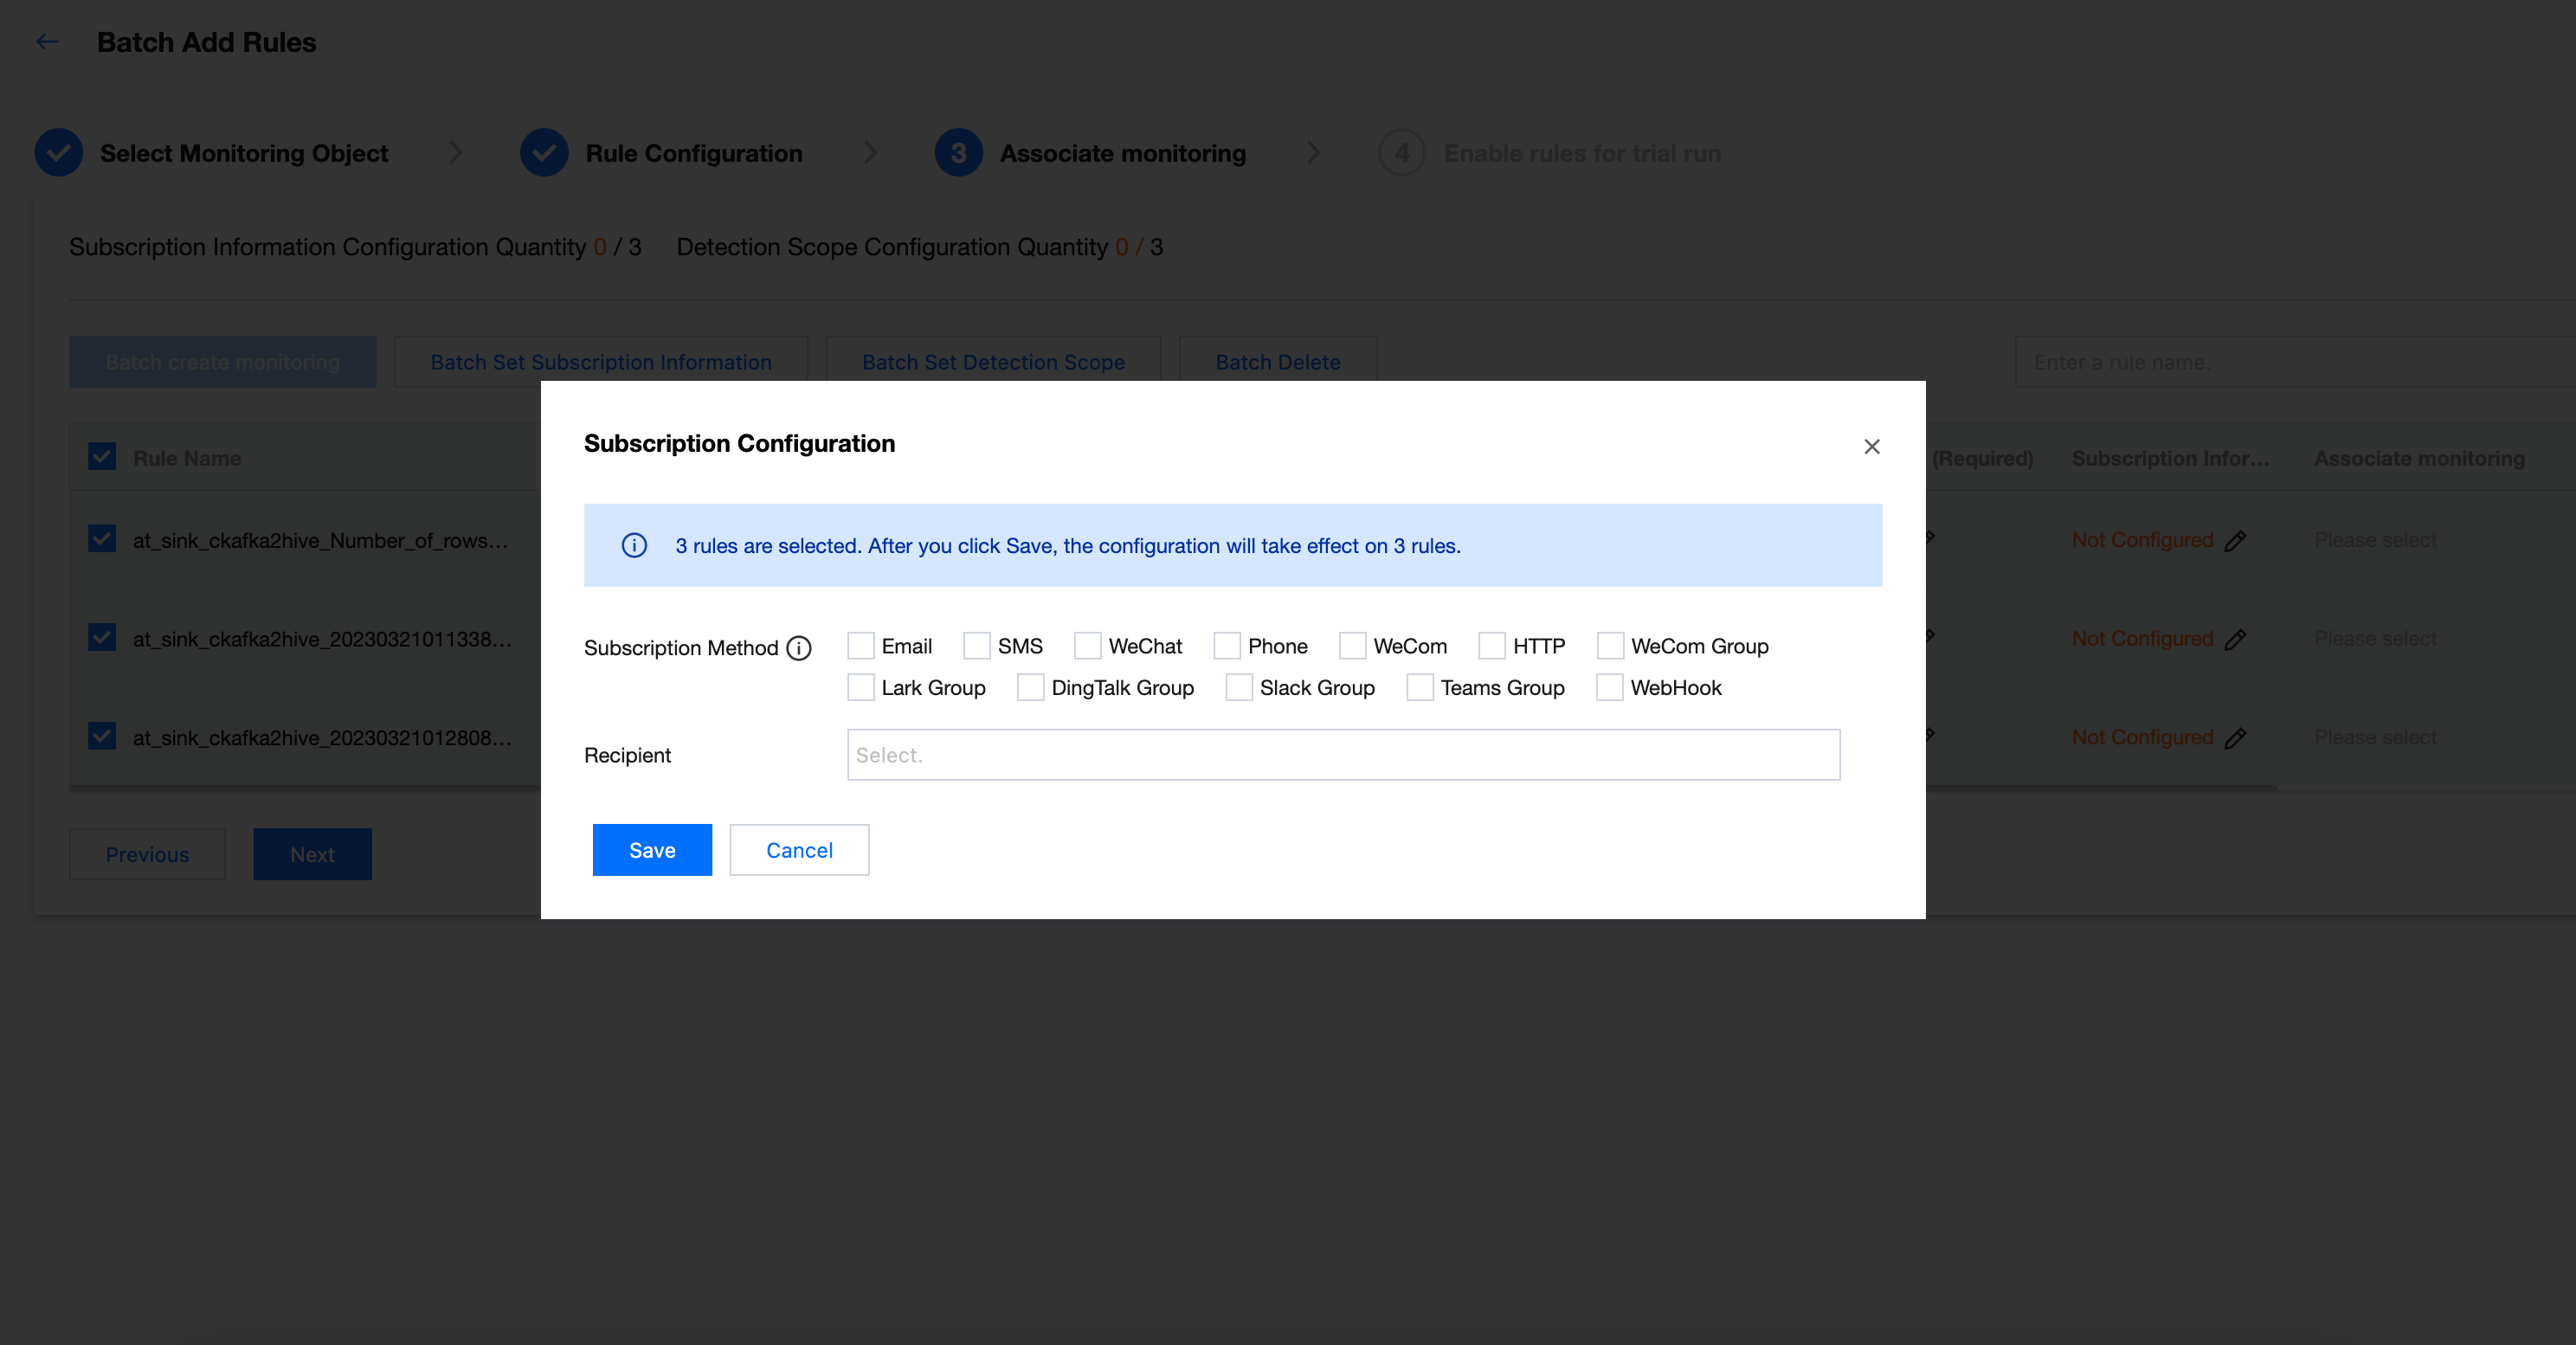
Step 5: Set Up Subscription
Set up a subscription to send notifications when the quality detection task running result meets trigger conditions (result not as expected, detection result failed), what method to send notification and notify whom.
1. Enter the Batch Set Subscription Information interface to set subscription information in batch.
2. On the pop-up subscription settings page, check the subscription method you need, and set the recipient. Click Save.
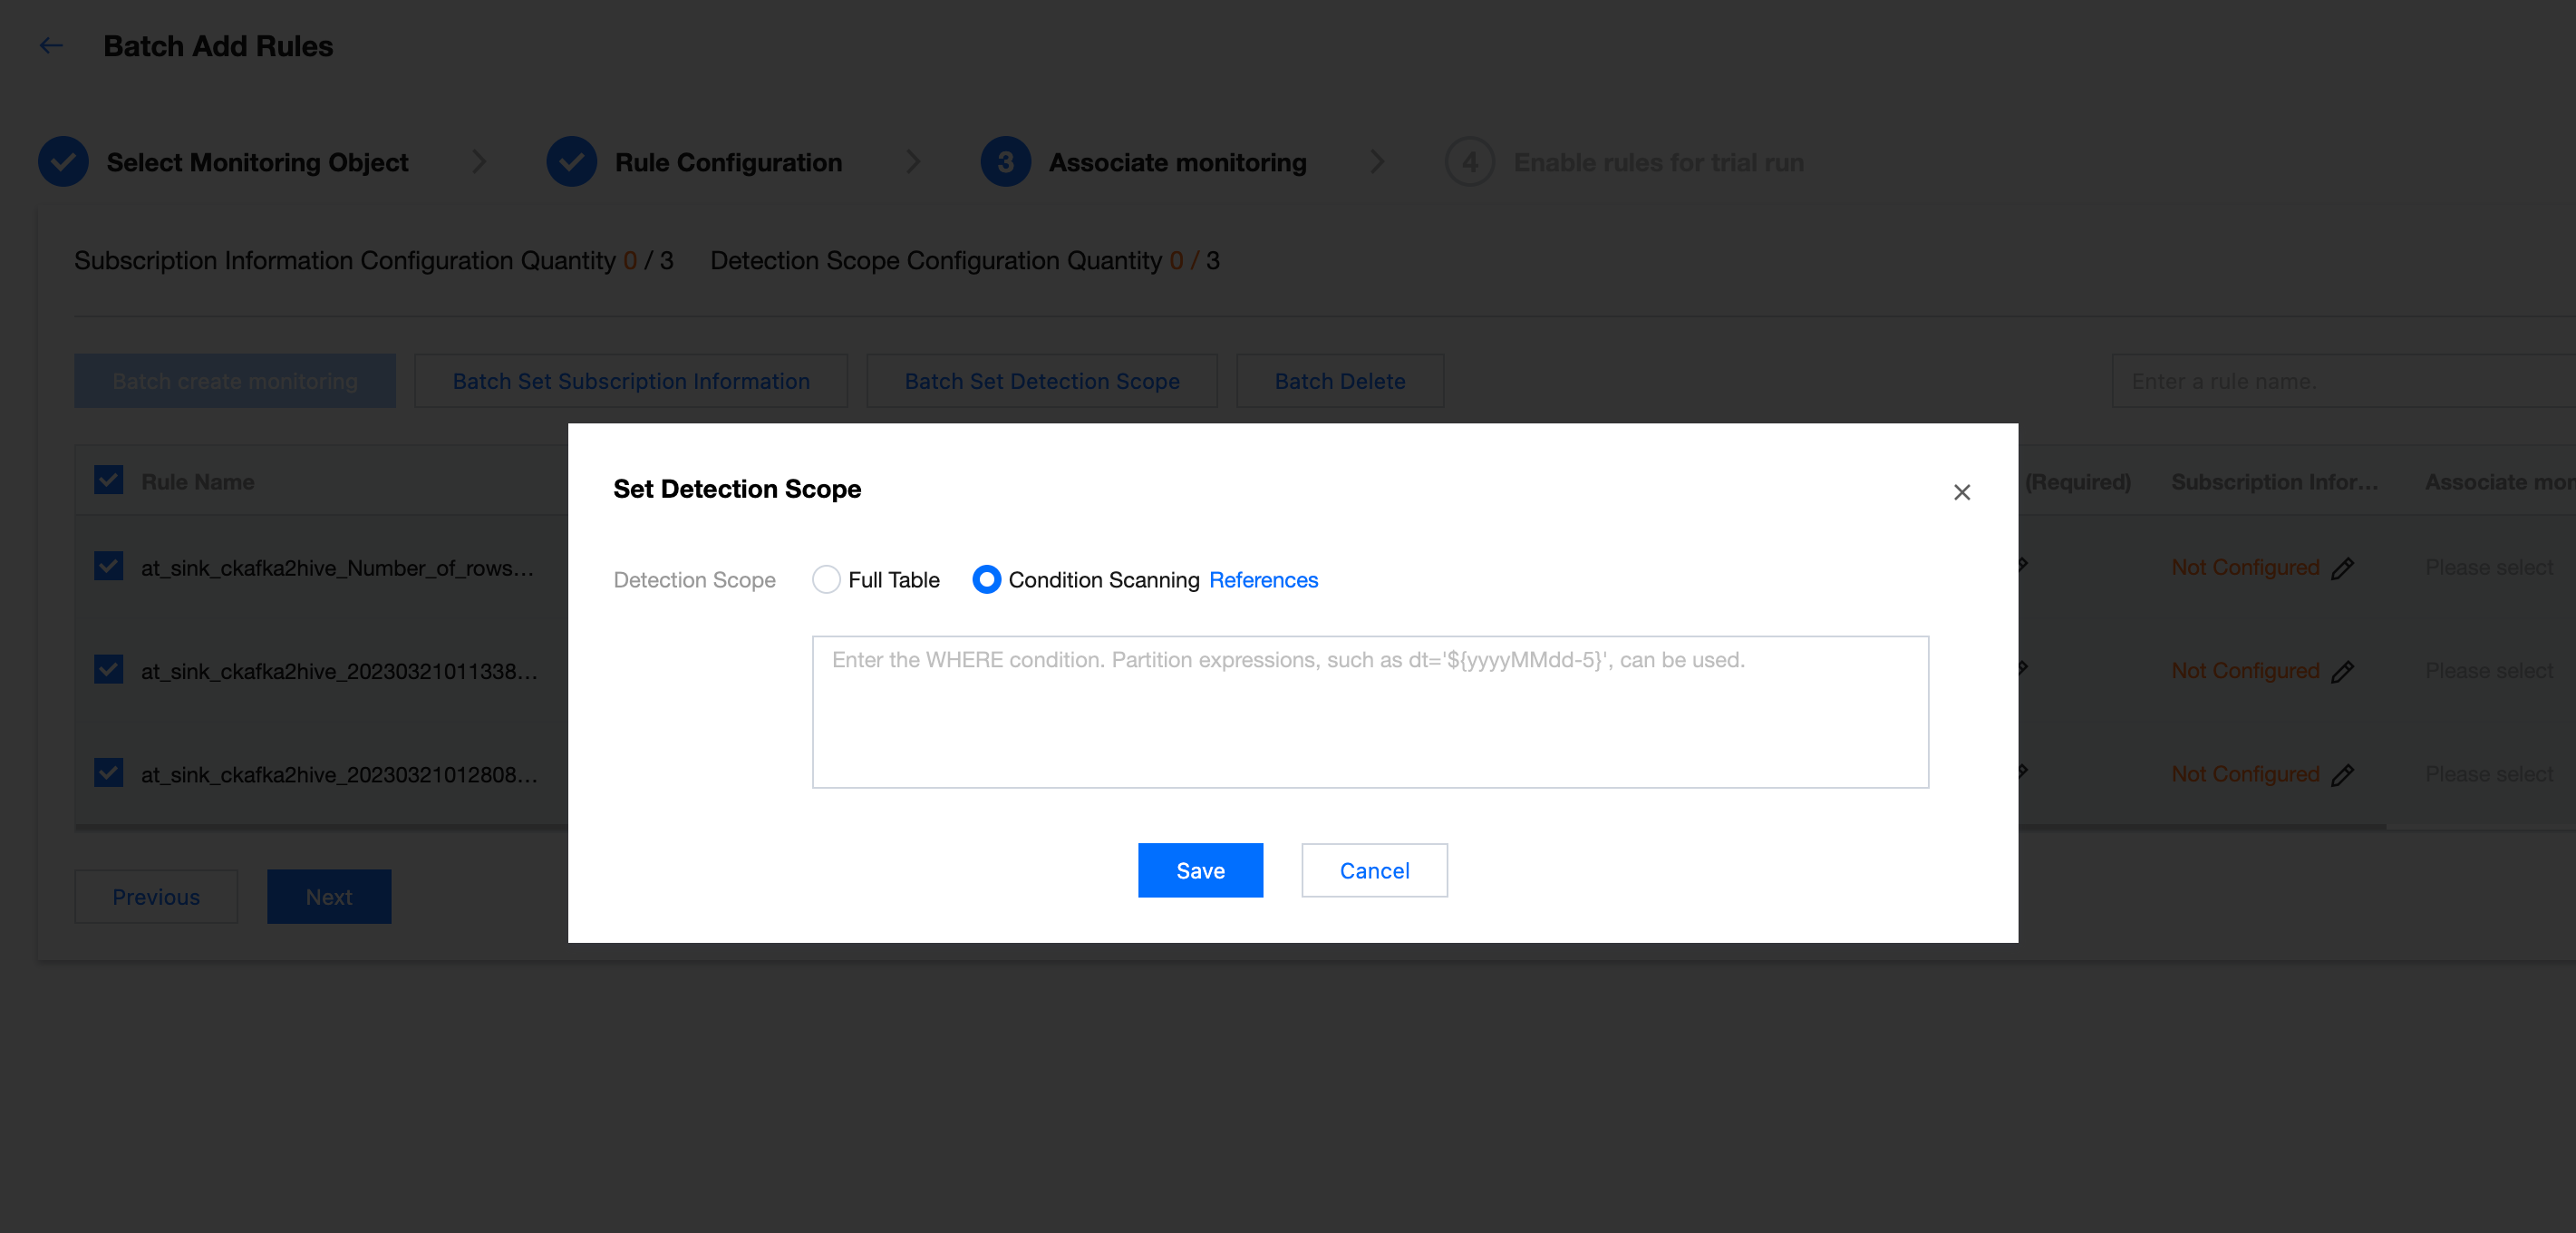
Step 6: Set Detection Scope
1. Click Batch Set Detection Scope to enter the Set Detection Scope interface and batch set the detection scope.
2. On the popup page, add the following information:
Here you can select conditional scan or full table scan. Recommend choose conditional scan.
You can fill in the partition where condition, for example:
pt_date='${yyyy-MM-dd-1d}'
Note:
Here fill in the partition field to avoid full table scan every time the quality task runs, which causes wastage of computational resources.
In SQL, ${yyyy-MM-dd-1d} is a date variable that represents one day before the execution date. It will be replaced with a specific date during Quality Task Execution.
For example: When the quality task runs at 2024-05-02 00:00:00, ${yyyy-MM-dd-1d} will be replaced with 2024-05-01.
2. Modify the scheduling time, click Start trial run. After the trial run ends, you can click Click to view operation results.
Note:
The scheduling time filled in here will modify the Partition Time Variable.
For example, if you fill in 2024-05-02 here, ${yyyy-MM-dd} means 2024-05-02, and ${yyyy-MM-dd-1d} means 2024-05-01.
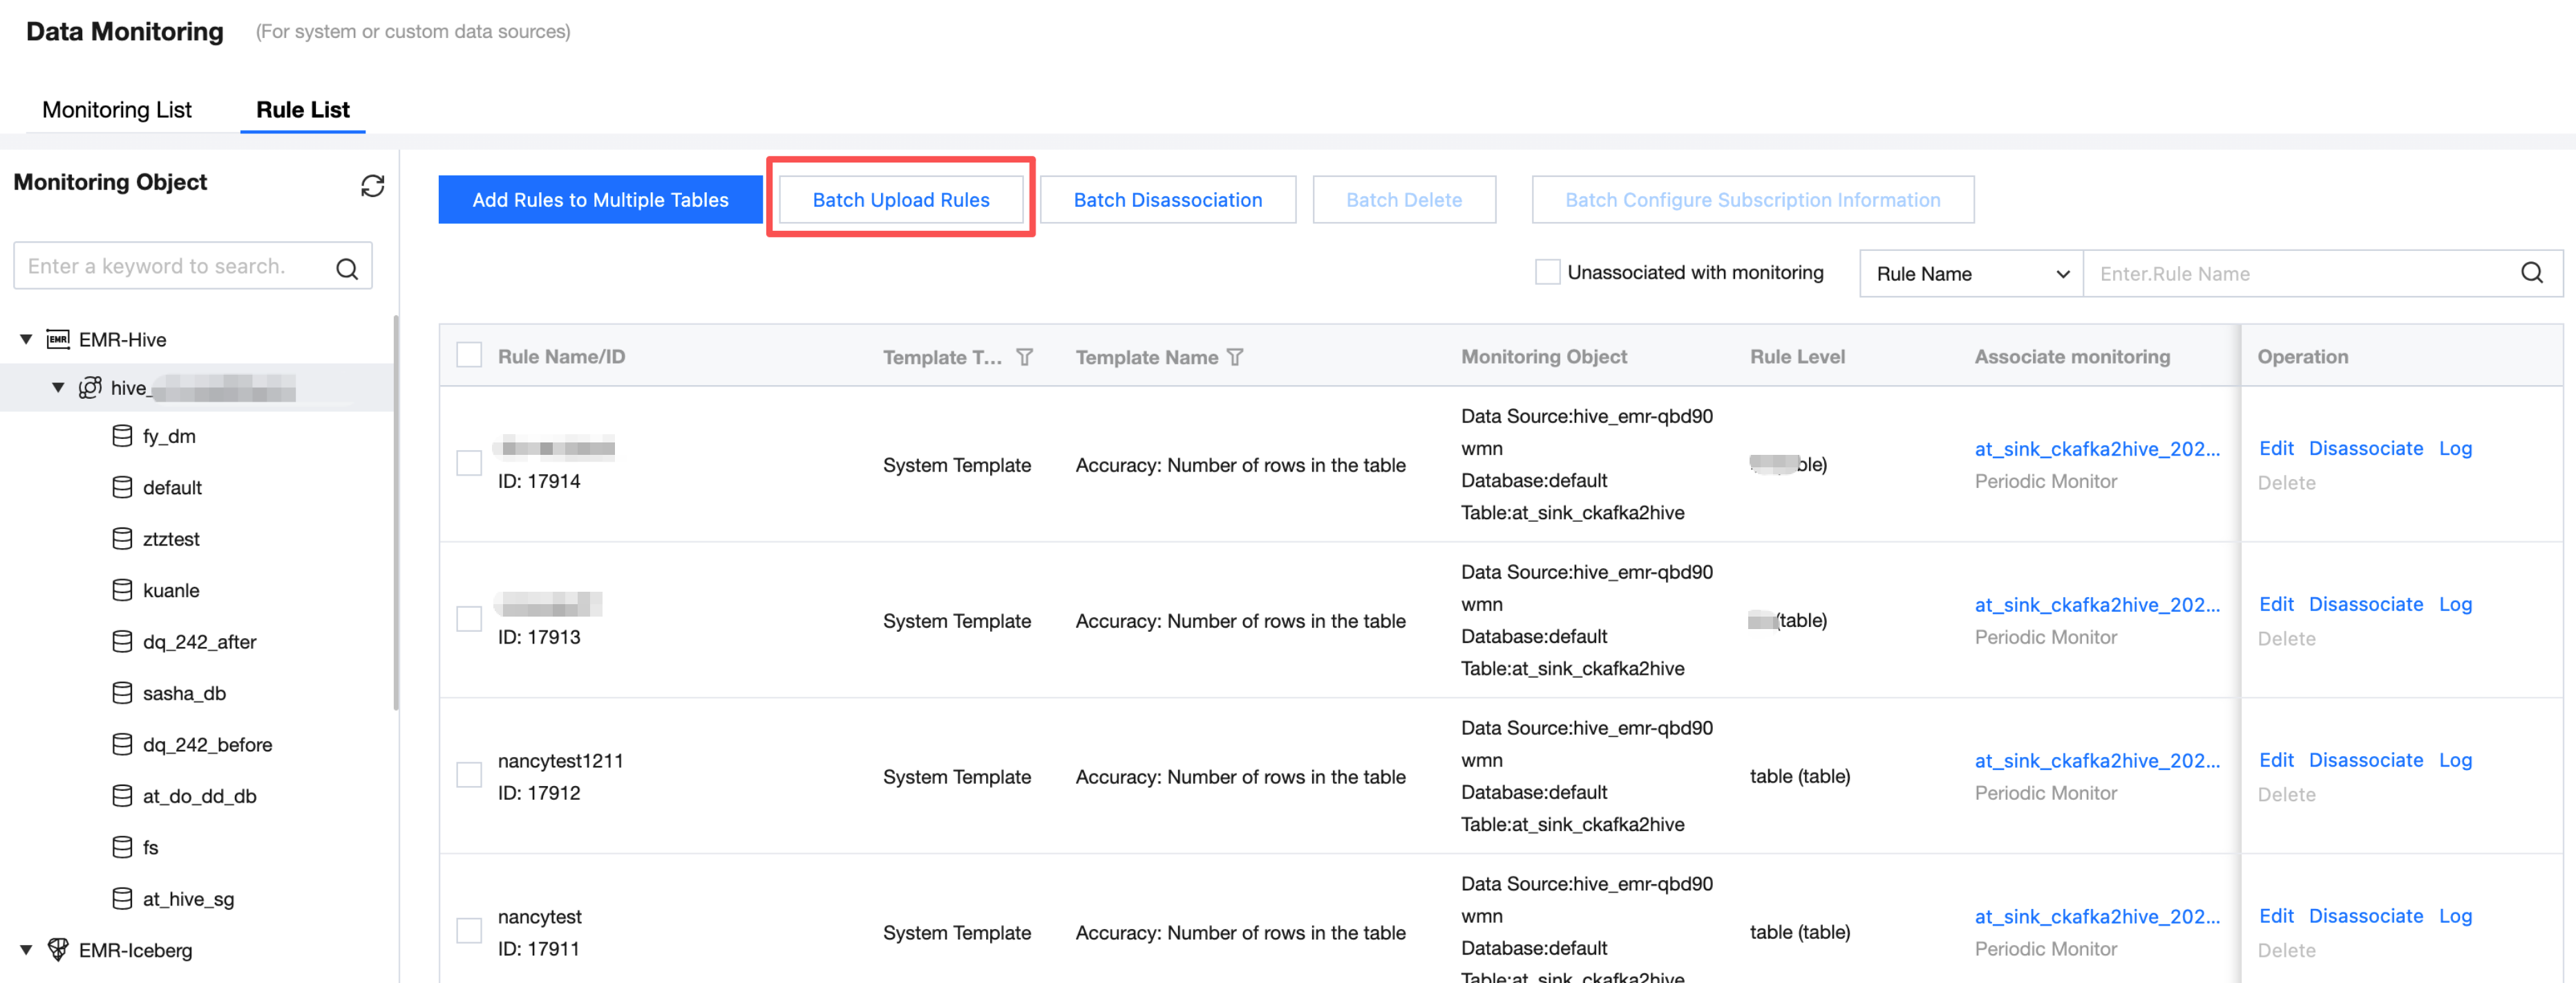
Batch Upload Rule
Upload attachments by uploading an Excel file, add new quality monitoring rules, and support monitoring rules for multiple tables.
Use cases: Add multiple monitoring rules to multiple database tables in one-time.
Step 1: Enter Data Monitoring Page
Enter the Data Quality > Data Monitoring > EMR interface, click Batch Upload Rule to add multiple quality rules.
Note:
Currently, WeData supports the following data source types: EMR-Hive, DLC, TCHouse-P, TCHouse-D, and Doris.
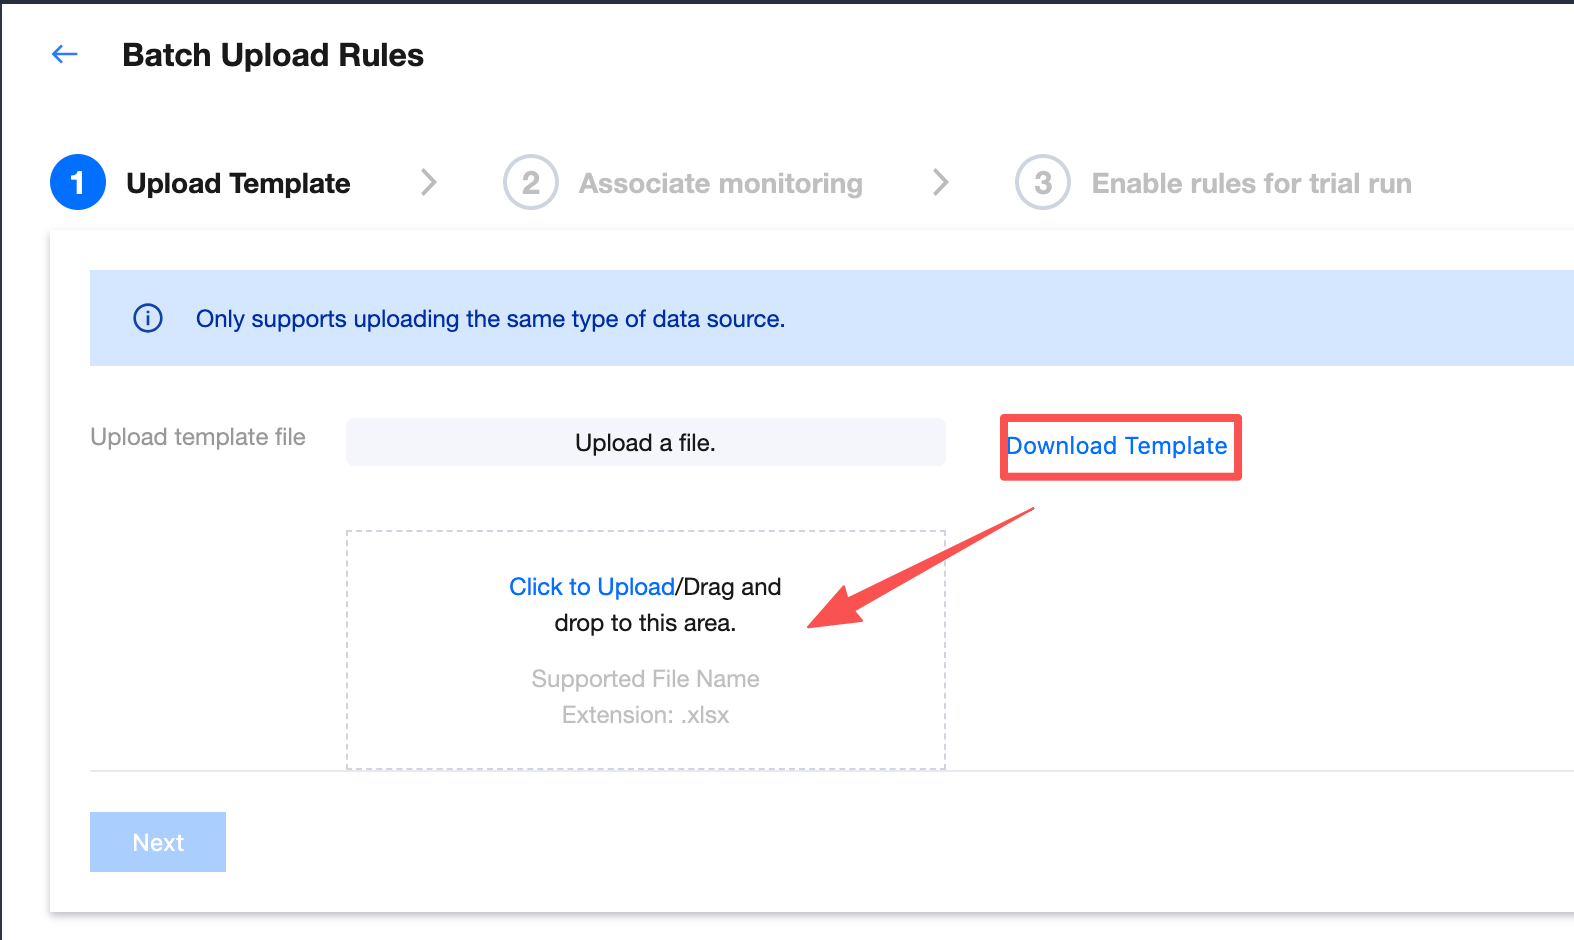
Step Two: Upload Template
1. Enter Data Monitoring > Batch Upload Rule interface. On the upload template interface, click Download Template, modify locally, then click Click Upload to upload the template.
SQL statement: Fill in an SQL statement here. The requirements are as follows:
The result must be one row and one column, a fixed value.
Only allowed to use partition variables, such as ${yyyy-MM-dd}.
Do not allow the use of table name and column name variables.
Trigger condition: comparison operator and compare value, colon-separated.
Comparison operator: fill in Chinese characters.
Compare value: fill in a numeric value.
2. Click Next to continue configuration.
Step Three: Associate Monitoring
1. In the monitor association field, click the dropdown list and select the monitoring task under the rule correspondence table to associate.
2. If you need to batch create and associate quality monitoring tasks, select the corresponding rule and click Batch Create Monitoring.
3. After creating monitoring, the selected rule will be automatically associated with the created monitoring. The created monitoring will be displayed in the monitoring list.
Step Four: Set Up Subscription
Set up a subscription to send notifications when the quality detection task running result meets trigger conditions (result not as expected, detection result failed), what method to send notification and notify whom.
1. Enter the Batch Set Subscription Information interface to set subscription information in batch.
2. On the pop-up subscription settings page, check the subscription method you need, and set the recipient. Click Save.
Step Five: Set Detection Scope
1. Click Batch Set Detection Scope to enter the Set Detection Scope interface and batch set the detection scope.
2. On the popup page, add the following information:
Here you can select conditional scan or full table scan. Recommend choose conditional scan.
You can fill in the partition where condition, for example:
pt_date='${yyyy-MM-dd-1d}'
Note:
Here fill in the partition field to avoid full table scan every time the quality task runs, which causes wastage of computational resources.
In SQL, ${yyyy-MM-dd-1d} is a date variable that represents one day before the execution date. It will be replaced with a specific date during Quality Task Execution.
For example: When the quality task runs at 2024-05-02 00:00:00, ${yyyy-MM-dd-1d} will be replaced with 2024-05-01.