Exception Diagnosis
Download
フォーカスモード
フォントサイズ
The exception diagnosis feature provides real-time performance monitoring, health inspection, and failure diagnosis for your database instances. It allows you to intuitively perceive the real-time operation status and locate performance exceptions as they occur.
Overview
Viewing the Diagnostic Information
1. Log in to the TencentDB for DBbrain (DBbrain) console.
2. In the left sidebar, select Performance Optimization.
3. At the top of the page, select the database type and instance ID, and select the Exception Diagnosis tab.
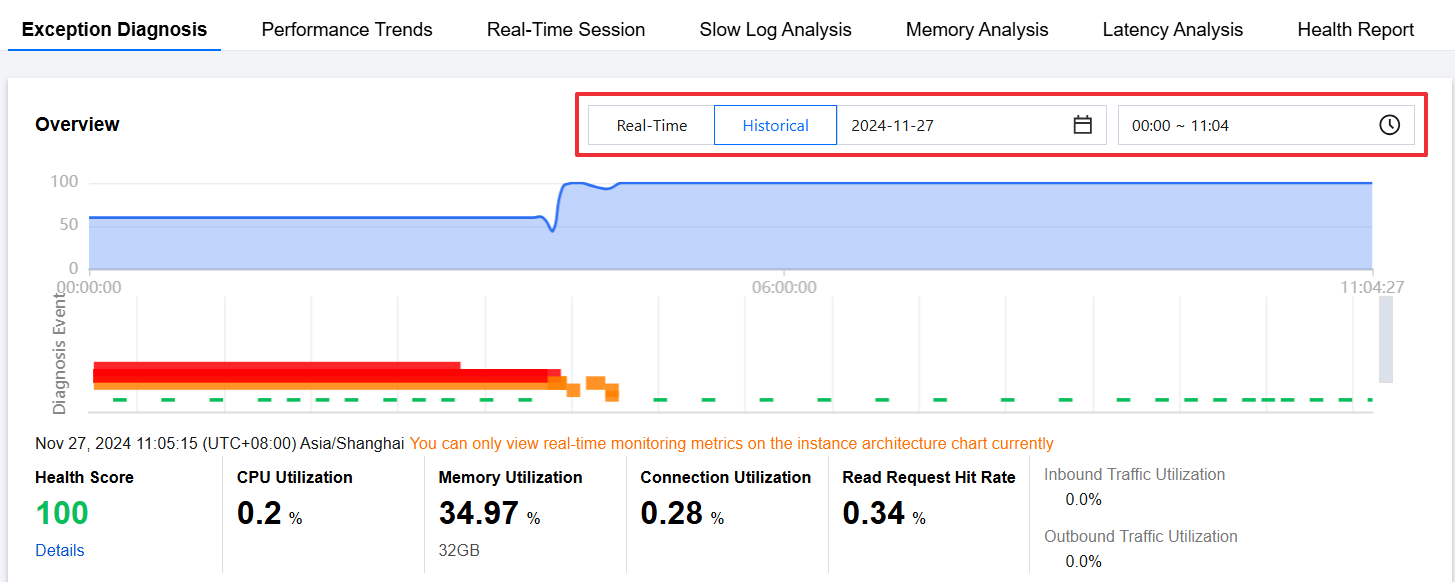
4. On the right side of the page, select to view real-time or historical diagnosis information.
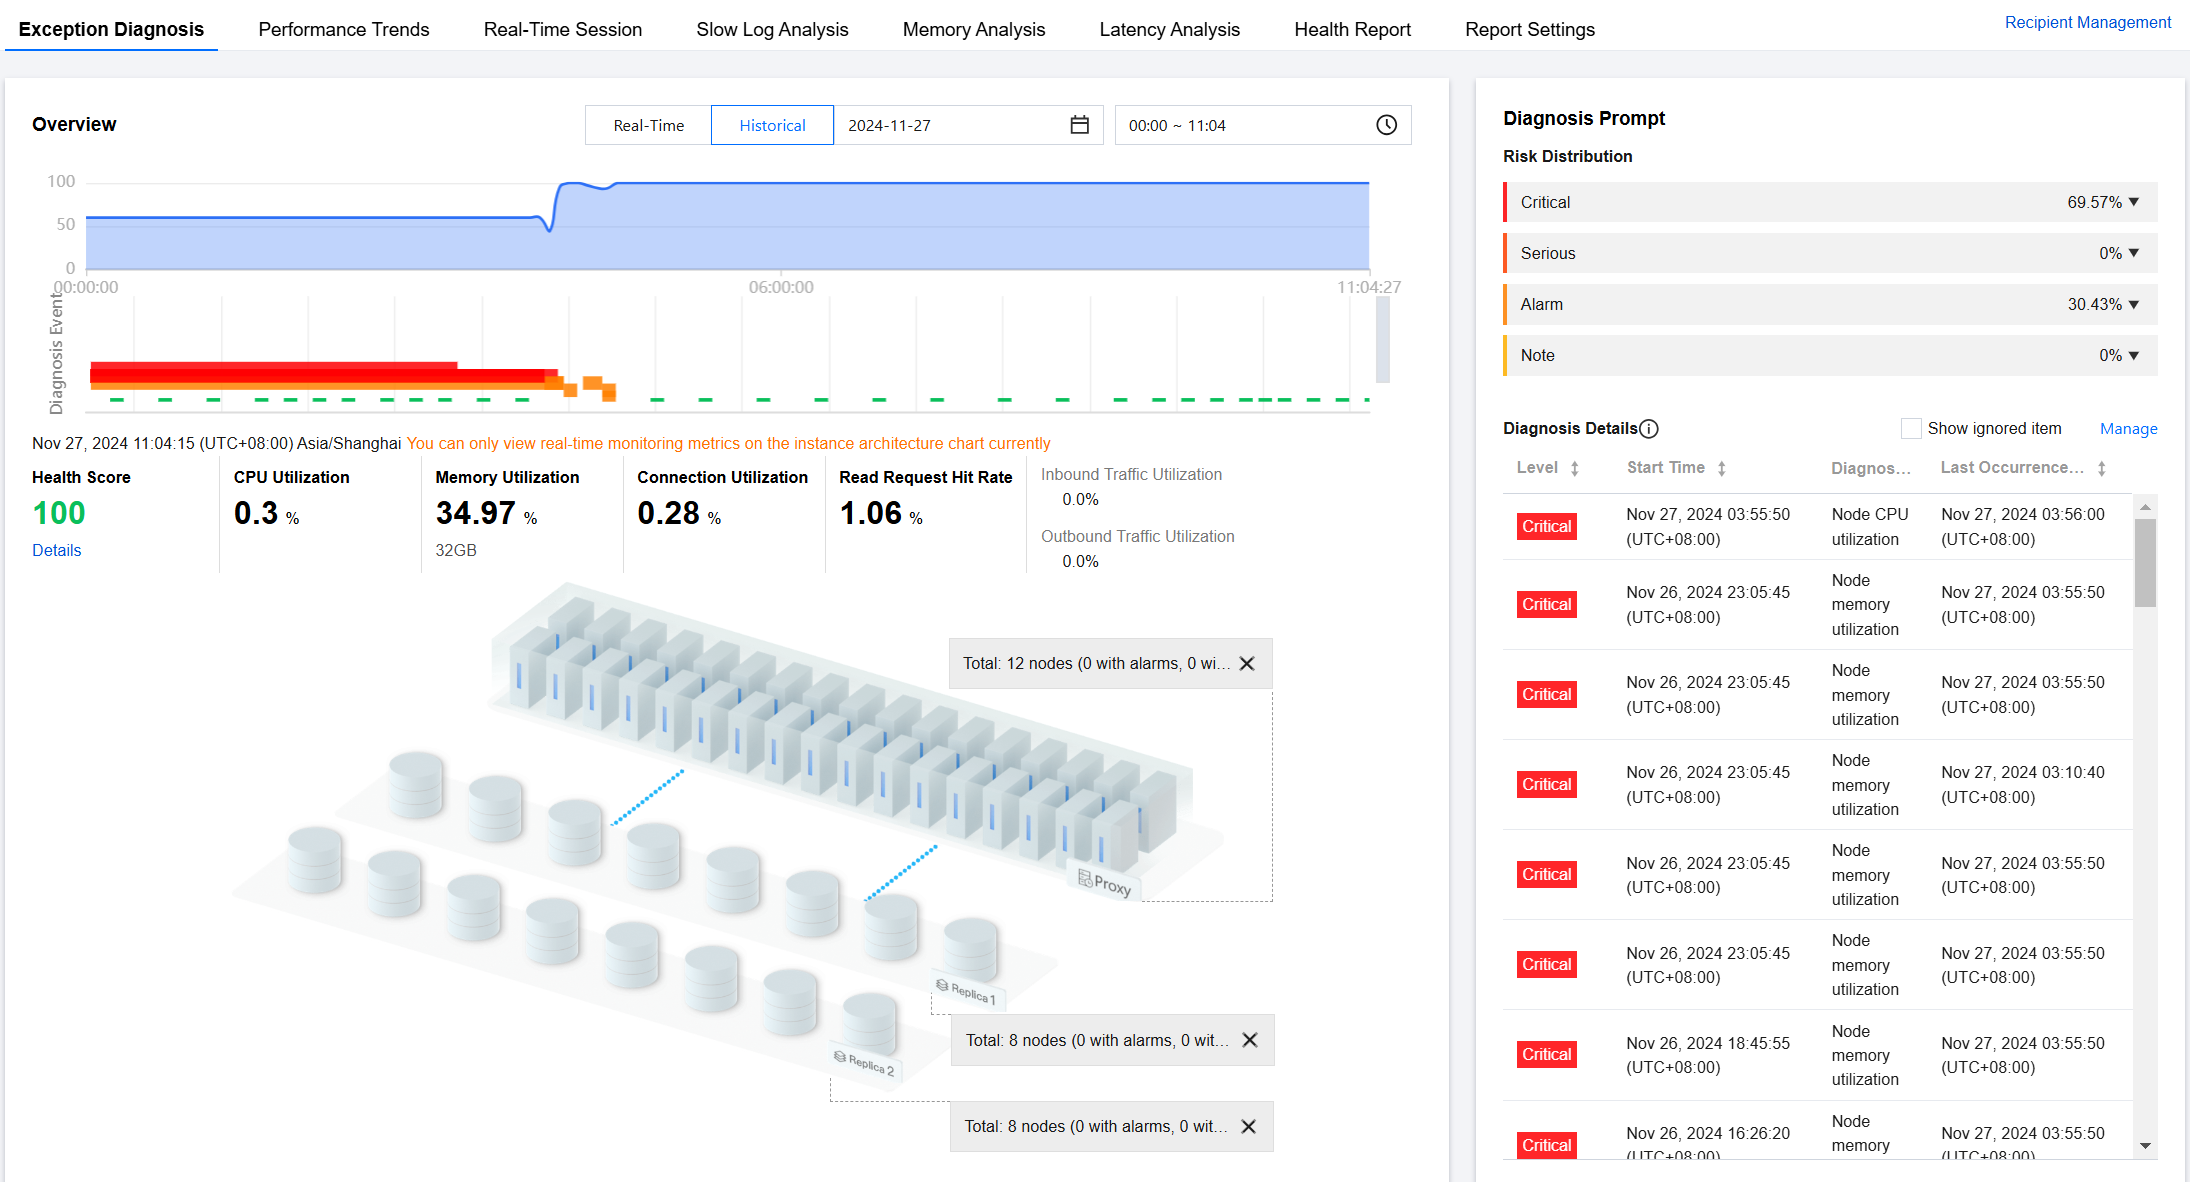
5. View the health score trend chart, diagnosed exception events, and instance architecture diagram within the selected time period.
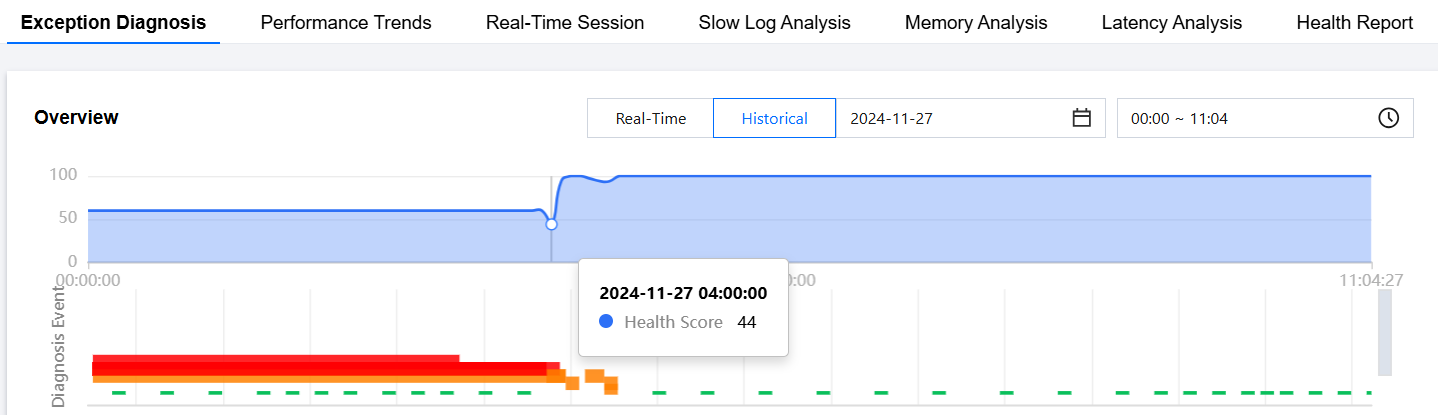
Viewing the health score trend chart
Click any time point on the trend chart to display the health score at that time point.
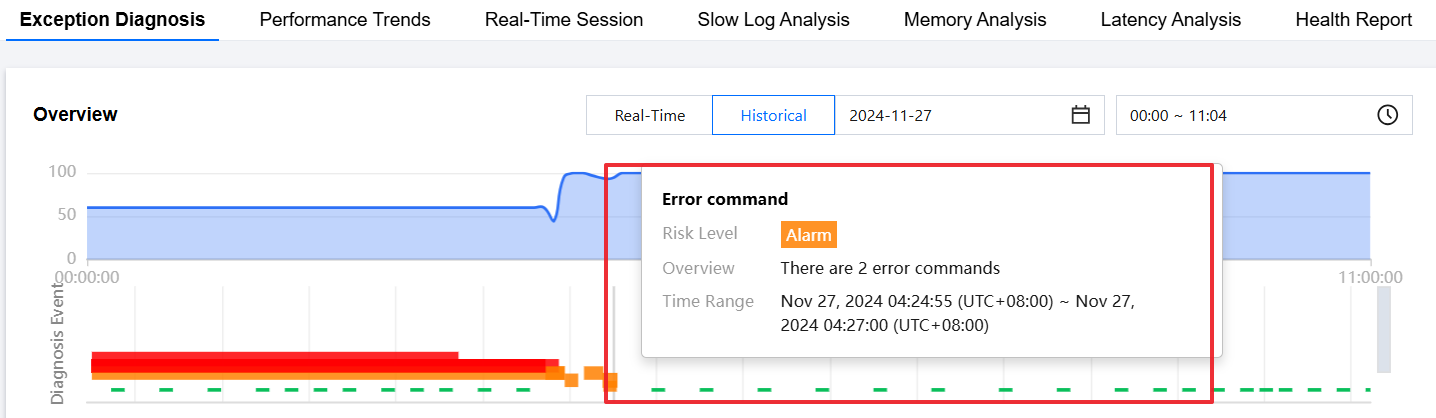
Viewing the diagnosis event bar chart
Hover the cursor over the diagnosis event bar chart to display information such as risk level, overview, and start/end time. Click the bar chart to go to the event details page to view information such as event details, description, intelligent analysis, and optimization suggestions. For more information about how to view event details, see Exception Alarms.
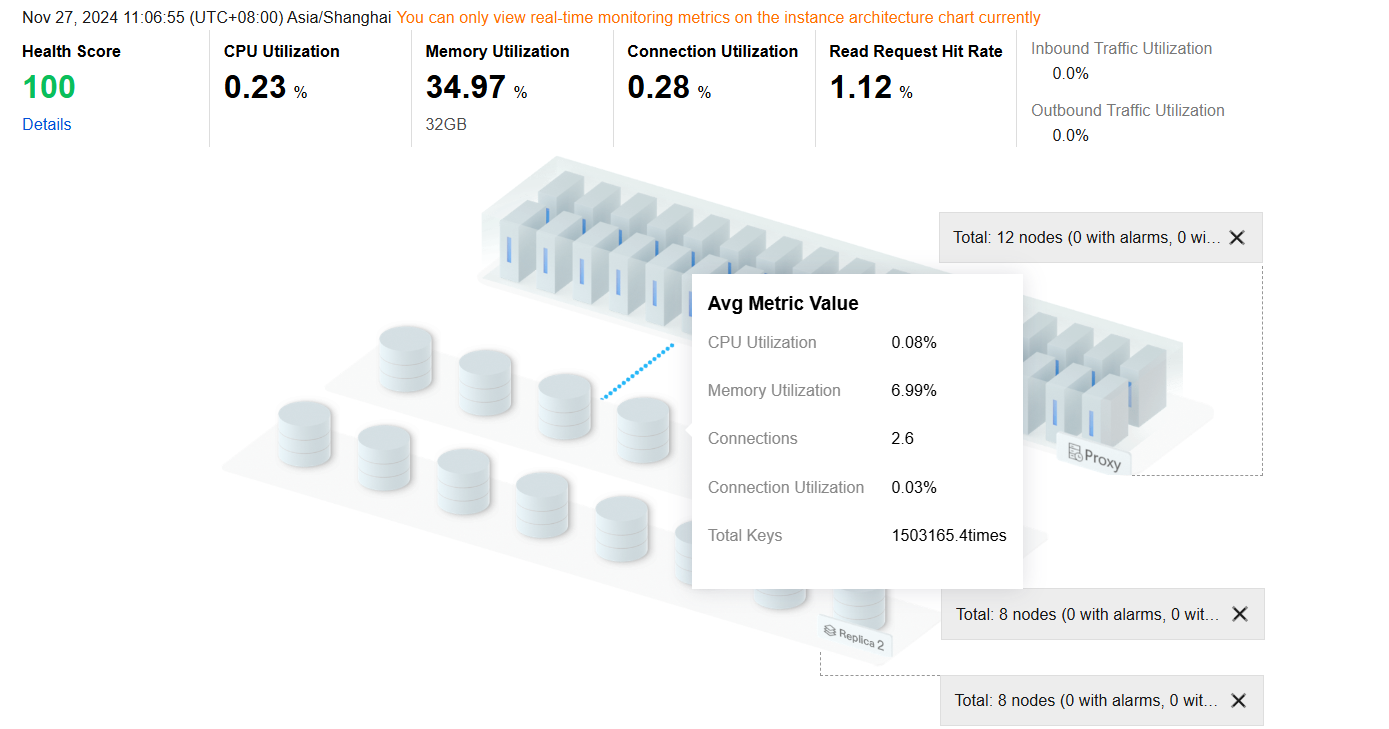
Viewing real-time data for health score and instance architecture diagram
Health score: Real-time data will be displayed for health score, CPU utilization, memory utilization, connection utilization, read request hit rate, inbound traffic utilization, and outbound traffic utilization.
You can click Details under the health score to go to the health report page and view the health score, score details, and health report.
Instance architecture diagram: displays the proxy and node architecture of the instance, including the location of nodes triggering alerts. Hover the cursor over a node or proxy to display the corresponding average metric values.
Viewing the Diagnostic Prompts
Diagnosis events are categorized into Healthy, Note, Alarm, Serious, and Critical levels. DBbrain performs regular health inspections on instances every 10 minutes.
1. Log in to the DBbrain console.
2. In the left sidebar, select Performance Optimization.
3. At the top of the page, select the database type and instance ID, and select the Exception Diagnosis tab.
4. On the right side of the page, select to view real-time or historical diagnosis information.
Real-time: Select Real-time to display the risk distribution and diagnosis details for the last three hours.
Historical: Select Historical to display the risk distribution and diagnosis details for the selected time period.
5. View the diagnostic prompts for the selected time range.
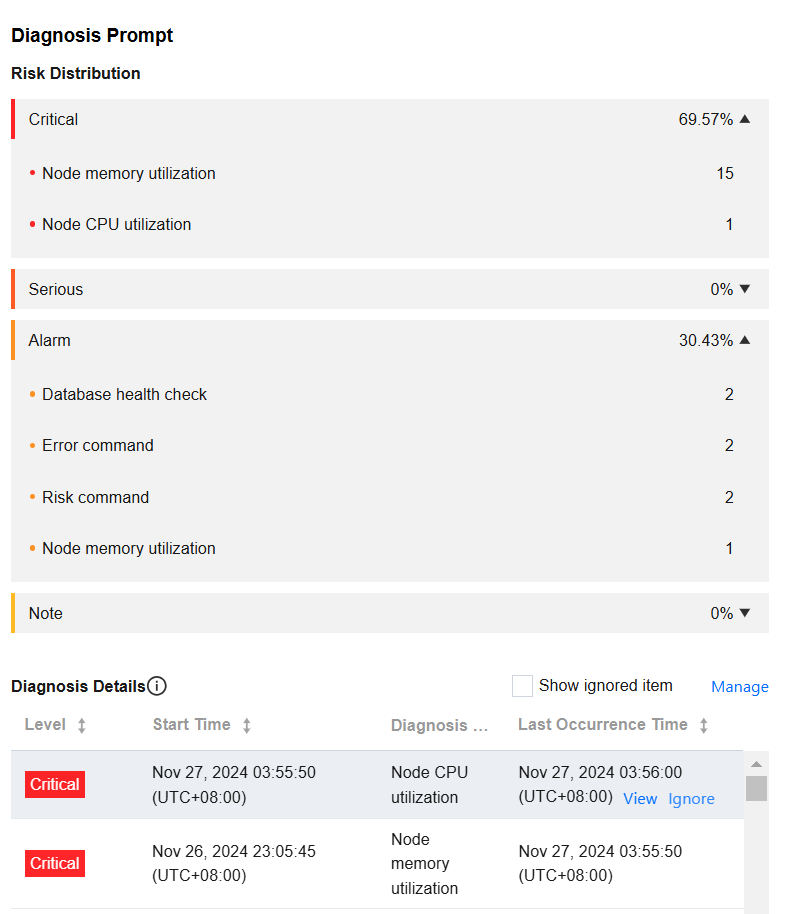
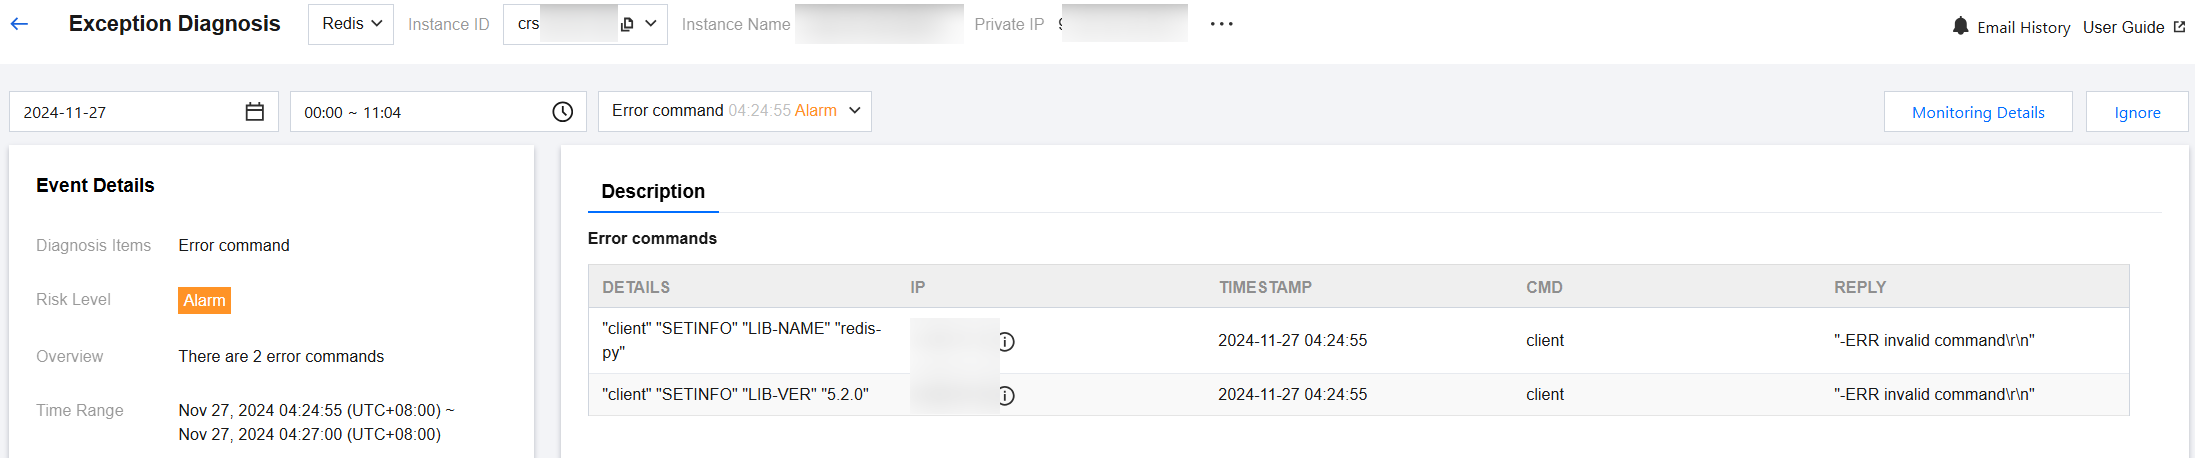
Viewing the diagnosis event details
In the Diagnosis Details section, click the row of a specific event alarm, or hover the cursor over the event alarm and click View to go to the event details page and view the event details.
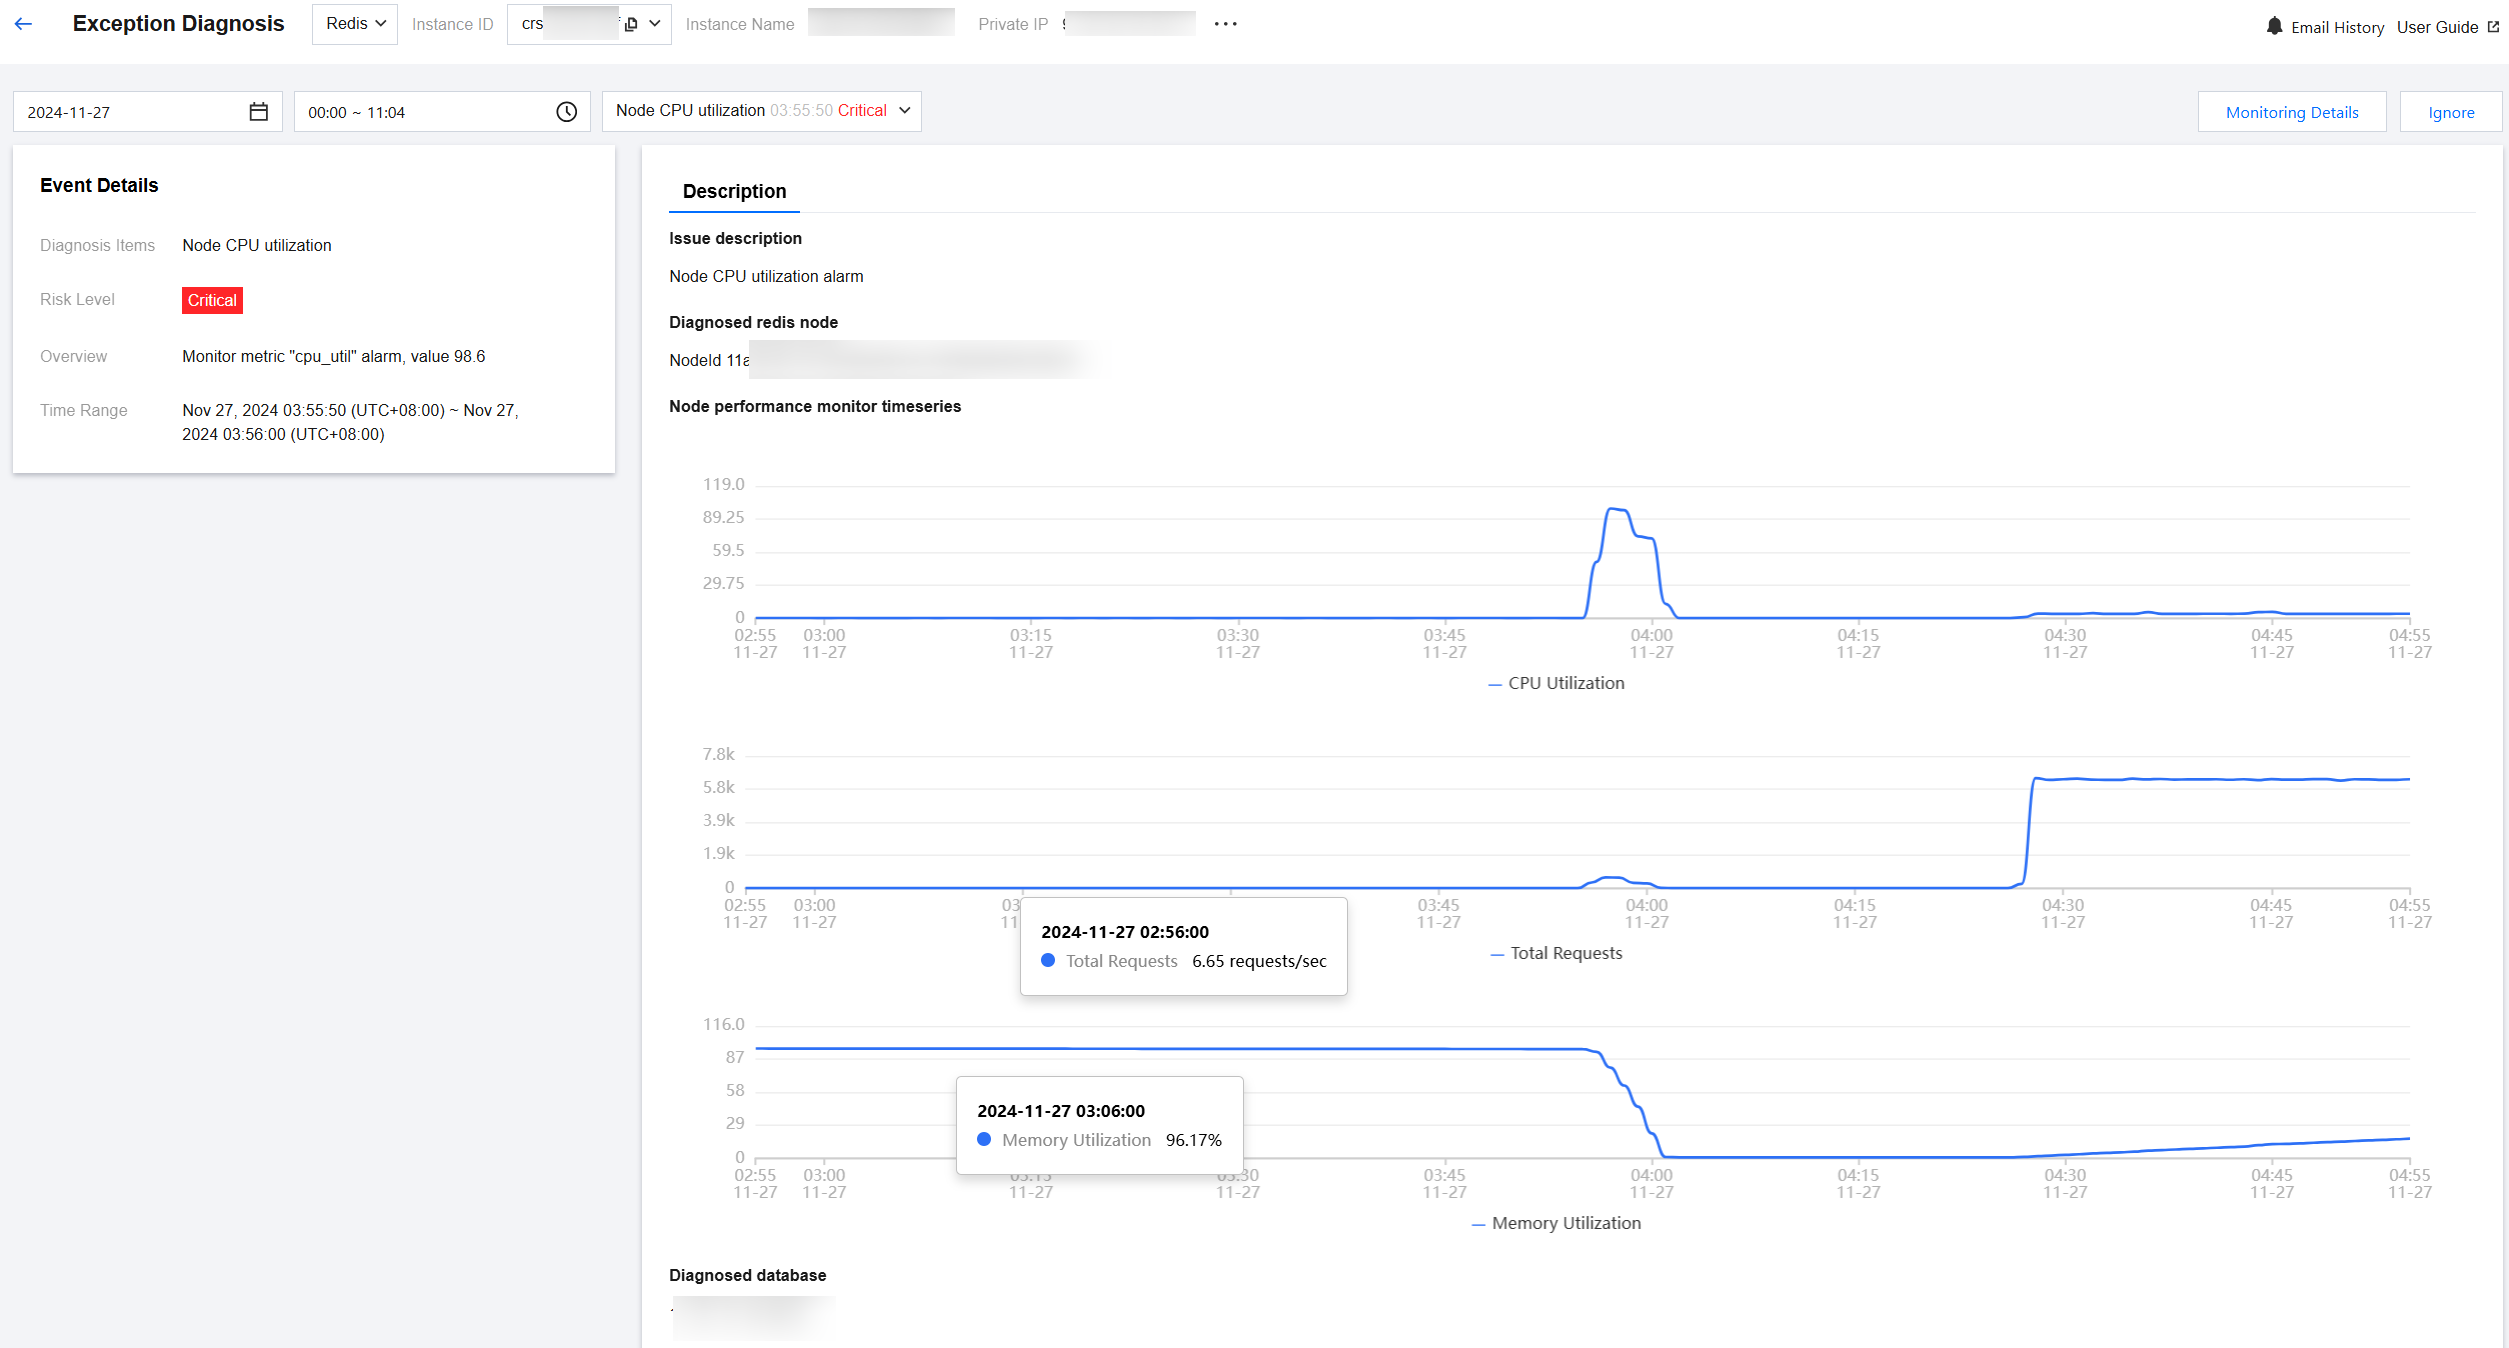
Event details mainly include event details, description, intelligent analysis, and optimization suggestions. The event details displayed vary depending on the diagnosis type. The details actually displayed shall prevail.
Event details: includes information such as diagnosis item, start/end time, risk level, and overview.
Description: includes information such as problem snapshots and performance trends of the exception or health inspection event.
Ignoring or unignoring an alarm
Note:
This feature is only applicable to exception alarms for which the diagnosis item is not Health Inspection.
In the Diagnosis Details section, hover the cursor over an event alarm, click Ignore, and select Ignore This Item or Ignore This Type, and then click OK.
Ignore This Item: ignores only this specific alarm.
Ignore This Type: ignores exception alarms caused by the same root cause.
Ignored diagnosis events will be displayed in gray.
To unignore, click Unignore and then click OK.
To display ignored alarms, select Show Ignored.
Click Ignore Management to view ignored content and ignored types.
You can go to the event details page and click Ignore or Unignore in the upper-right corner.
Detailed Description of Diagnosis Items
Diagnosis items are the objects for intelligent diagnosis. Their types include performance, availability, reliability, and maintainability. Each diagnosis item belongs to only one type.
Diagnosis Item Name | Diagnosis Item Type | Description | Risk level classification |
Node CPU utilization | Performance | Excessively high CPU utilization of a node | Critical: Node CPU utilization ≥ 95 Serious: 90 ≤ Node CPU utilization < 95 Alarm: 80 ≤ Node CPU utilization < 90 Note: 60 ≤ Node CPU utilization < 80 |
Node memory utilization | Performance | Excessive memory utilization of a node | Critical: Node memory utilization ≥ 95 Serious: 90 ≤ Node memory utilization < 95 Alarm: 80 ≤ Node memory utilization < 90 Note: 60 ≤ Node memory utilization < 80 |
Node connection utilization | Performance | Excessive connection utilization of a node | Critical: Node connection utilization ≥ 95 Serious: 90 ≤ Node connection utilization < 95 Alarm: 80 ≤ Node connection utilization < 90 Note: 60 ≤ Node connection utilization < 80 |
Proxy connection utilization | Performance | Excessive connection utilization of a proxy | Critical: Proxy connection utilization ≥ 95 Serious: 90 ≤ Proxy connection utilization < 95 Alarm: 80 ≤ Proxy connection utilization < 90 Note: 60 ≤ Proxy connection utilization < 80 |
Proxy inbound traffic usage | Performance | Excessive inbound traffic usage of a proxy | Critical: Proxy inbound traffic usage ≥ 1536 Serious: 1228.8 ≤ Proxy inbound traffic usage < 1536 Alarm: 1024 ≤ Proxy inbound traffic usage < 1228.8 Note: 800 ≤ Proxy inbound traffic usage < 1024 |
Proxy outbound traffic usage | Performance | Excessive outbound traffic usage of a proxy | Critical: Proxy outbound traffic usage ≥ 1536 Serious: 1228.8 ≤ Proxy outbound traffic usage < 1536 Alarm: 1024 ≤ Proxy outbound traffic usage < 1228.8 Note: 800 ≤ Proxy outbound traffic usage < 1024 |
Proxy inbound traffic throttling | Performance | Proxy inbound traffic throttling | Critical |
Proxy outbound traffic throttling | Performance | Proxy outbound traffic throttling | Critical |
Incorrect commands | Maintainability | Existence of incorrect commands | Alarm |
High-risk commands | Maintainability | Existence of high-risk commands | Alarm |
Connectivity check | Availability | Database connection exception: The database instance cannot be connected | Critical |
フィードバック