With DBbrain's space analysis feature, you can view the instance space utilization, including the sizes of data and logs, the daily increase in space utilization, the estimated number of available days, and the space used by the tables and databases of the instance.
Disk space
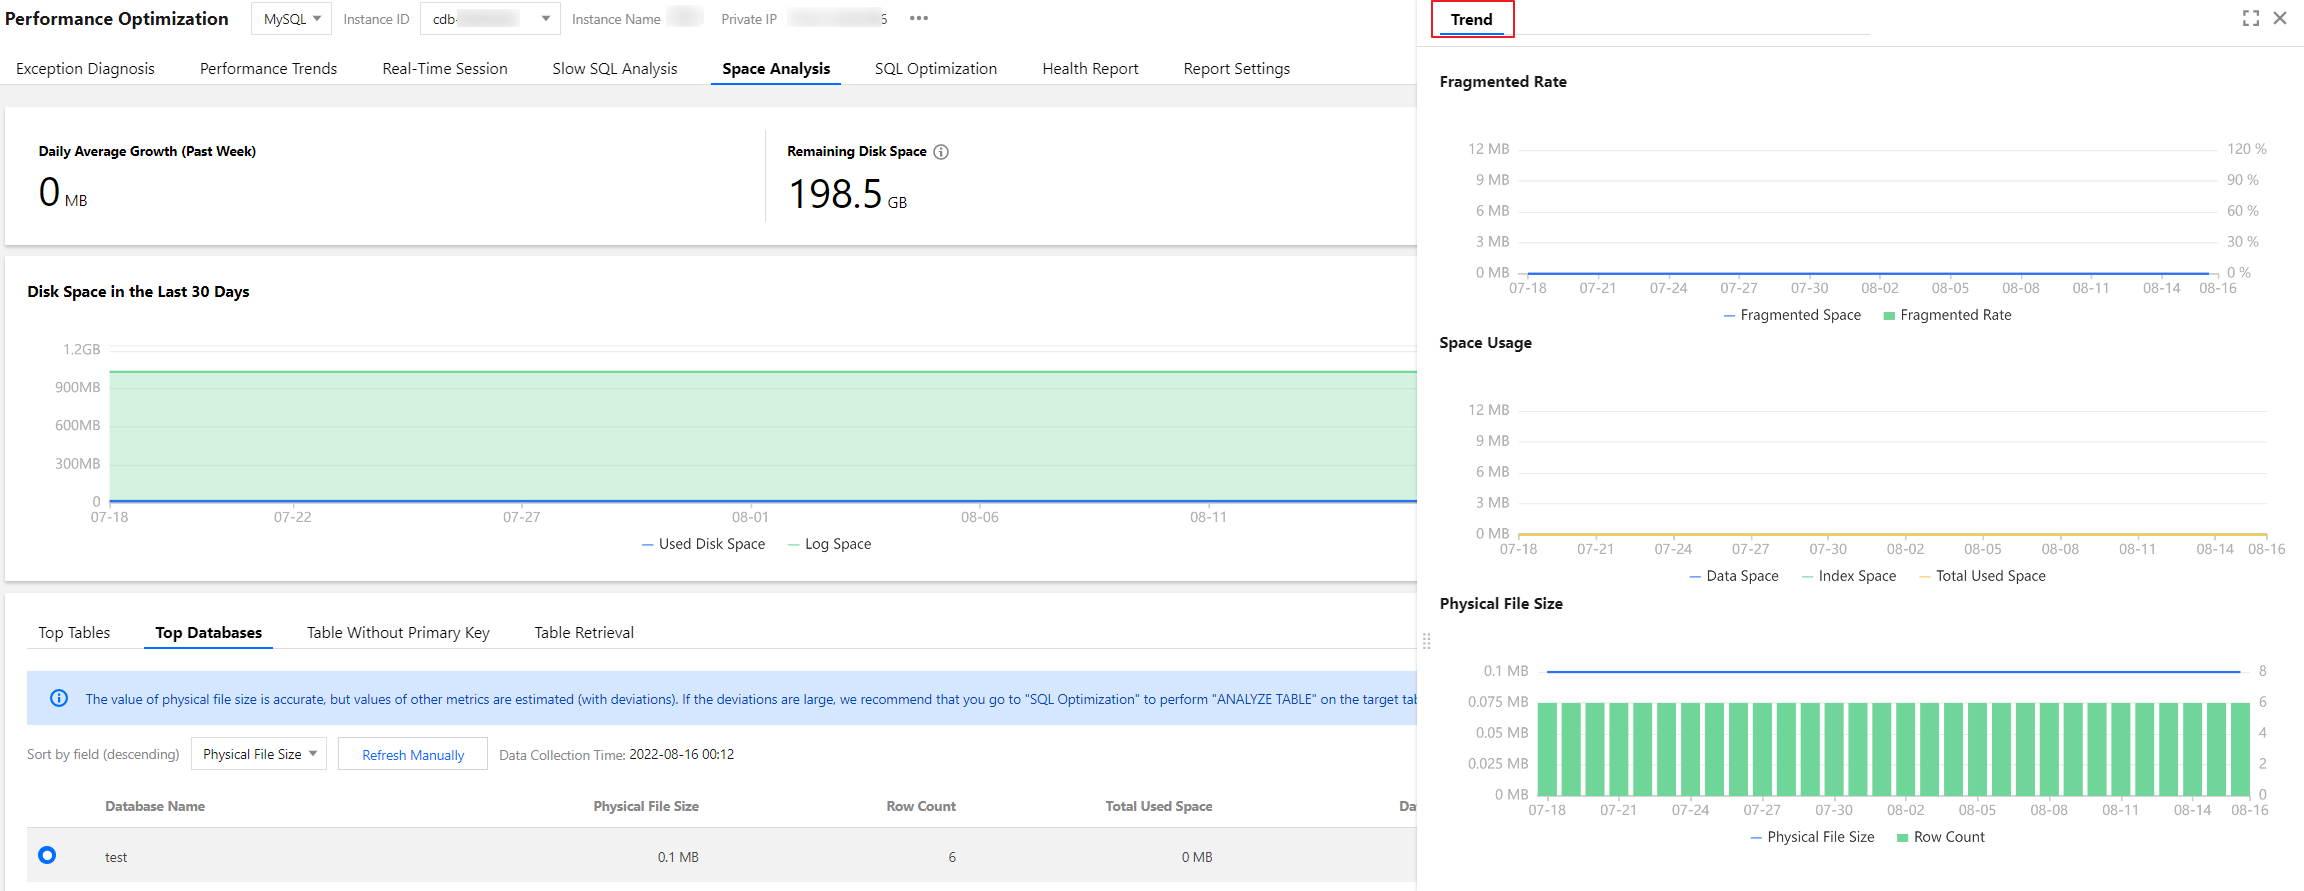
Log in to the DBbrain console and select Performance Optimization on the left sidebar. On the displayed page, select a database type and an instance at the top, and select the Space Analysis tab.
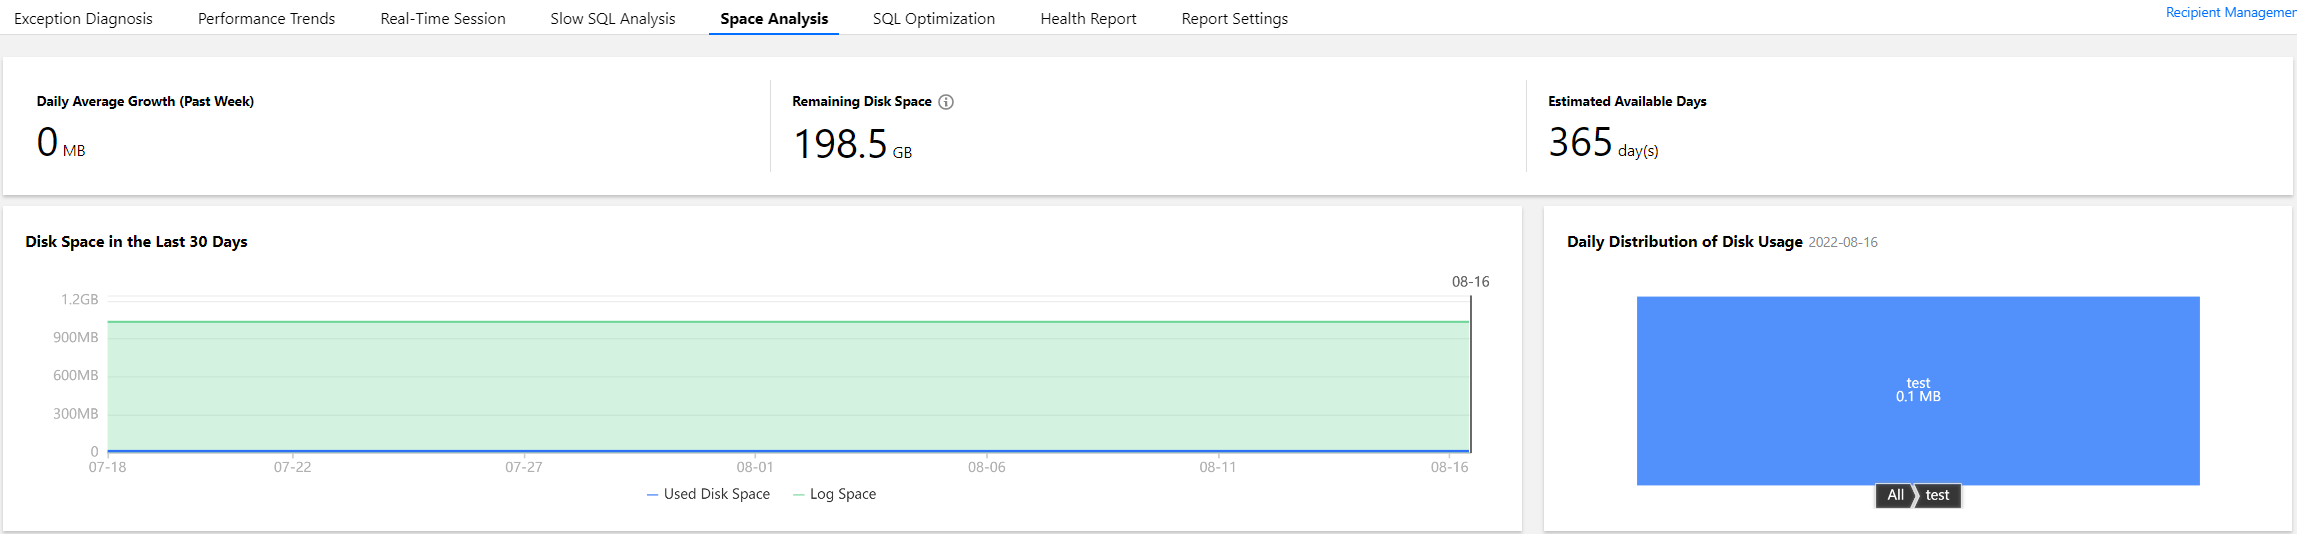
On the Space Analysis tab, you can view the daily average growth in the past week, remaining disk space, estimated available days, daily distribution of disk usage, and disk space trend in the last 30 days.
For TencentDB for MySQL, the remaining disk space = purchased disk space - data space.
For TDSQL-C for MySQL, the remaining storage space = maximum storage space - data space.
For self-built MySQL, the remaining disk space = disk space - data space.
For TencentDB for MongoDB, the remaining disk space = maximum storage space - data space.
Top tablespace
Note:
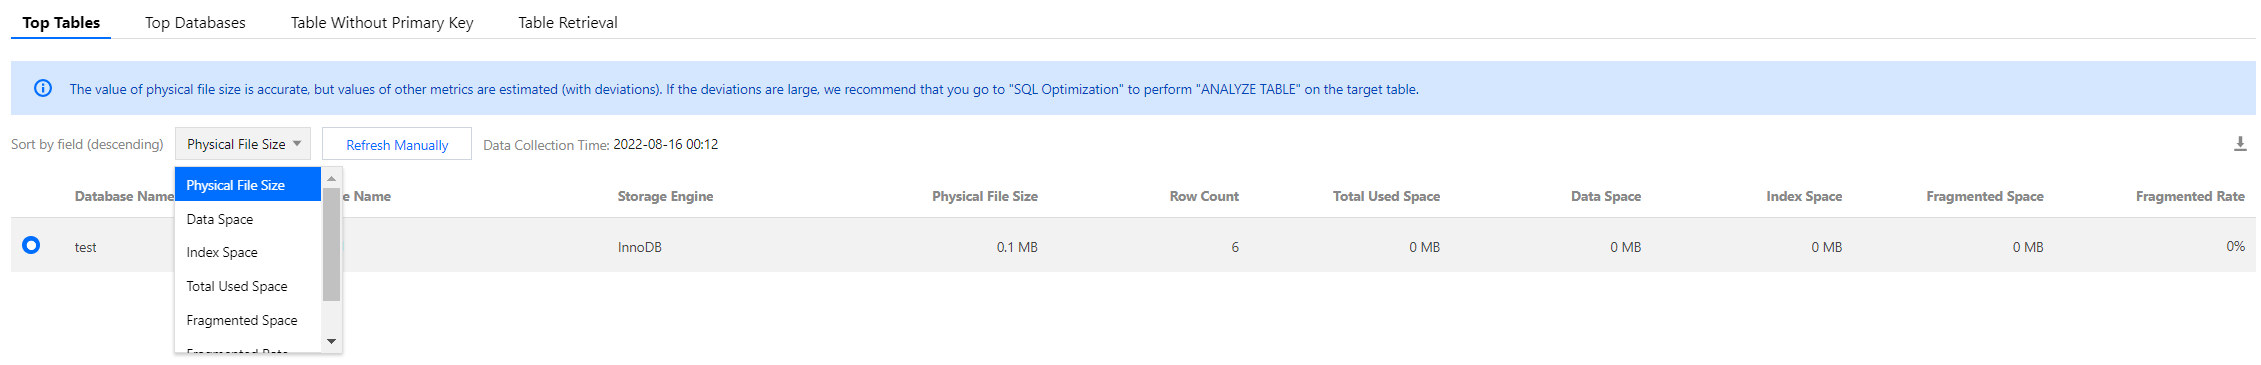
You can manually refresh the top tables/databases data. Data is collected once a day by default. When the information is inaccurate due to the large gap between the data collection time and the current time, you can click Refresh Manually to collect and analyze the real-time data of top tables/databases. Note that there may be a slight delay when the instance has many databases and tables or when the access pressure is high.
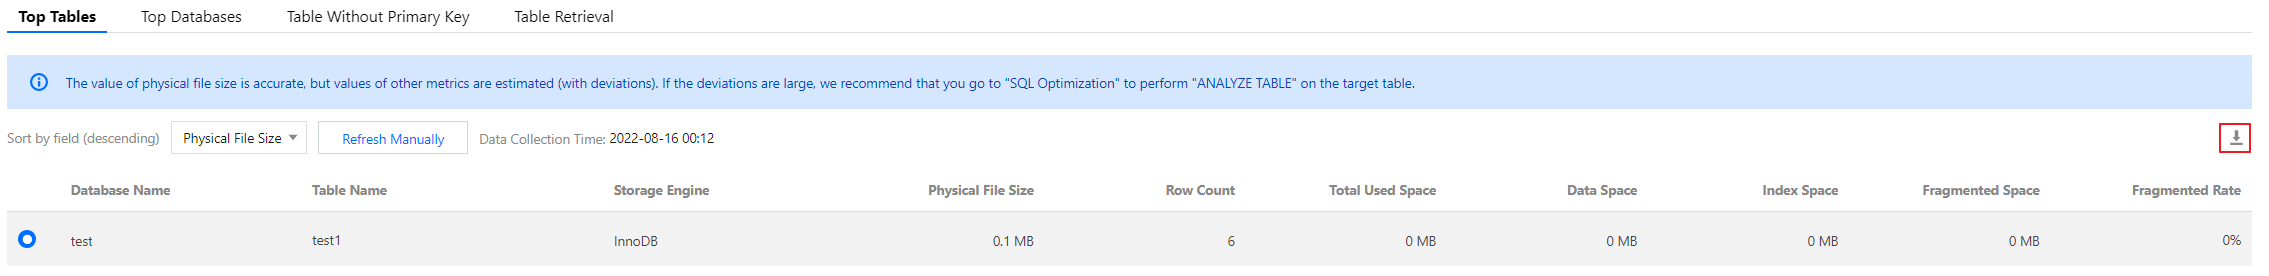
The Top Tablespace section shows the details of the tables that have relatively high space usage. The table list in the section contains columns such as Storage Engine, Physical File Size, Row Count, Total Used Space, Data Space, Index Space, Fragmented Space, and Fragmented Rate. Each column of data can be sorted in descending order, and the real-time data can be refreshed manually. You can view the disk space usage details in this section and perform optimization promptly.
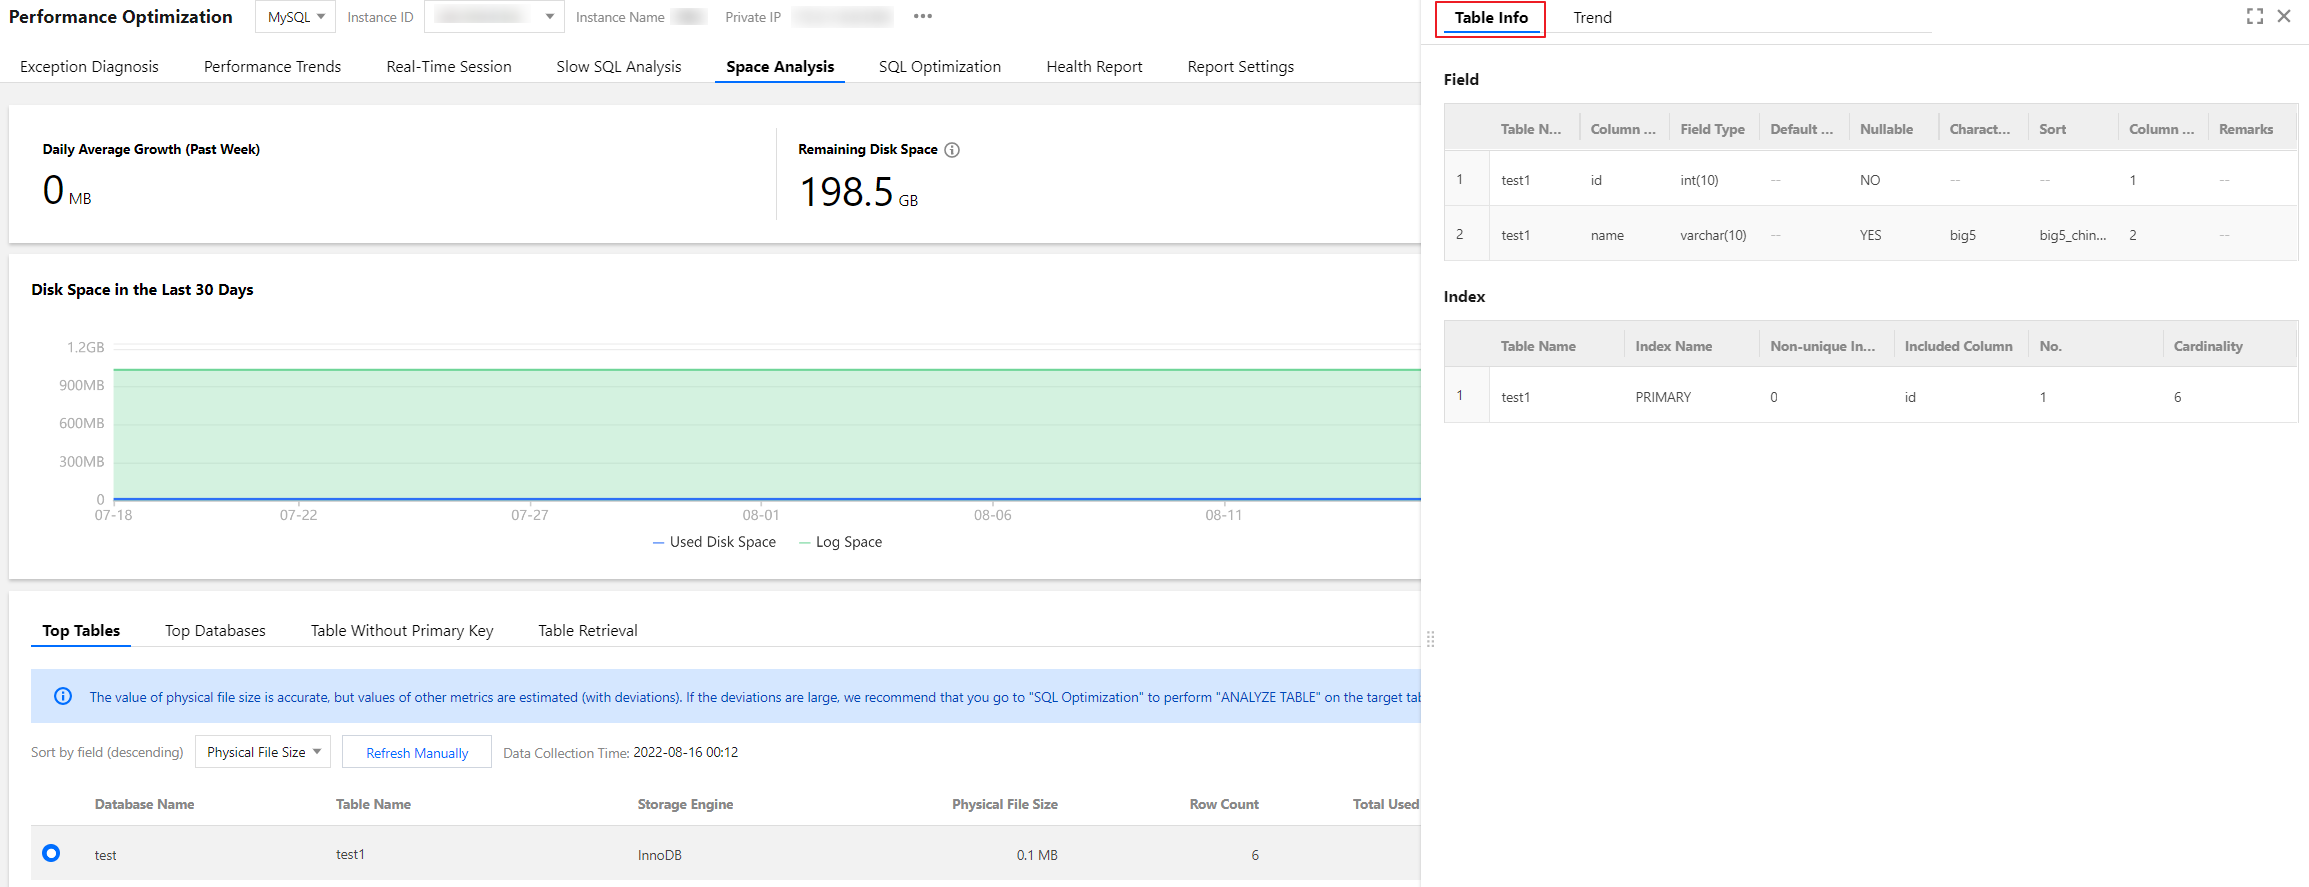
The Top Tables section displays data by table. In the table list, you can click the row of a table to view its field and index information. The field information includes the Table Name, Column Name, Field Type, Default Value, Nullable, Character Set, Sort, Column Position, and Remarks. The index information includes the Table Name, Index Name, Unique Index, Included Column, No., and Cardinality.
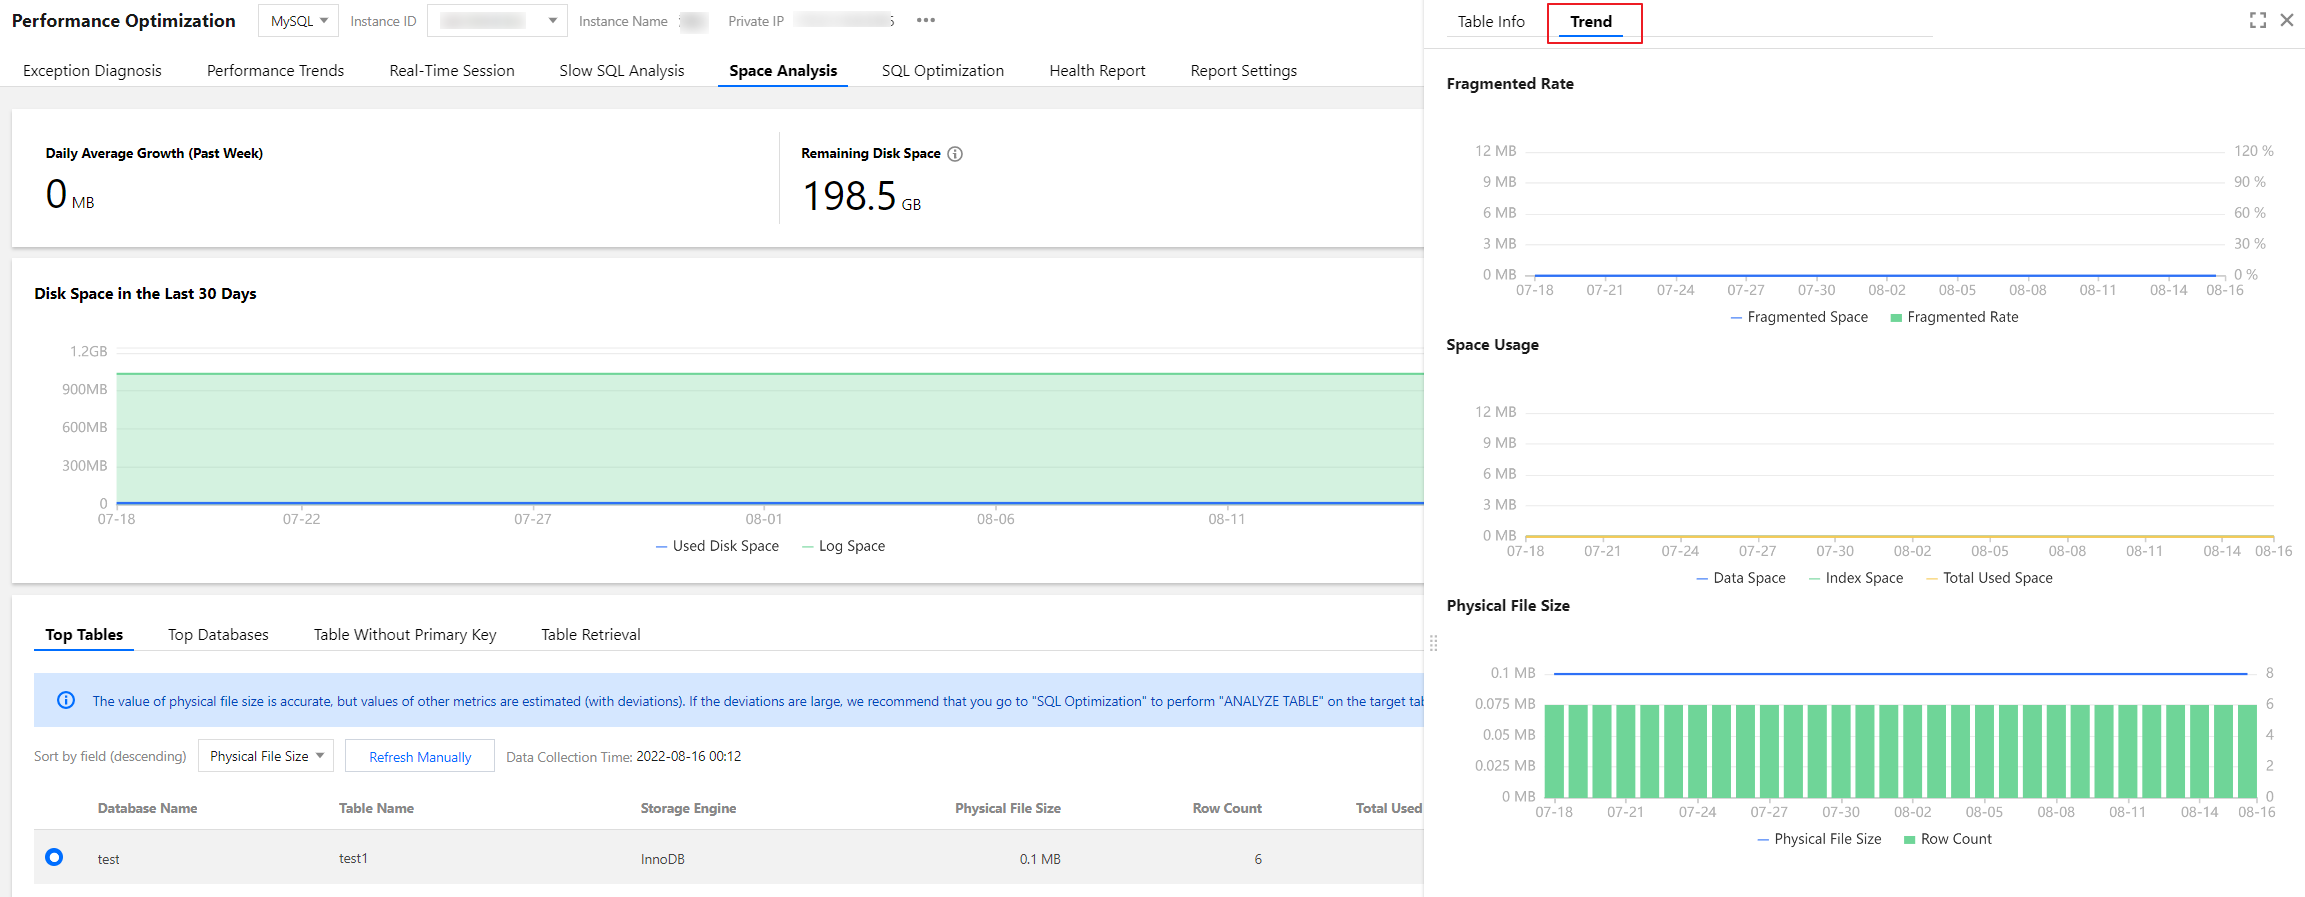
In the table list, click the row of a table to view the space usage trend, including the trends of the Physical File Size, Space Usage (Data Space, Index Space, and Total Used Space), and Fragmented Rate.
Click the download icon in the top-right corner to download the data of top tables in CSV format.
Top databases
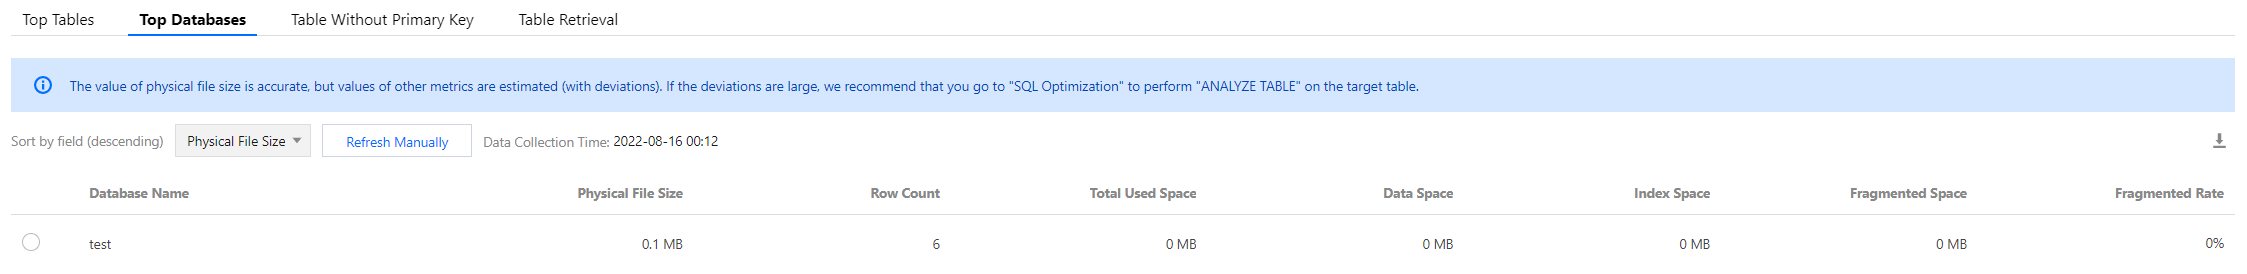
The Top Databases section shows the details of the databases that have relatively high space usage. The database list in the section contains columns such as the Physical File Size, Row Count, Total Used Space, Data Space, Index Space, Fragmented Space, and Fragmented Rate. Each column of data can be sorted in descending order. You can view the disk space usage details in this section and perform optimization promptly.
The Top Databases section displays data by database. In the database list, click the row of a database to view the space usage trend, including the trends of the Physical File Size, Space Usage (Data Space, Index Space, and Total Used Space), and Fragmented Rate.
Click the download icon in the top-right corner to download the data of top databases in CSV format.
Tables without a primary key
The Table Without Primary Key section displays the information of tables that lack a primary key in the current instance. Such tables have potential risks and will affect the instance's read/write performance, sync efficiency, etc. We recommend you process them timely and add primary keys suitable for your business scenario.
The list of tables without a primary key supports two refreshing methods: regular scan (once per day) and manual refresh. You can click a table in the list to view its field and index information.
Click the download icon in the top-right corner to download the data of tables without a primary key in CSV format.