The slow SQL analysis feature calculates, samples, and aggregates records and execution information (source information, number of executions, execution duration, result set, scan set, etc.) of slow SQL statements in the instance. This feature analyzes the performance of slow SQL statements based on the execution plan, comprehensive resource usage, sizes of scan and result sets, and index usage rationality of the aggregated SQL statements and provides optimization suggestions.
Note:
Before you use slow log analysis for self-built databases accessed through the Agent, you need to check whether slow log collection is enabled at https://console.tencentcloud.com/dbbrain/instance?product=dbbrain-mysql.
Self-built database instances that access the service directly do not support slow log analysis.
Viewing slow SQL analysis
1. Log in to the DBbrain console and select Performance Optimization on the left sidebar. On the displayed page, select a database type and an instance at the top, and select the Slow SQL Analysis tab.
Note:
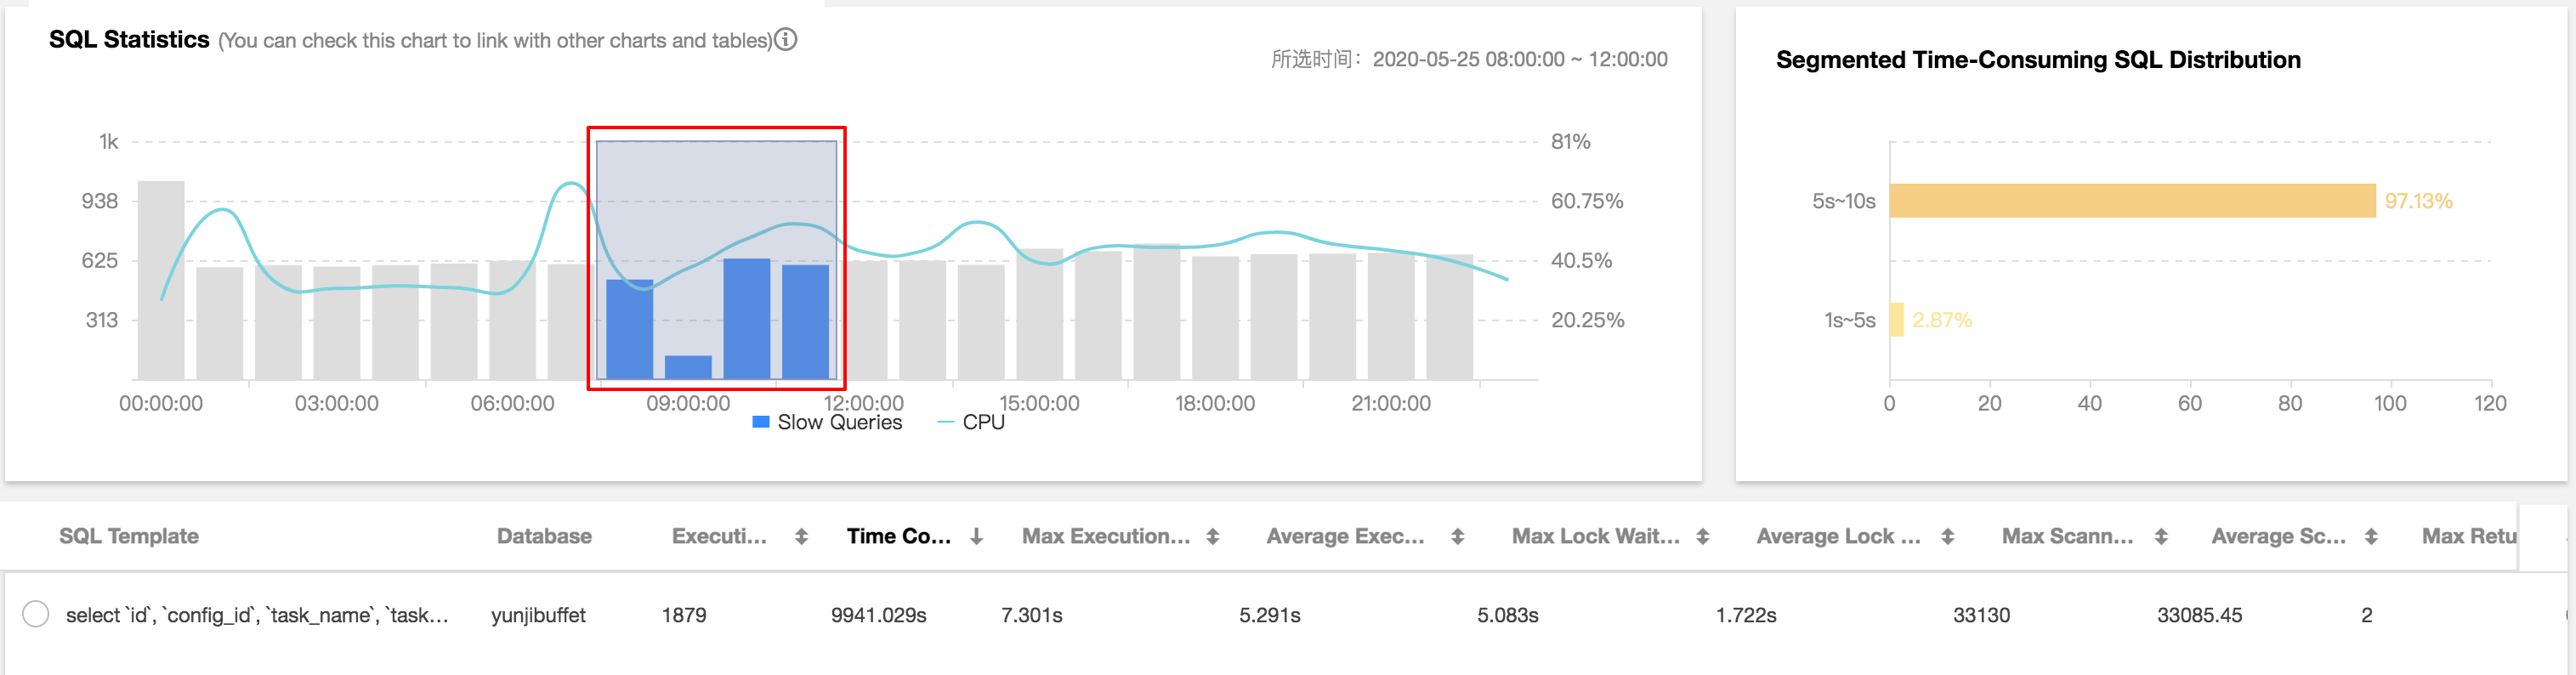
The SQL Statistics section displays the number of slow queries and CPU utilization of the instance. You can adjust the time range to view slow SQL statements. If the instance has slow SQL statements, the quantity and occurrence points in time will be displayed in the view.
2. You can click a single time range or drag to select multiple time ranges for slow queries in the SQL Statistics section, and the aggregated SQL template and execution information (including the number of executions, total execution duration, scanned rows, and returned rows) will be displayed below. Each column of data can be sorted in ascending or descending order. The consumed time distribution section on the right displays the overall consumed time distribution of SQL statements in the selected time range.
You can quickly set the time dimension for statistics collection to Last 5 minutes, Last 10 minutes, Last hour, Last 3 hours, Last 24 hours, or Last 3 days.
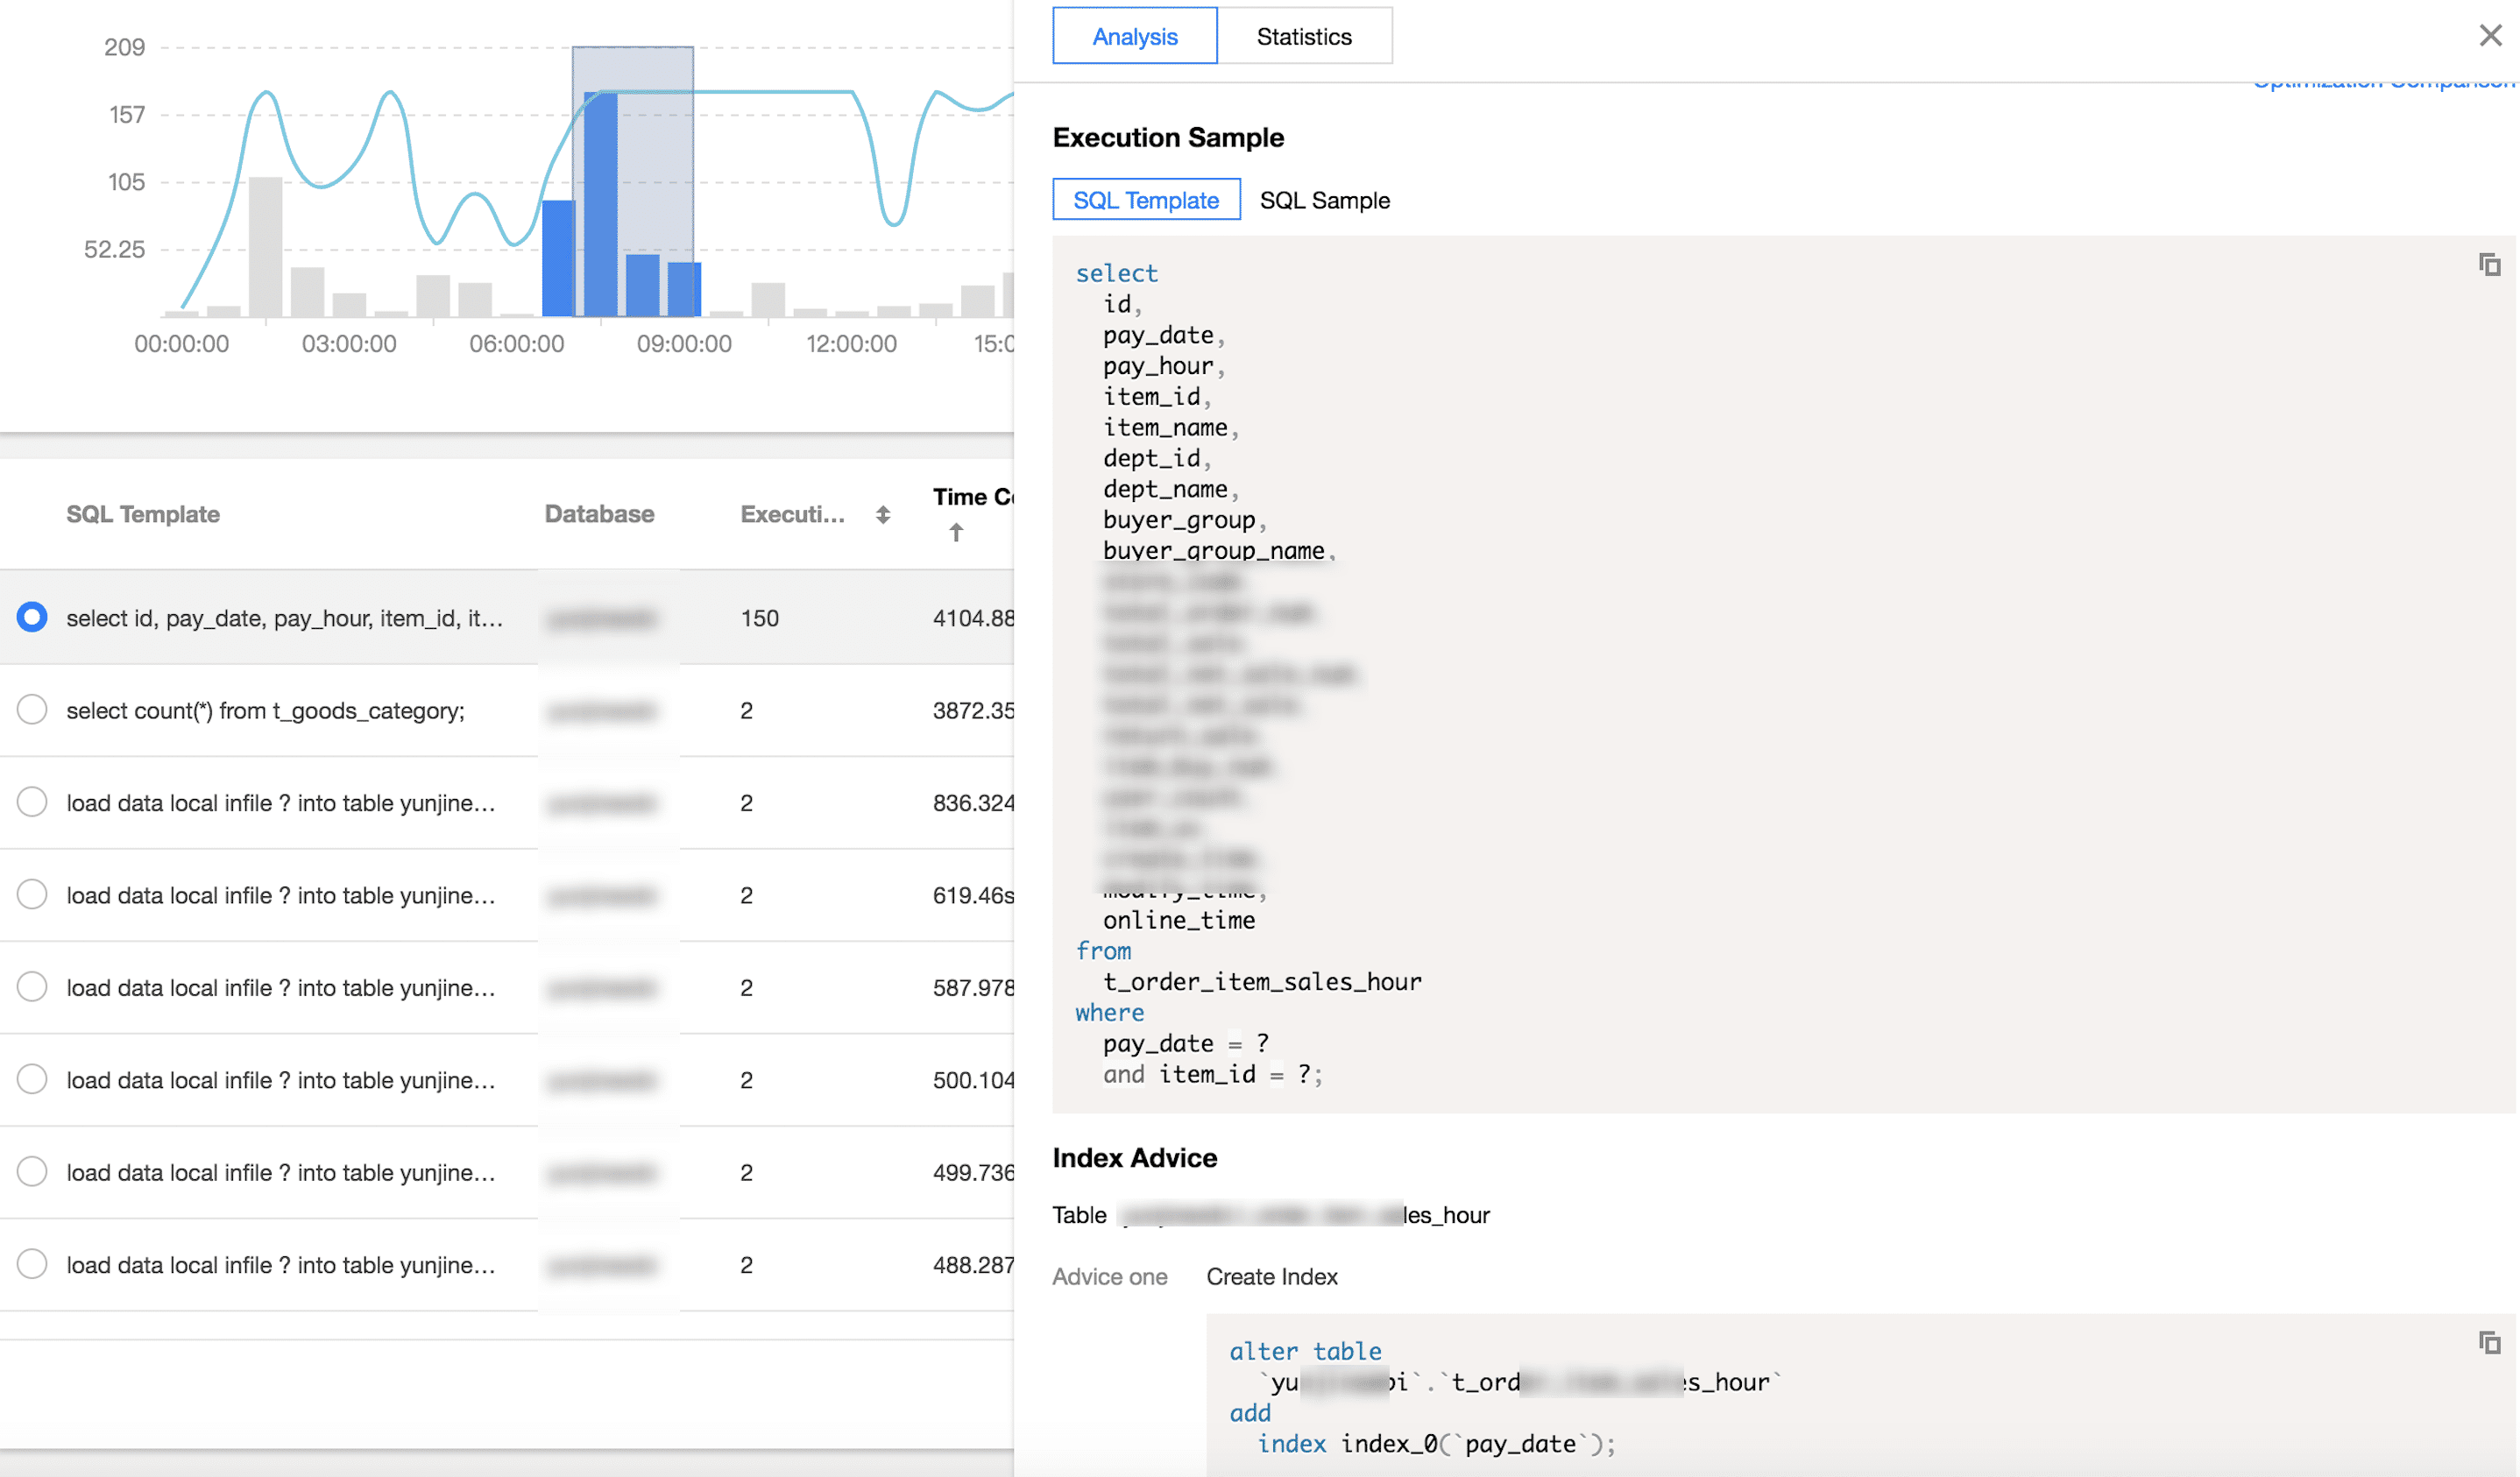
3. Click an aggregated SQL template in the SQL Template column as shown in the red box above, and specific SQL analysis and statistics will be displayed on the right.
On the Analysis tab, you can view the complete SQL template, SQL sample, optimization suggestion, and description. You can optimize your SQL statement based on the expert suggestions provided by DBbrain to improve the statement quality and reduce the delay.
The Analysis > Execution Plan tab provides the visual analysis result. The visual chart can be zoomed in or out or displayed in full screen mode. Click a number or icon in the chart to view further details.
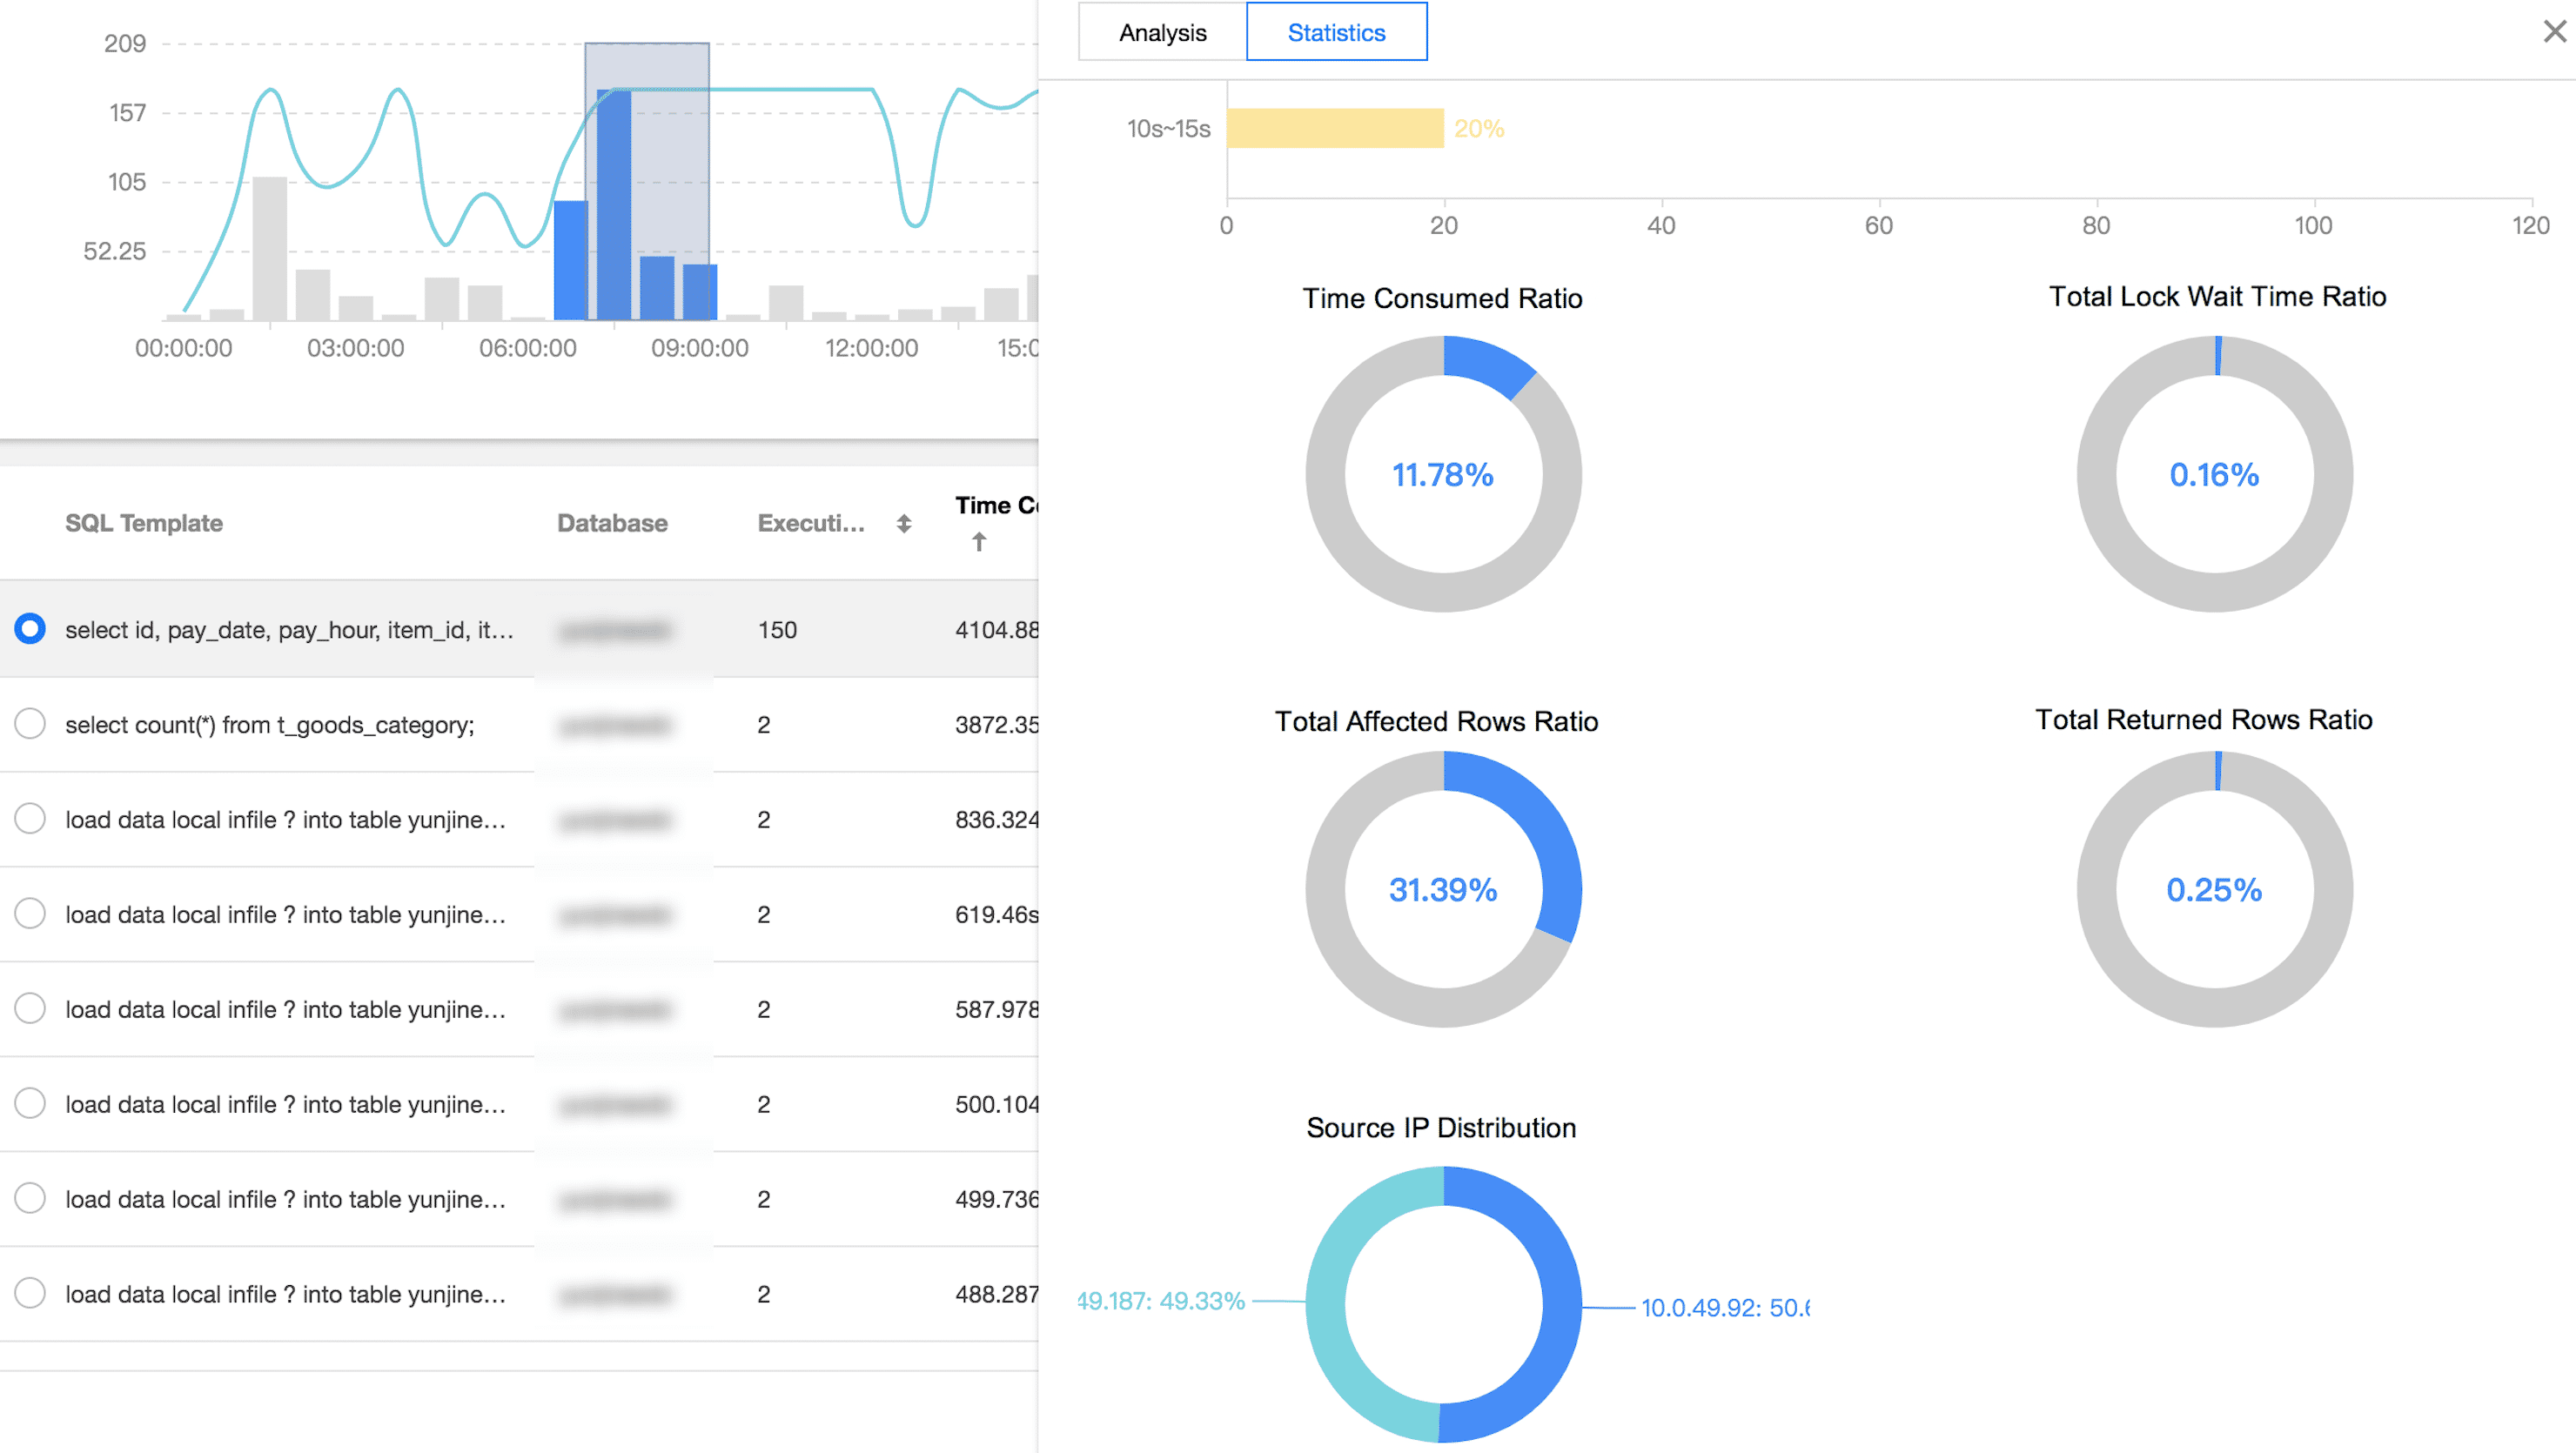
On the Statistics tab, you can perform cross-sectional analysis on the root cause of a slow SQL statement based on the total lock wait time ratio, total affected rows ratio, and total returned rows ratio in the statistics report, and then optimize the statement accordingly. You can also view the execution duration distribution of the specified type of aggregated SQL statements and the proportions of access source IPs.
On the Details tab, you can view the SQL execution details.
4. Export the slow SQL data.
Click Export on the right of the SQL list to export the data of slow SQL analysis in CSV format for easier viewing.