This document introduces how to view the health report. The health report includes sections such as Introduction, Basic Information, Health, Instance Status, Exception Diagnosis, Slow SQL Analysis, Database Account Suggestions, Top Table Space, and Performance Curve.
2. Select Performance Optimization > Health Report in the left sidebar.
3. At the top of the page, select the database type, and then select the instance ID or the shard ID.
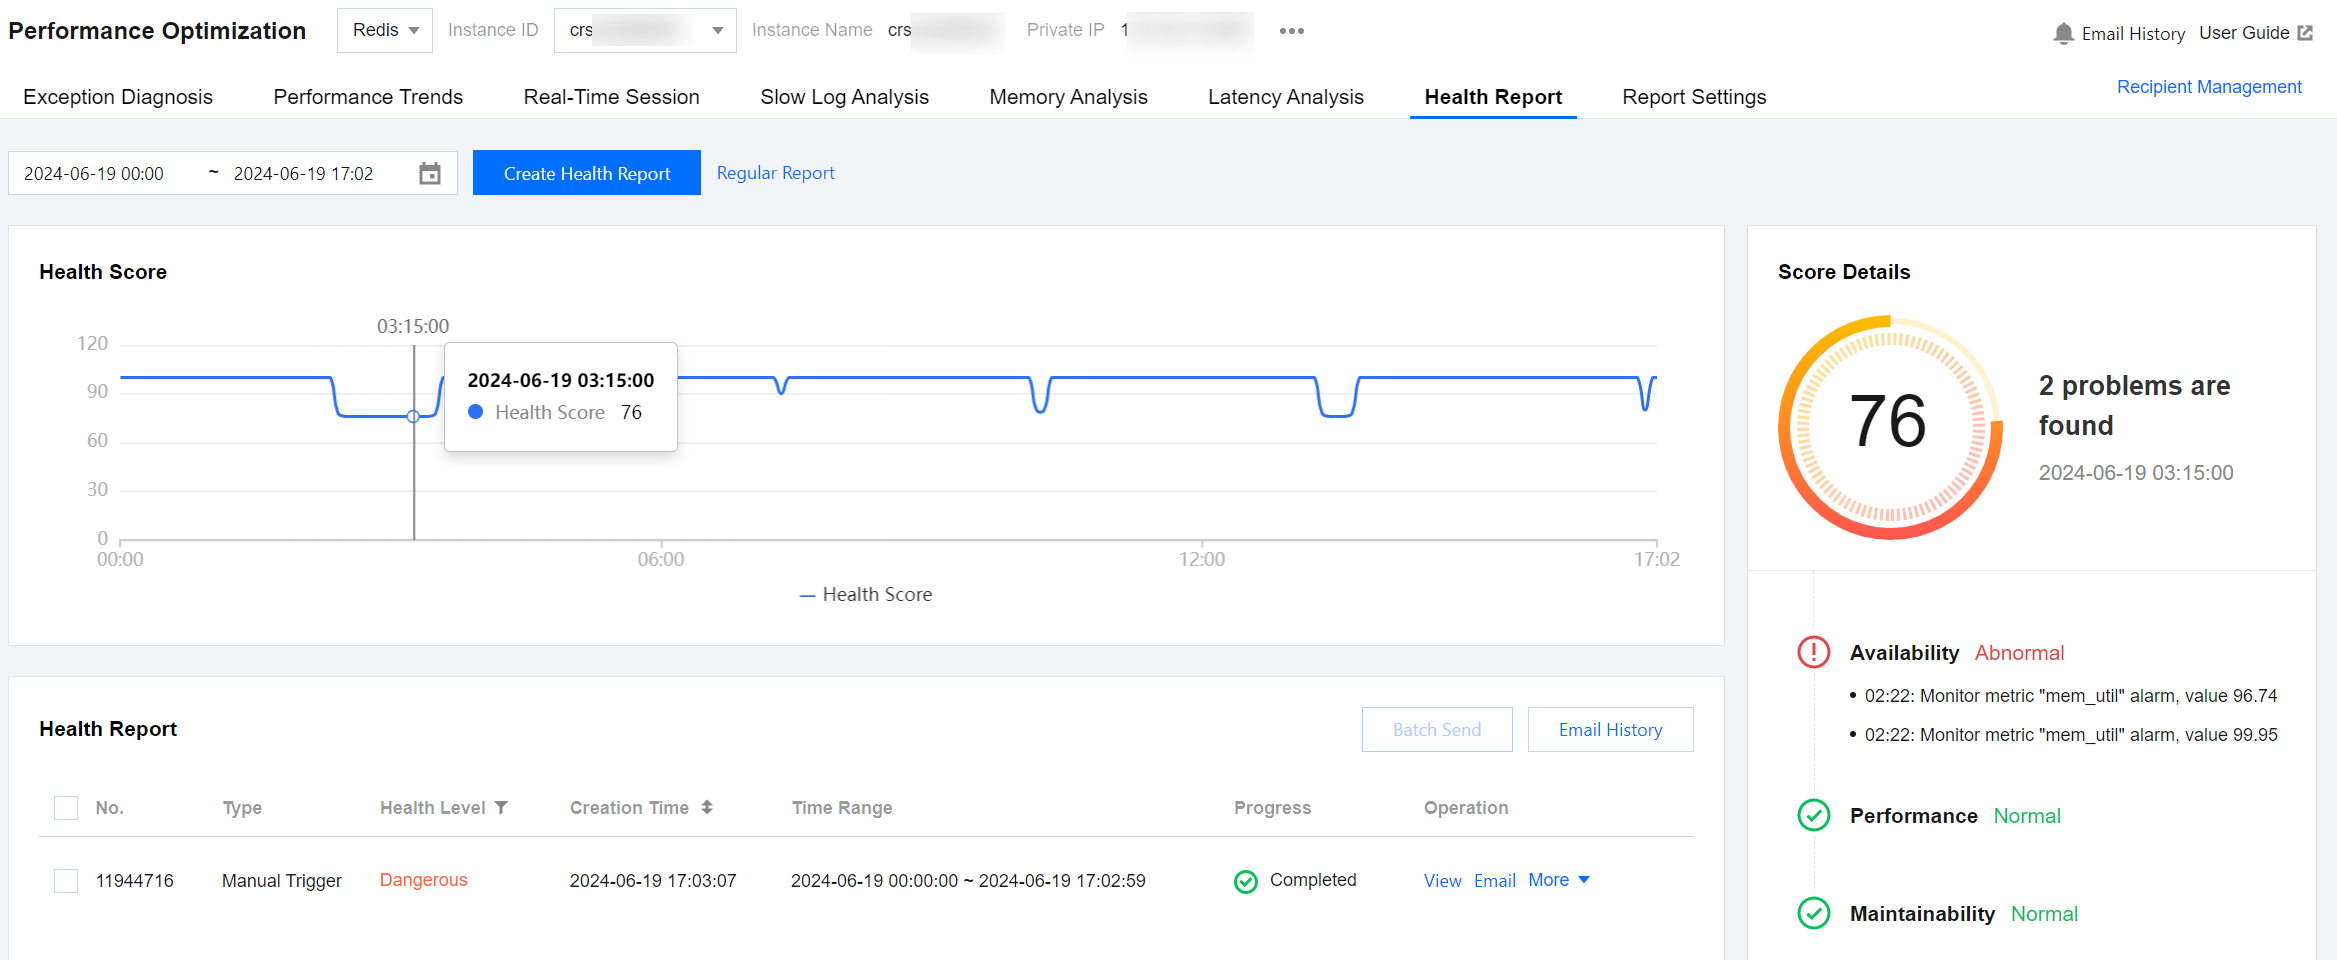
4. Click the health score line chart to view the health score and score details.
Note:
If the health score is low for the selected time period and you need to view the instance's health details, click Create Health Report to create a one-time health report. For detailed steps, see Creating Health Reports.
Health score line chart: Displays the health score for the selected time period. Click to view the health score and detailed score at specific time points.
Score details: Displays the status of Availability, Maintainability, Performance, and Reliability across four dimensions, and describes any abnormal content.
5. View the health report. The parameters of the health report list are described in the table below.
Parameter
Descriptions and Operations
Type
Includes Database Inspection, Manual Trigger, and Scheduled Tasks. For the description and operation guide for creating different types of health reports, see Health Report Overview.
Health level
According to the Health Score, it is divided into 4 levels:
Healthy: score ≥ 95
Sub-healthy: 80 ≤ score < 95
Dangerous: 60 ≤ score < 80
High-risk: score < 60
Creation Time
The time when the health report was generated.
Time Range
The time range covered by the health report.
Progress
The current progress of the health report. When the progress shows completed, the health report has been generated.
Opertation
View health report details: Click View to see the health report on the pop-up page. Click Generate/Download PDF Report at the top right of the pop-up page, and then click Click to view or download in the pop-up dialog box to view and download the health report in a new browser window.
Simple email service for health report: Click Email or select the health report from the health report list and click Batch Send at the top right. For more information, see Simple email service for Historical Health Report.
View deduction details: Click More > Deduction Details to view both individual and total deduction details in the pop-up dialog box.
Delete health report: Click More > Delete and click OK in the pop-up dialog box. Deleting is not supported when the health report type is a database inspection.
Health Report Interpretation
The health report displays DBbrain's evaluation of the overall operation status of the user-selected database instances within a specified time range. It mainly includes a summary and analysis of database issues and provides related suggestions. The report is used to help users fully understand the overall operation status of the selected database instances and coordinate related personnel to reach a unified understanding of the issue status.
The sections included in the health report and their descriptions are shown in the table below.
Chapter Name
Description
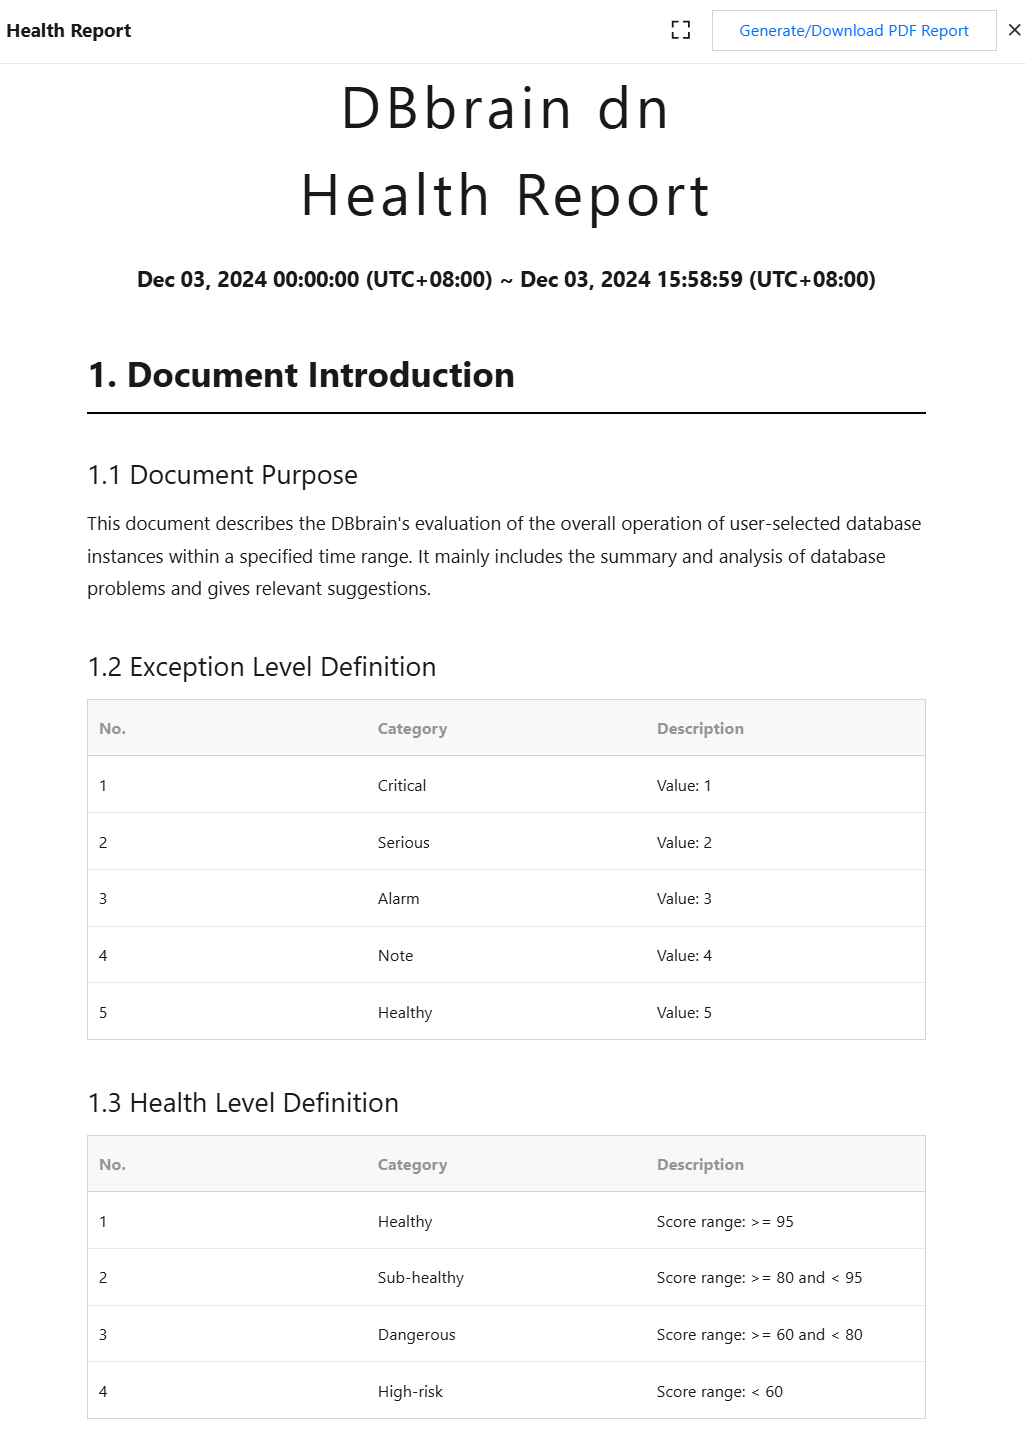
Document Introduction
Includes document purpose, exception level definition, and health level definition. The health level definition is consistent with the health level field definition in the health report list.
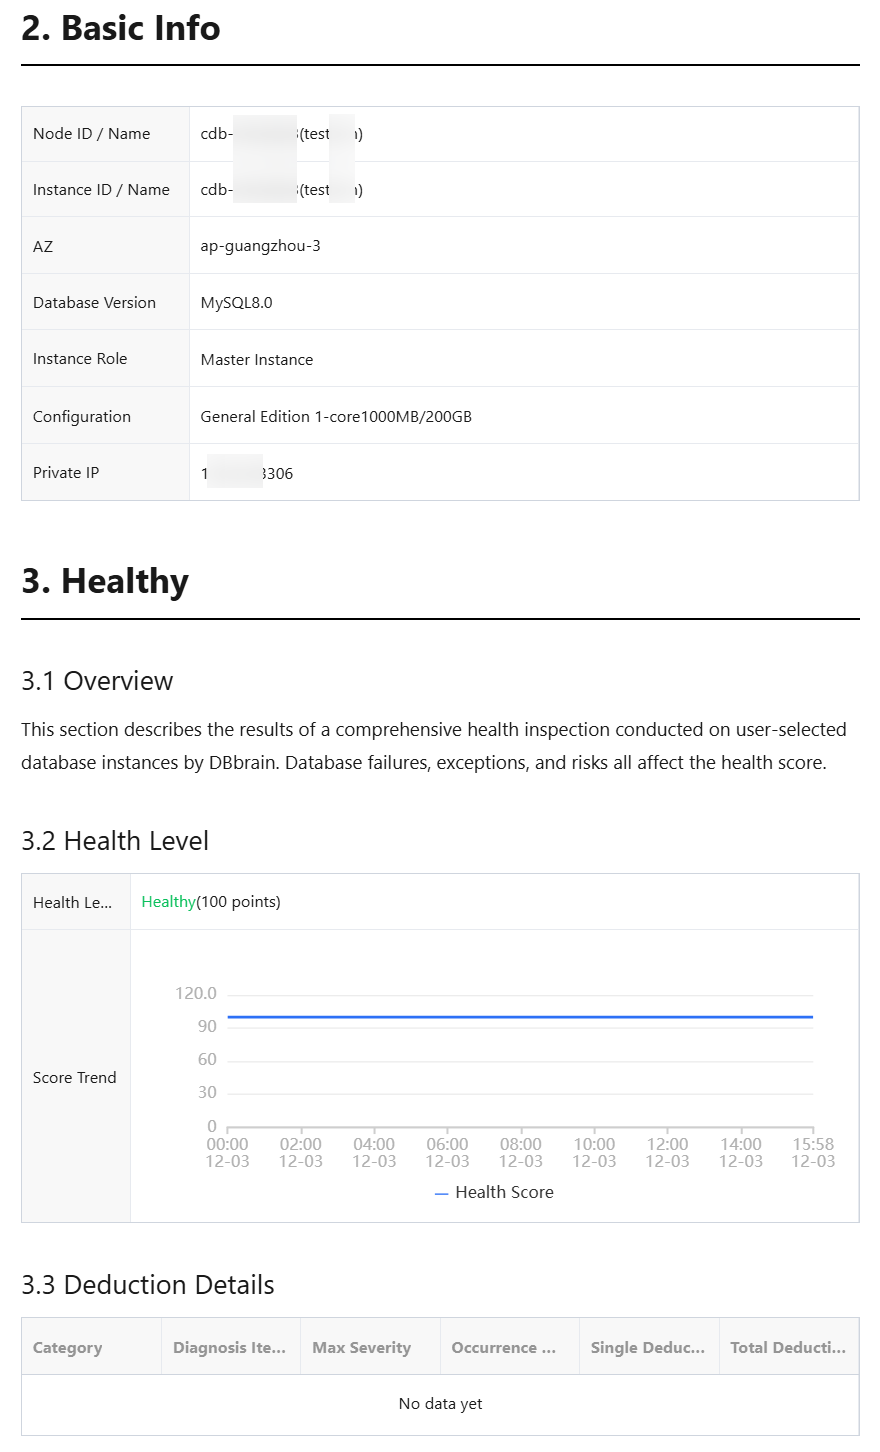
Basic Info
Includes instance ID/name, availability zone, database version, instance role, configuration, private network address, and other field information.
The field information displayed may vary depending on the database type. Refer to the actual data.
Healthy
Includes overview, health level and score trend, and deduction details.
Deduction details show single and total deductions from four types of deductions: availability, maintainability, performance, and reliability.
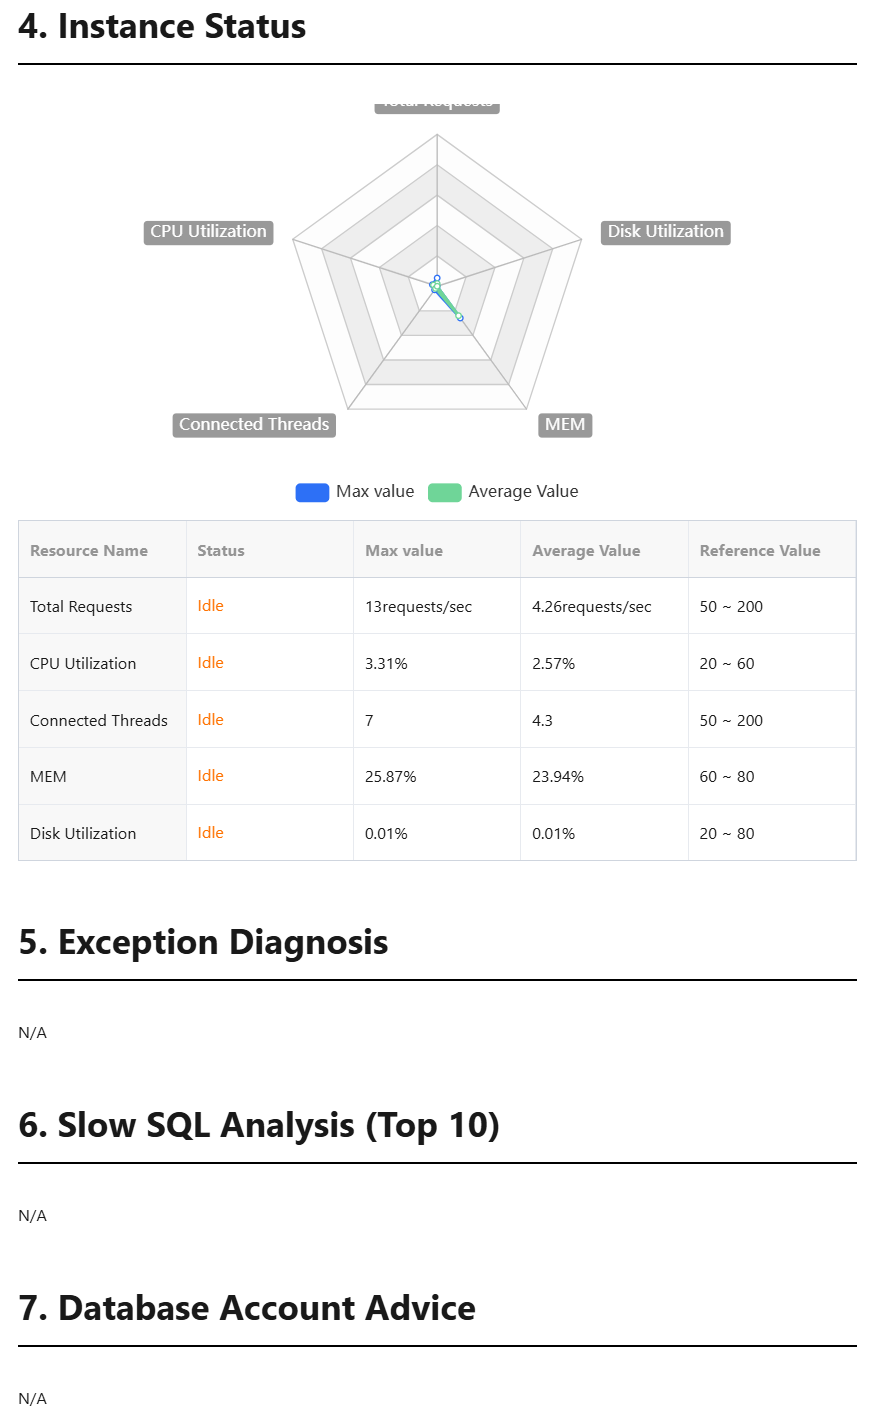
Instance Status
The overall status, maximum value, average value, and reference value of key performance metrics are displayed through a radar chart and table.
Exception Diagnosis
Displays the top 10 exception events for each type of deduction (availability, maintainability, performance, reliability) as listed in the deduction details.
Exception events include information such as occurrence time, duration, risk level, summary, intelligent analysis, optimization suggestions, and on-site description.
Slow SQL Analysis (TOP 10)
Displays the top 10 slow SQL statements along with SQL optimization suggestions.
Database Account Advice
Database account suggestions include occurrence time, risk level, summary, intelligent analysis, optimization suggestions, and on-site description.
Top Table Space
Displays information about the top 20 tables with the largest total used space.
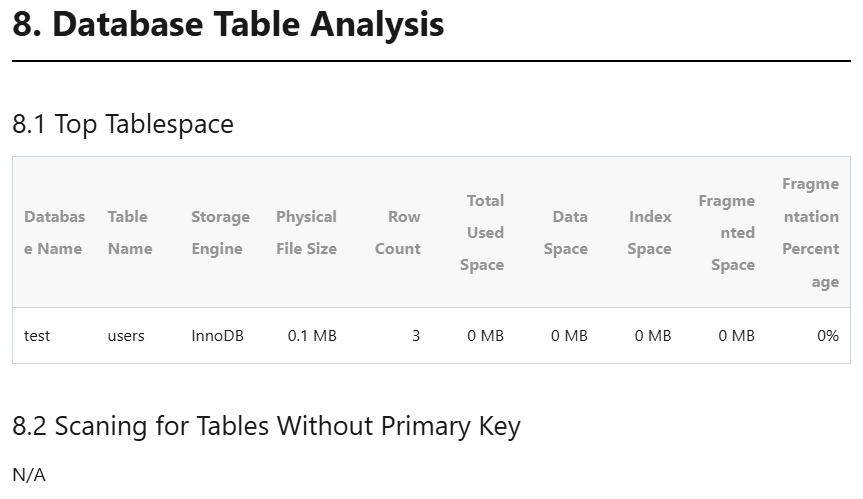
Database Table Analysis
Displays information about the top 20 tables with the largest total used space and scans for tables without a primary key.
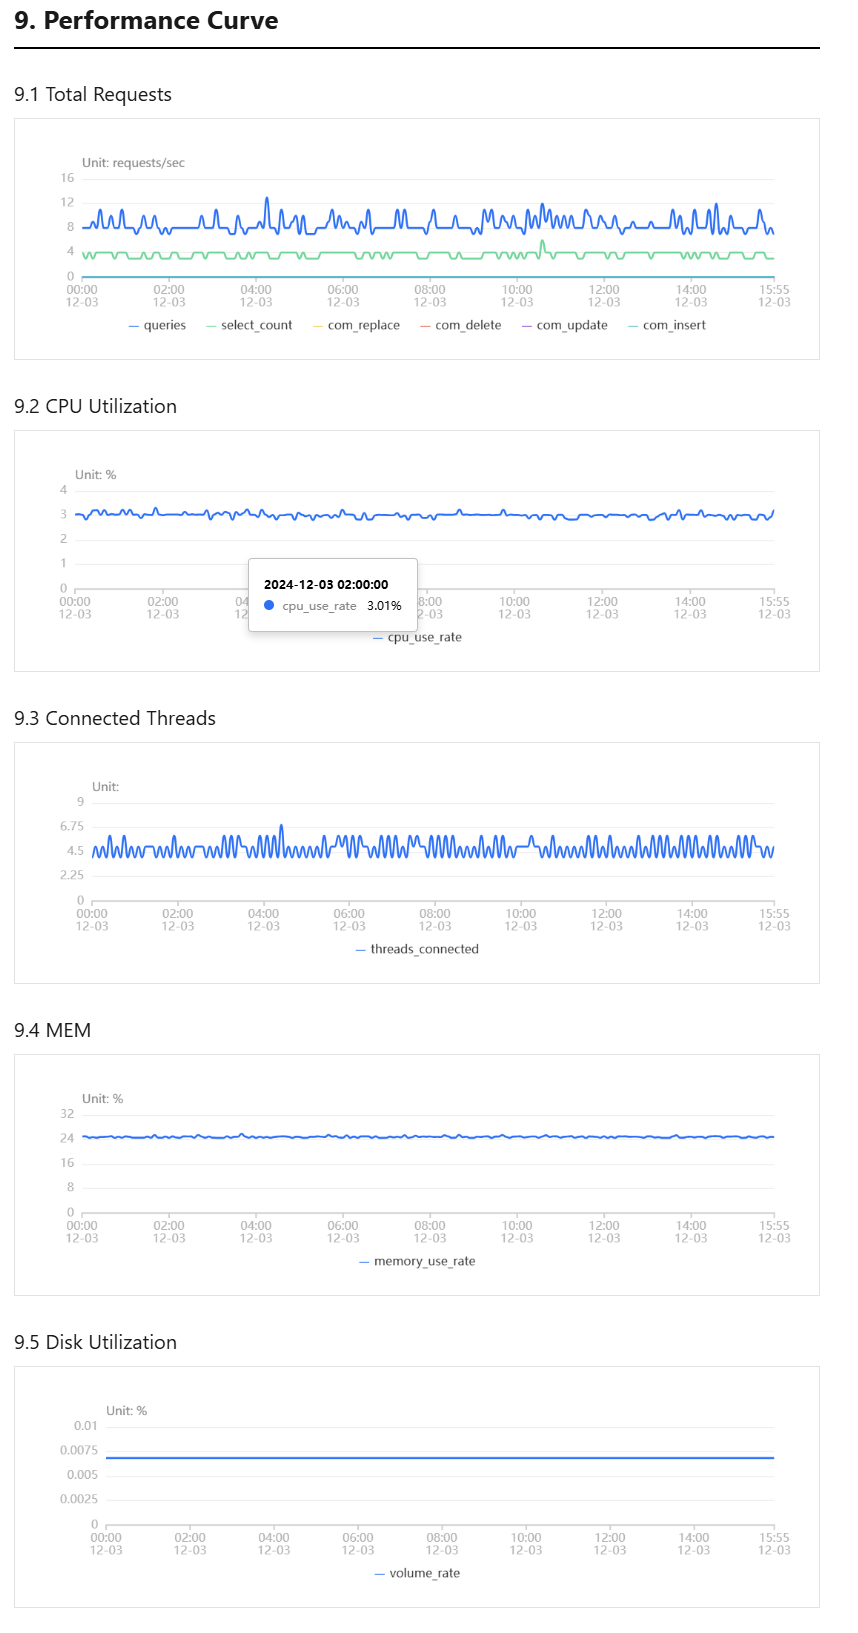
Performance Curve
Displays the trend chart of key performance metrics.
Note:
Different database types may display different sections and specific content. Refer to the actual data.