With the Space Analysis feature provided by DBbrain, users can view the utilization of instance space, including the sizes of data space and log space, the average daily growth of space utilization, and the estimated number of available days, as well as view the usage details and trends of table space and database space within the instance.
2. In the left sidebar, select Performance Optimization.
3. At the top of the page, select the database type, instance ID, or shard ID, and select the Memory Analysis tab.
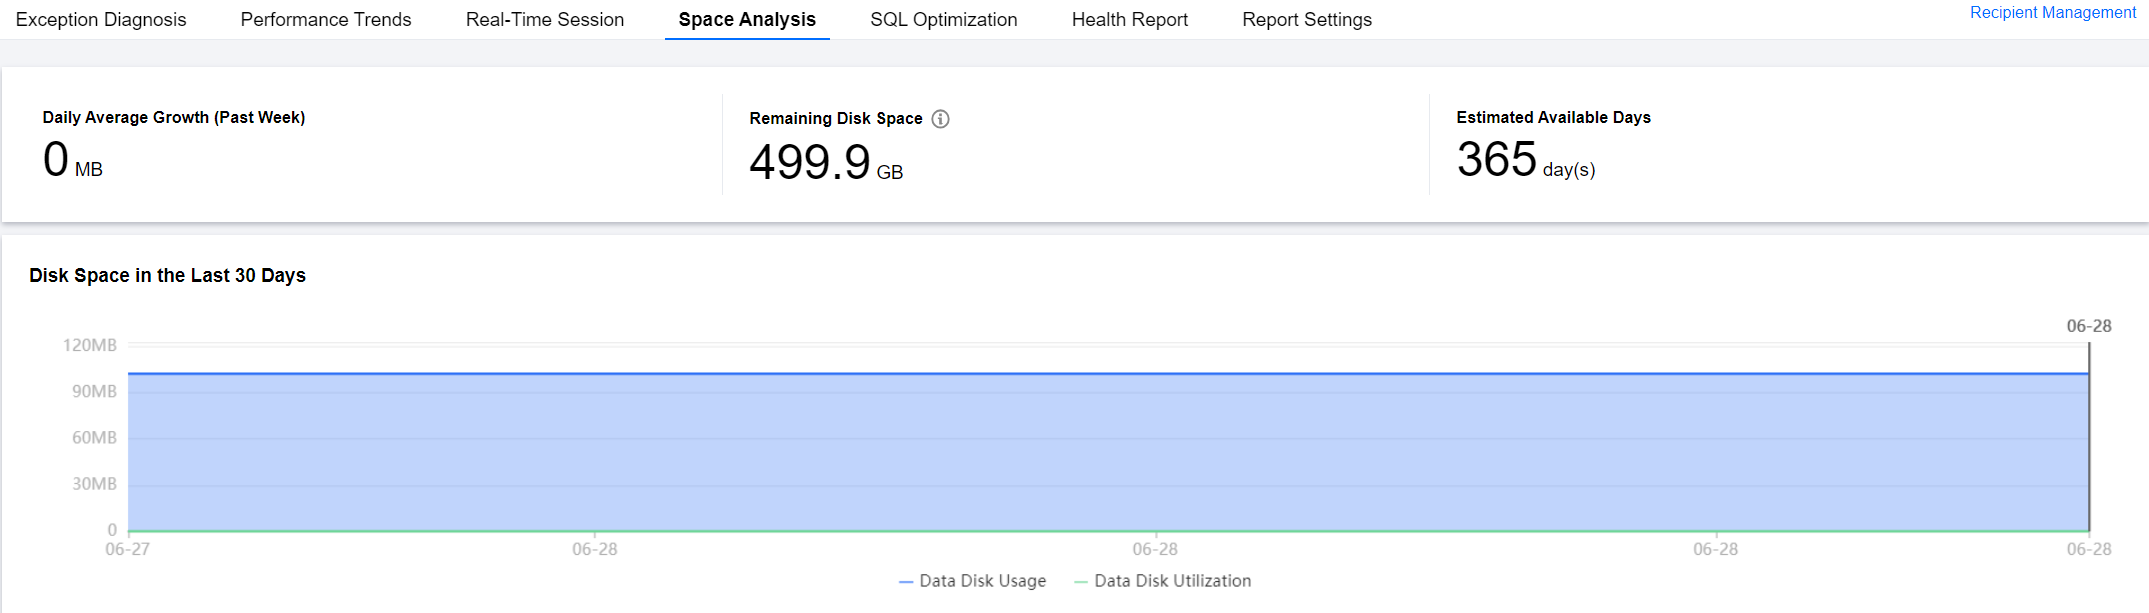
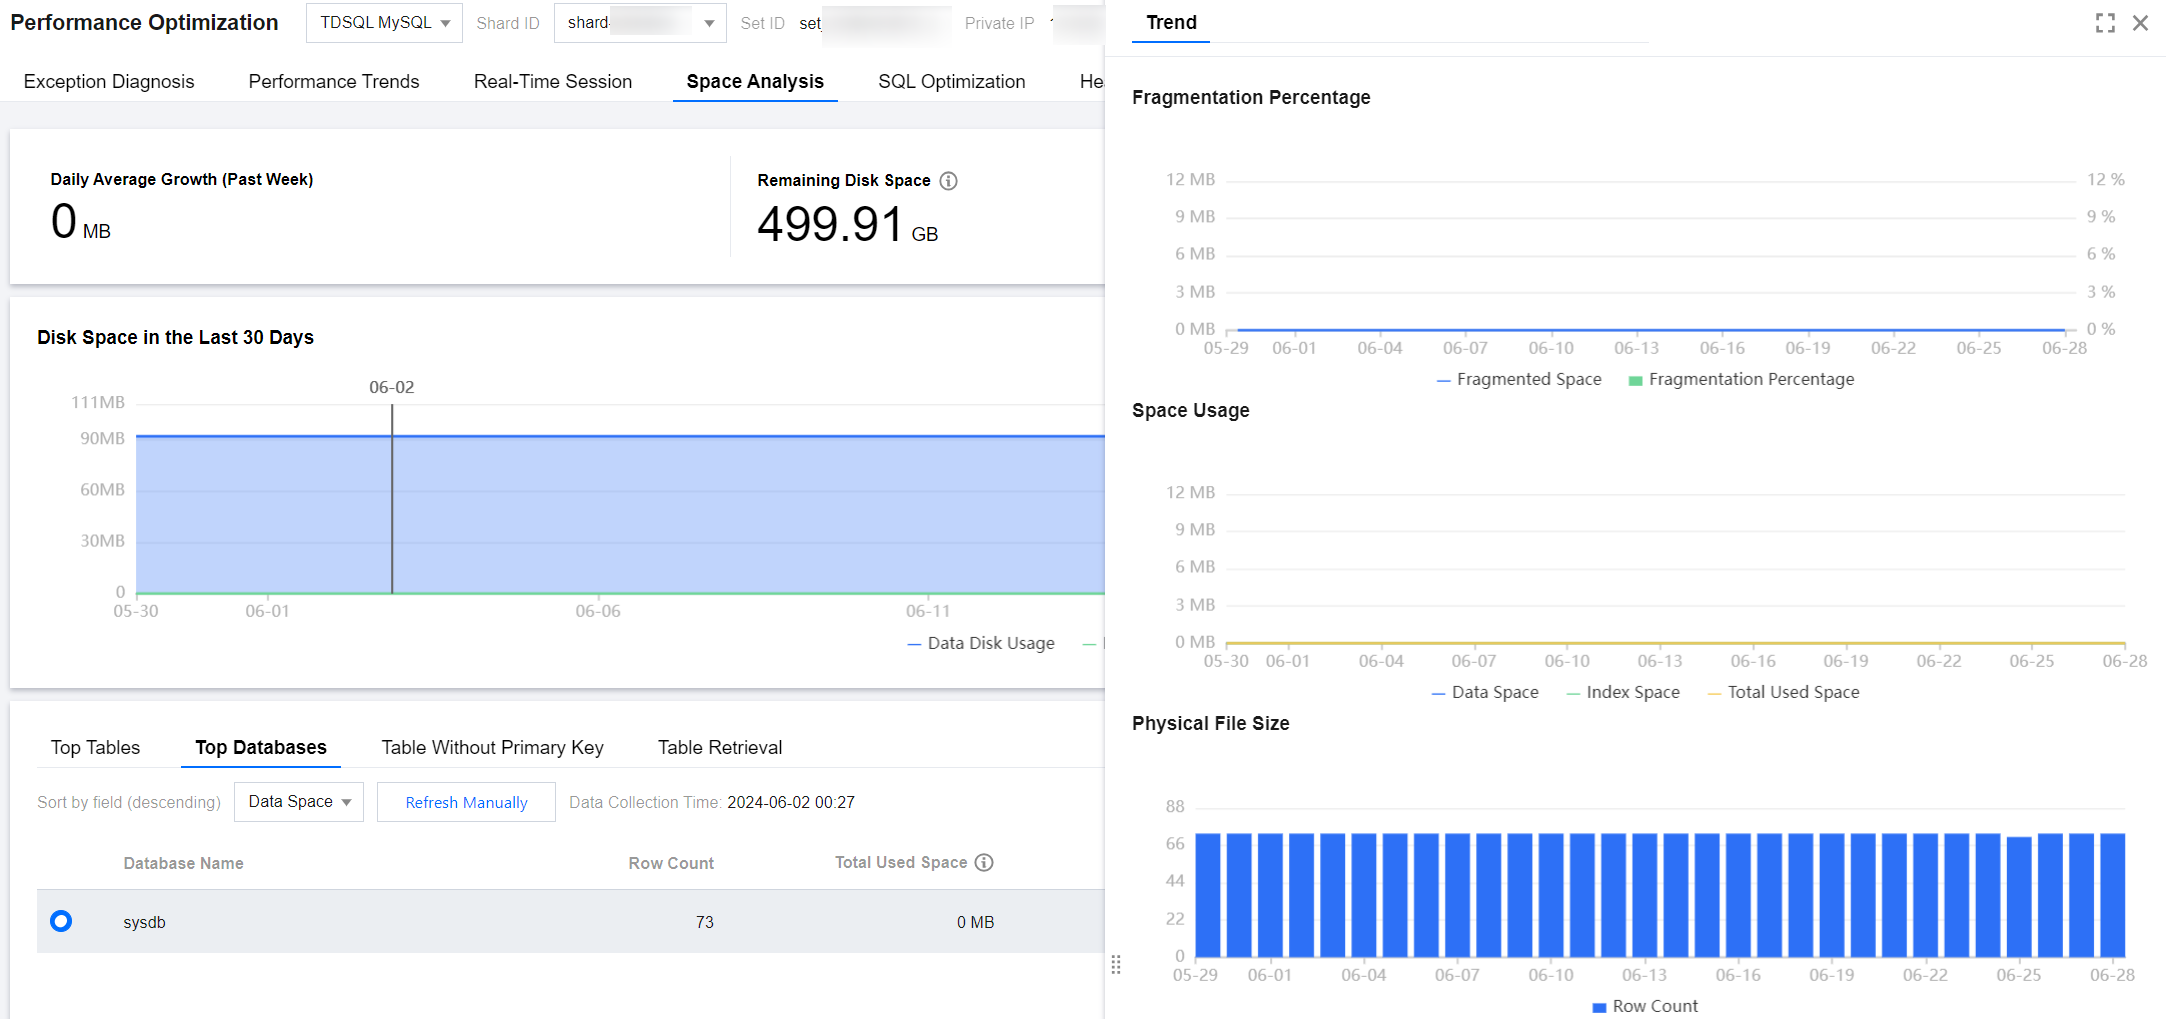
On the Space Analysis page, you can view the average daily growth for the past week, remaining disk space, estimated available days, and the disk space trend chart for the last 30 days.
Remaining Disk Space = Total Availability (Log Disk + Data Disk) - Used Quota (Log disk + Data disk)
Viewing Top Tables
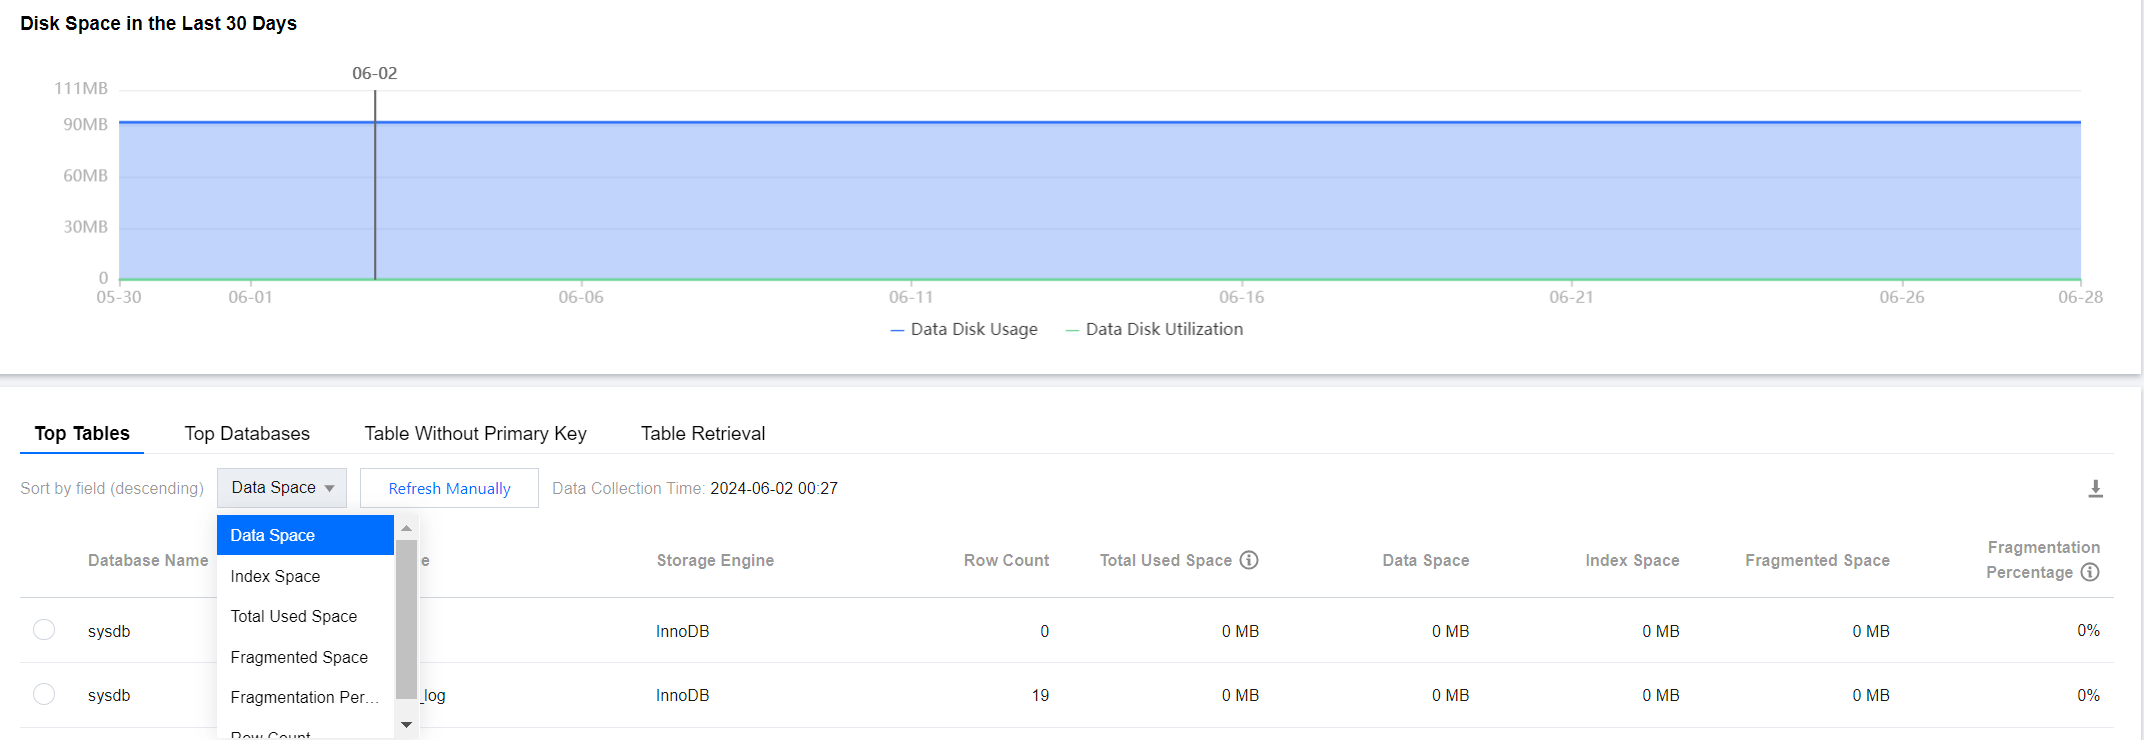
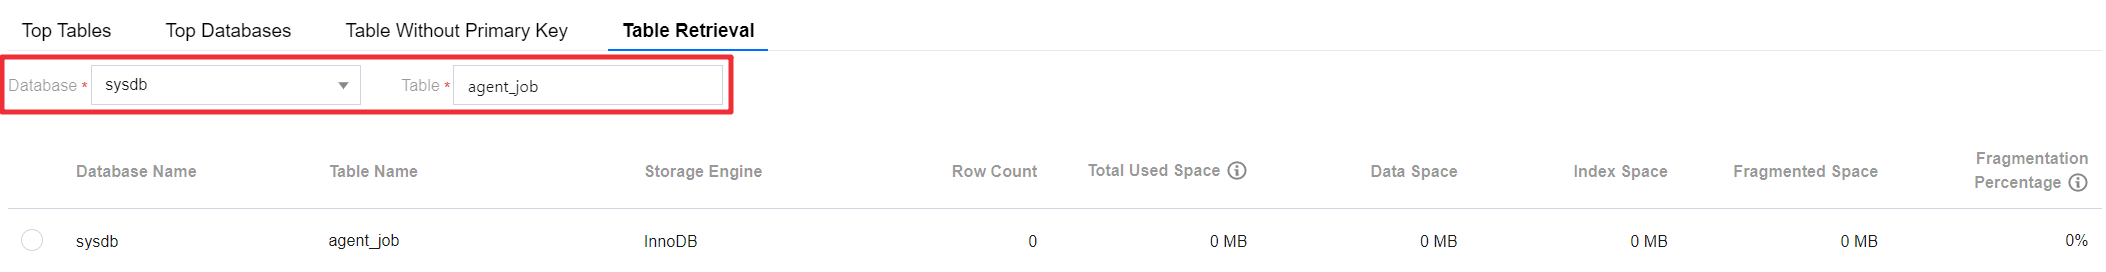
The Top Tables display details of tables with large space usage, including storage engine, physical file size, number of rows, total used space, data space, index space, fragment space, and fragmentation rate. The information helps you understand disk space usage and optimize it in a timely manner.
Note:
The Top Tables/Databases feature supports manual refresh. By default, data is collected once a day. If the data collection time is significantly different from the current time, causing inaccurate information, you can click manual refresh to trigger real-time collection and analysis of Top table/database information. Note that if there are many instance tables or high access pressure, some delay may occur.
2. In the left sidebar, select Performance Optimization.
3. At the top of the page, select the database type, instance ID, or shard ID, and select the Memory Analysis tab.
4. Select the Top Tables tab, and select the sort fields (descending), including data space, index space, total used space, fragment space, fragmentation rate, and number of rows, to view the Top Table list.
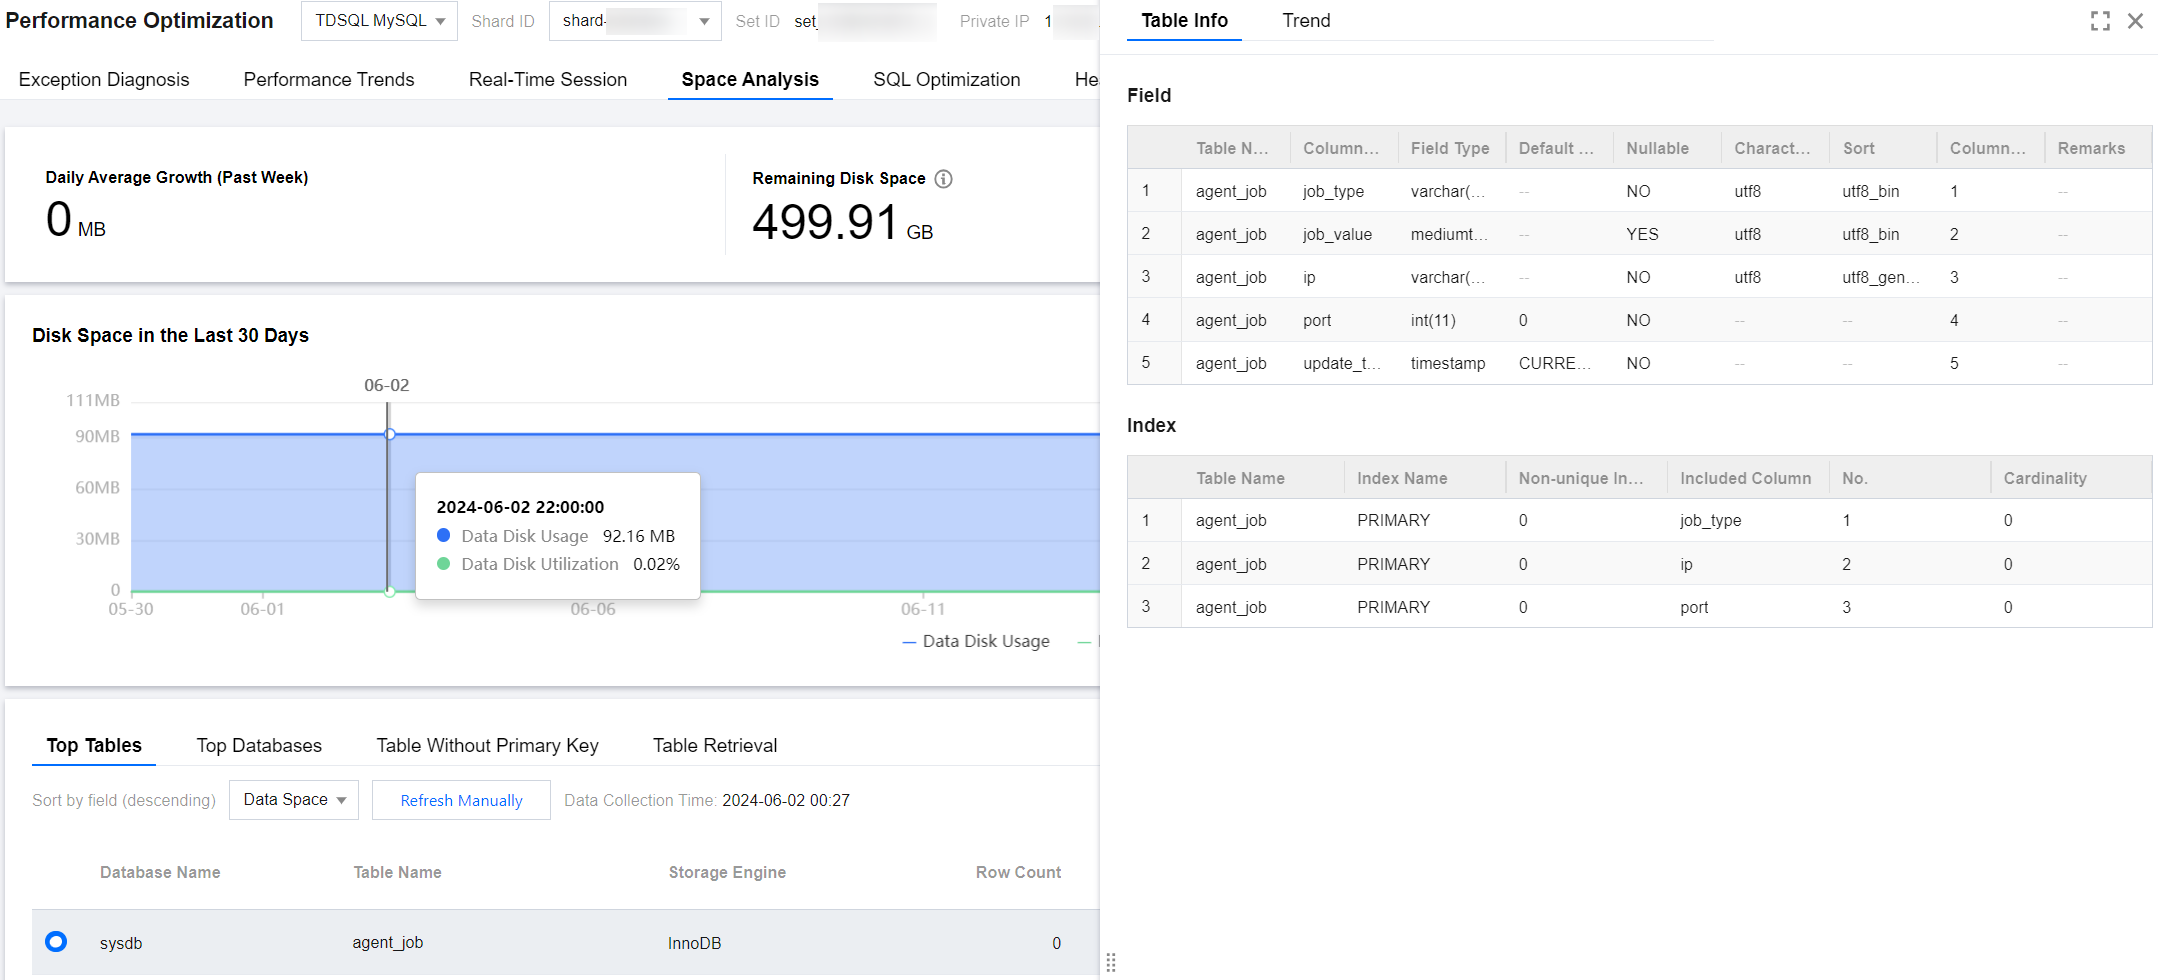
5. Click a data row in the Top Table list to view table details and trend charts.
Table Info: Displays detailed information about the fields and indexes of the table. Field information includes table name, column name, field type, default value, nullable, character set, sort, column position, and remarks. Index information includes table name, index name, non-unique index, included columns, sequence number, and cardinality.
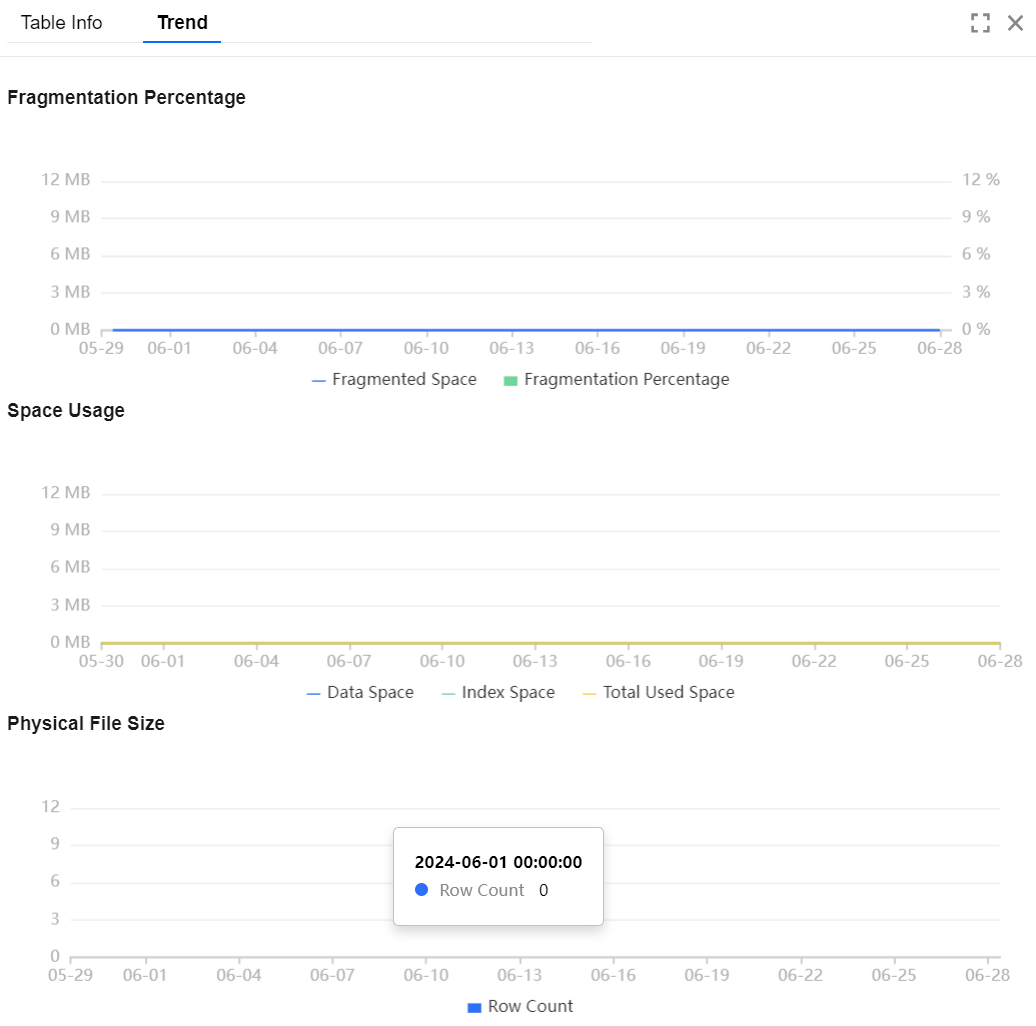
Trend: Includes trend charts for physical file size, space occupancy (data space, index space, total used space), and fragmentation rate (fragment space, fragmentation rate).
6. (Optional) In the top-right corner of the list, click
to download the Top Table data in .csv format.
Viewing Top Databases
The Top Databases display details of databases with large space usage, including physical file size, number of rows, total used space, data space, index space, fragment space, and fragmentation rate. The information helps you understand disk space usage and optimize it in a timely manner.
2. In the left sidebar, select Performance Optimization.
3. At the top of the page, select the database type, instance ID, or shard ID, and select the Memory Analysis tab.
4. Select the Top Databases tab, and select the sort fields (descending), including data space, index space, total used space, fragment space, fragmentation rate, and number of rows, to view the Top Databases list.
5. In the Top Databases list, click the row of a table to view the trend chart. The trend chart includes the trend of the physical file size, space usage (data space, index space, and total used space), and fragmentation rate (fragment space, fragmentation rate).
6. (Optional) In the top-right corner of the list, click
to download the data in TOP Databases in .csv format.
Viewing Table Without Primary Key
The Table Without Primary Key section displays information about tables in the current instance lacking primary keys. Such tables pose potential risks and may affect instance read/write performance and synchronization efficiency. It is recommended to promptly address these tables and add primary keys suitable for the business scenarios.
2. In the left sidebar, select Performance Optimization.
3. Select the Memory Analysis tab, and at the top of the page, select the database type, instance ID, or shard ID.
4. Select the Table Without Primary Key tab to view the list of tables without a primary key.
The list of tables without primary key supports two refreshing methods: regular scan (once per day) and manual refresh. Click a table in the list to view its field and index information. Field information includes table name, column name, field type, default value, nullable, character set, sort, column position, and remarks. Index information includes table name, index name, non-unique index, included column, serial number, and cardinality.
5. (Optional) In the top-right corner of the list, click
to download the data of tables without primary key in .csv format.