Dynamic Release Record (2026)
Getting Started with Data Quality
Note:
This document will guide you through a complete configuration process to quickly understand the core capability of the data quality module.
Preparations
1. Purchase and activate the WeData product. For details, see WeData Purchase Guide.
2. In WeData Console, create a project and bind data sources such as EMR, DLC, TCHouse-P, TCHouse-D, and Doris (this document uses EMR as an example). For details, see WeData Project Management.
3. In the data development module, create a database and a data table (this document uses EMR as an example). For details, see WeData Data Management.
4. In the data development module, create a data development task. For details, see WeData Task Development Introduction.
Note:
Please enable metadata scanning during binding when you create a project, purchase and bind the EMR engine, and bind scheduling resources.
Data Sheet Preparation
1. Create a database named emall in the emr-hive data source and create a data table named dq_test.
2. Add the following fields to the table:
Field Name | Chinese Name | Column Type | Partitioned |
pt_date | Partition Field | string | Yes |
id | id | string | No |
name | Name | string | No |
gender | gender | int | No |
Operation screenshot:
Data Development Task Preparation
1. In the data development > orchestration space interface, click Create Workflow.
2. Create a task node in the workflow with the task type: Hive SQL.
Hive SQL is as follows:
INSERT INTO TABLE emall.dq_test PARTITION (pt_date = '2024-05-01')VALUES ('1', 'Tom', '1');
Configuring a Data Quality Monitoring Task
Configuration Process
Creating a Quality Monitoring Task
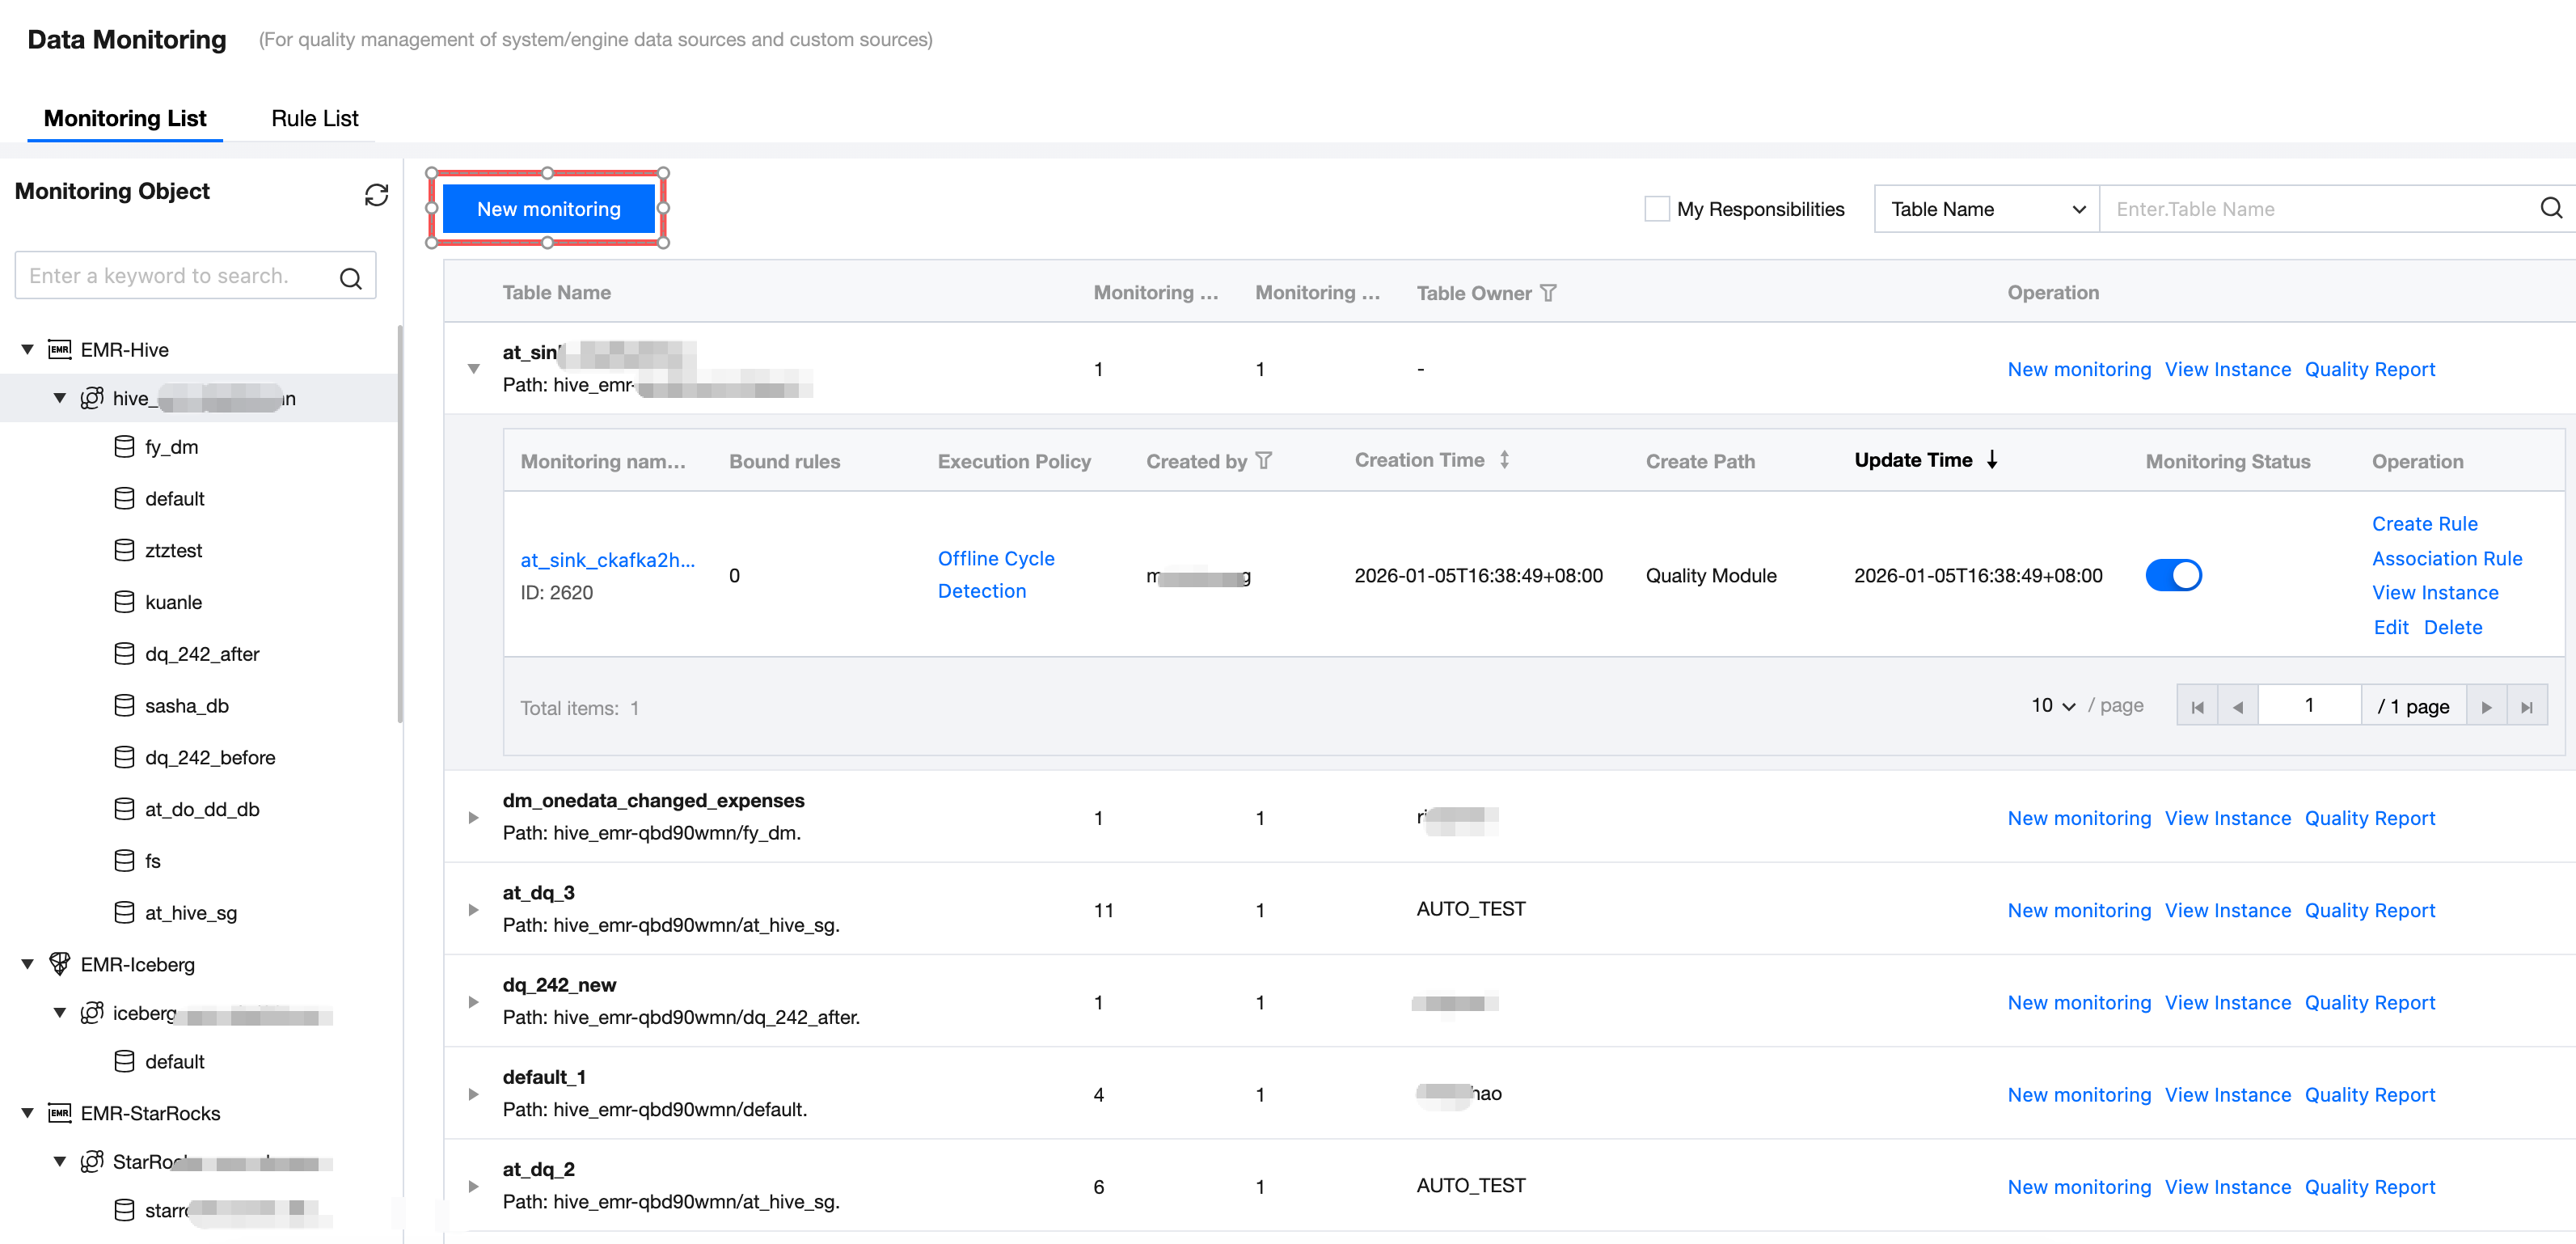
Enter the Data Quality > Data Monitoring > EMR interface, click Add Monitoring, to start creating a new quality monitoring.
Step 1: Configure Monitoring Info
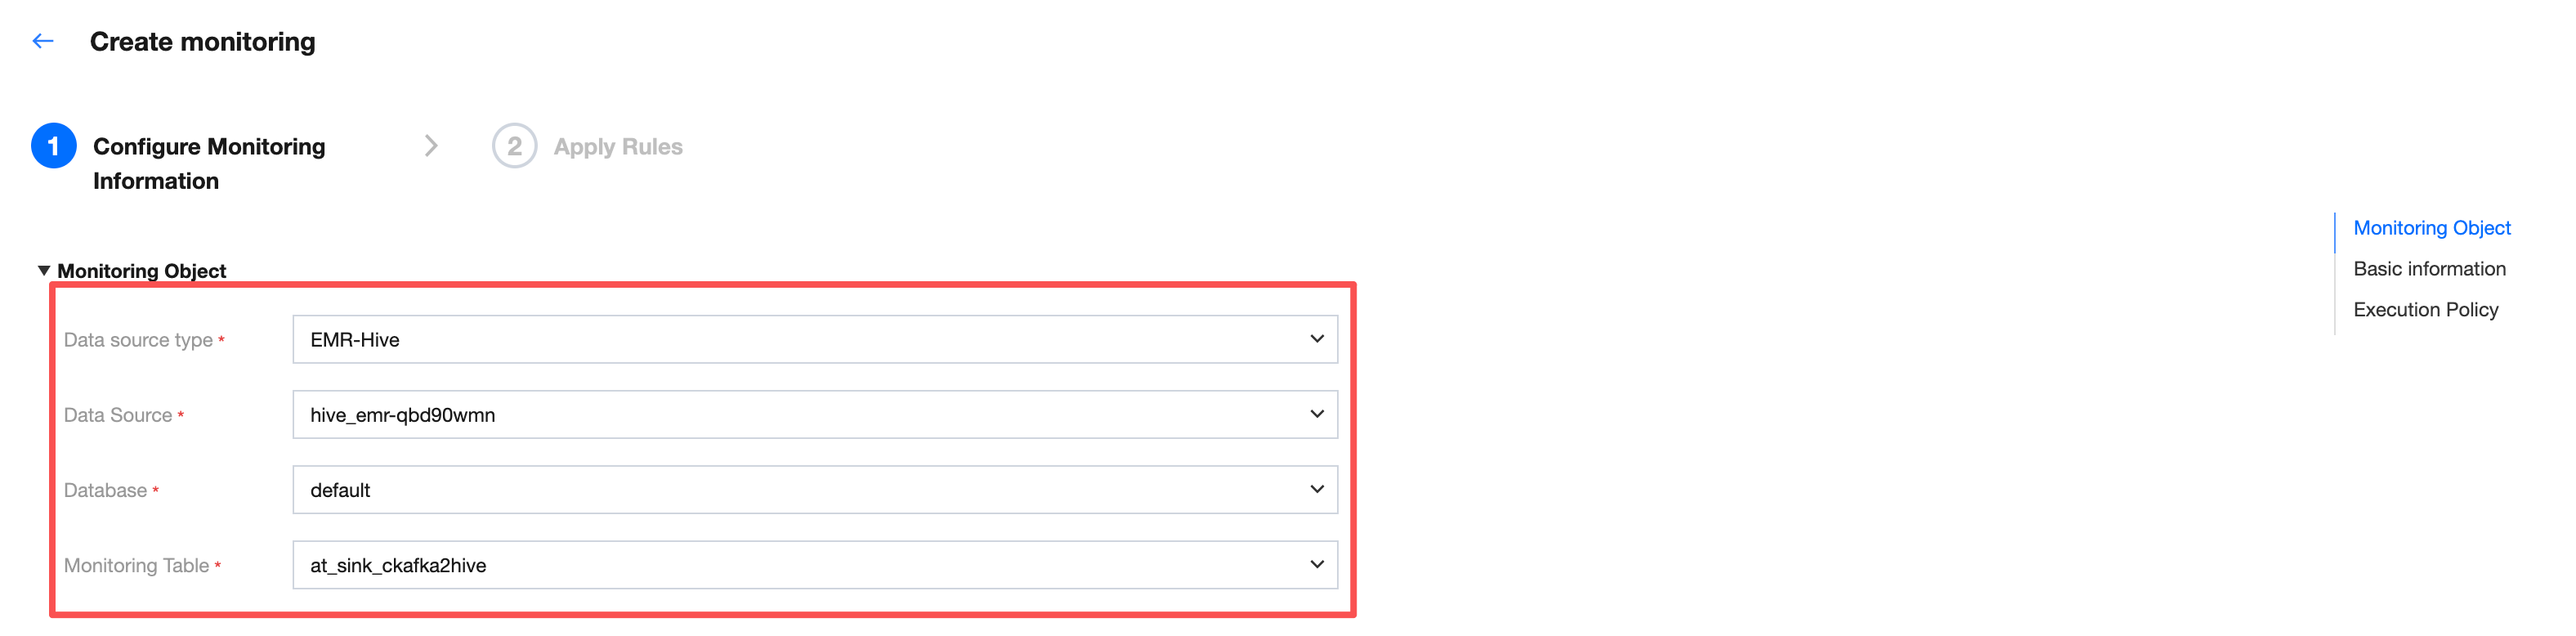
Monitoring Object
Enter the Create Monitoring interface, sequentially select the data source type, data source, database, and monitoring table for the monitoring object.
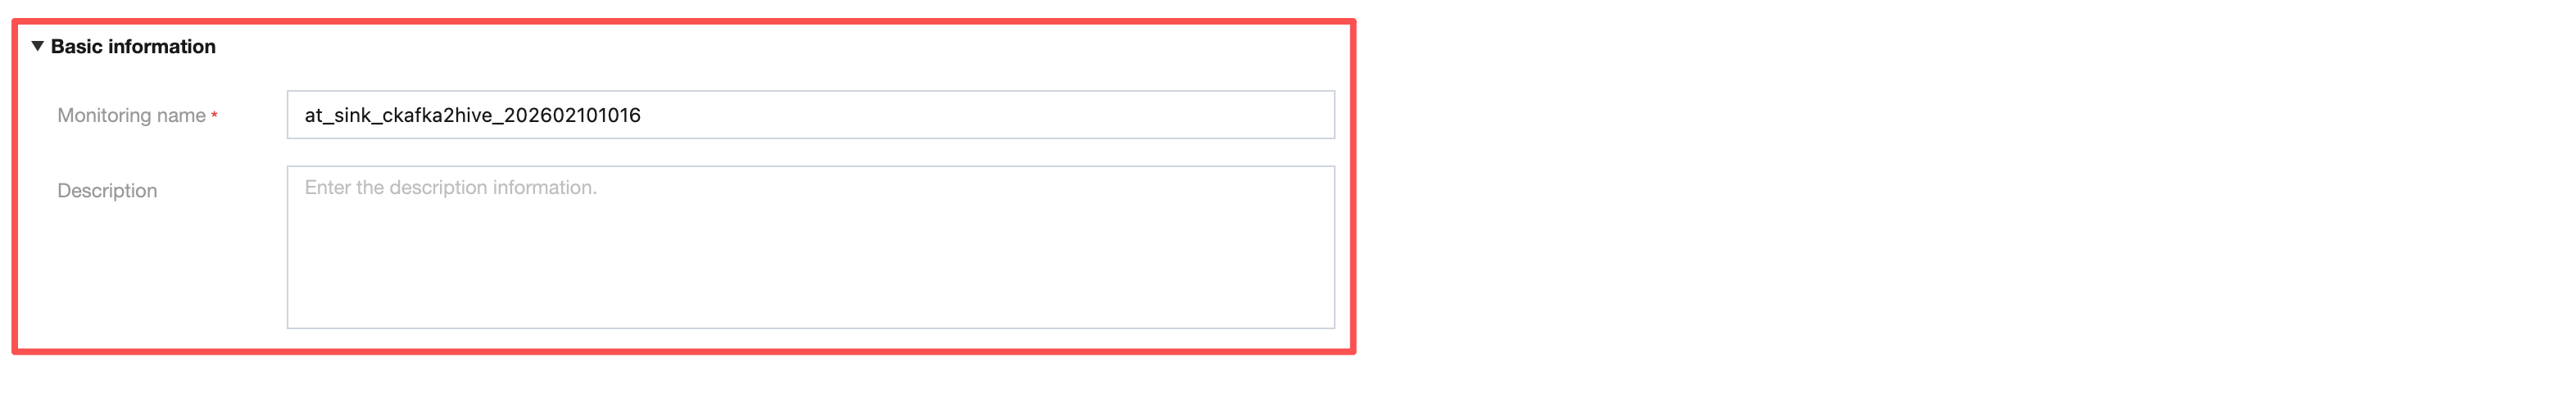
Basic Information
Fill in the monitoring name. The default monitoring name is monitoring table name_create monitoring timestamp.
Note:
It is advisable to fill in an easy-to-identify monitoring name for better understanding of the business significance of detection results in task instances.
For example: When the monitoring name is "North China region sales table routine detection per month", Ops management will show whether the "North China region sales table routine detection per month" run succeeded or failed each time.
Meanwhile, for convenience, you can also add a business description.
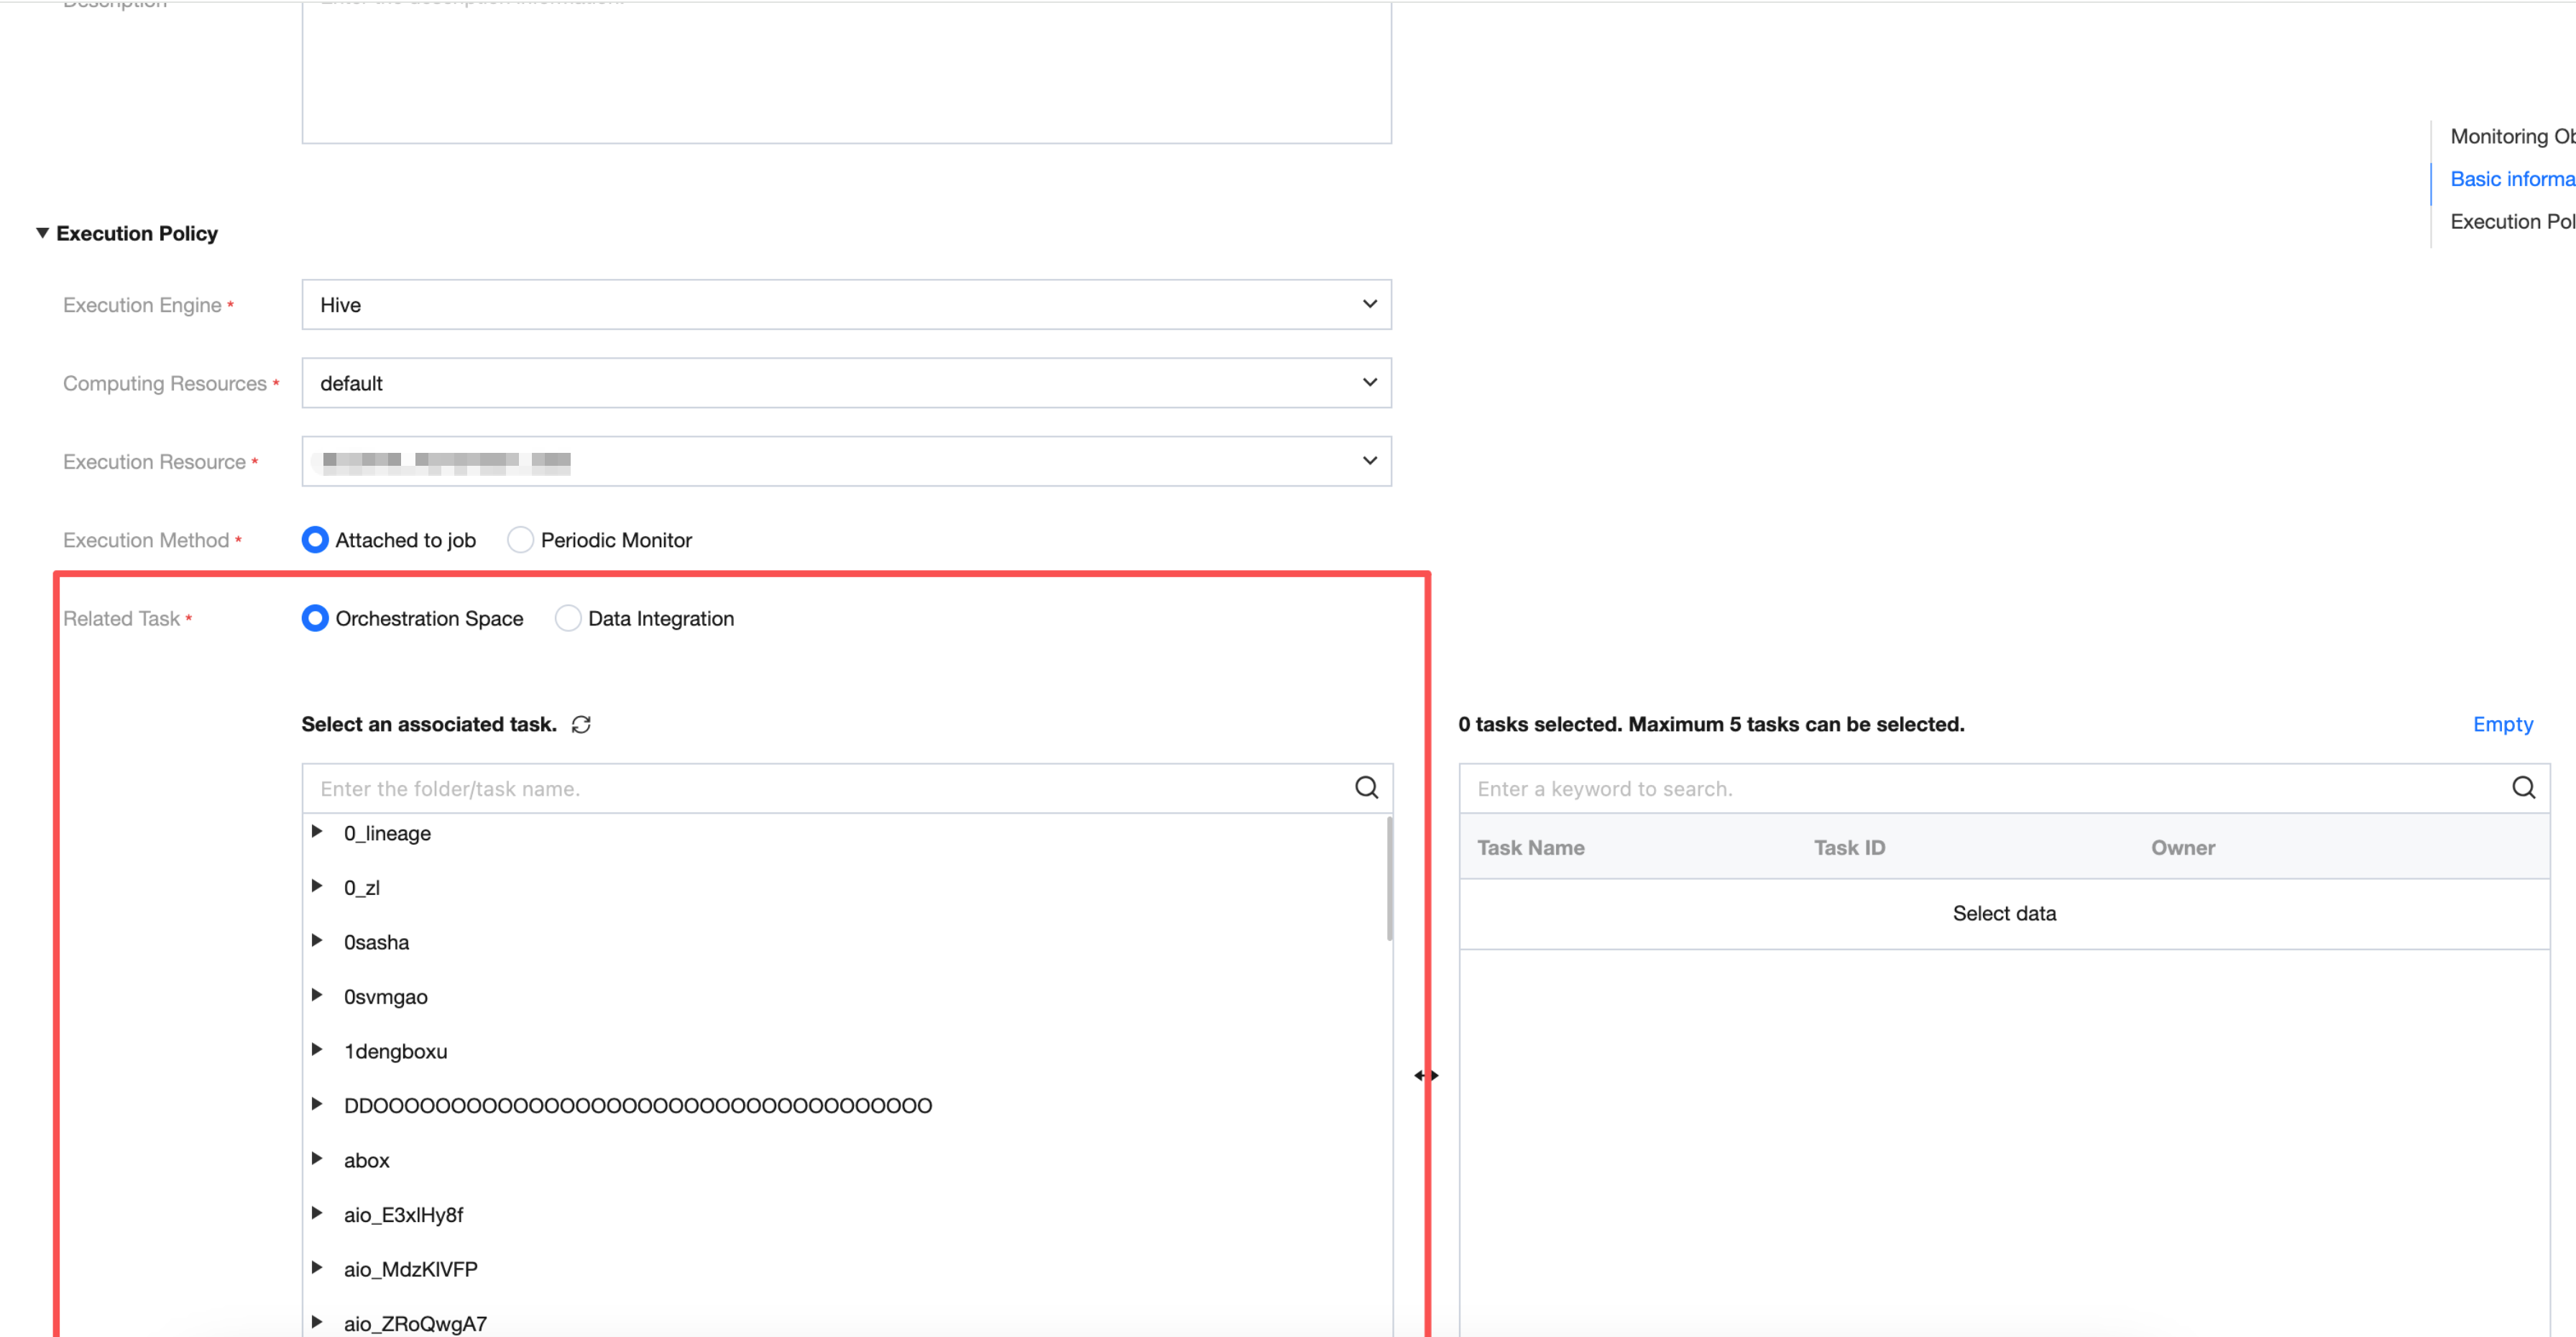
Execution Policy
Element | Description |
Execution Engine | Here you can select Hive and Spark, about the purchased EMR resource. Generally, Hive tables can directly select Hive engine. |
Computing Resource | Select default Here you can select the resource group in the EMR cluster. Generally, you can directly select default. |
execution resource | The execution resource here is the scheduling resource group already bound to the project. |
Execution Method | Here you can select Associated Production Scheduling and Offline Cycle Detection: Associated Production Scheduling: Associate quality tasks with production tasks (data sync tasks or data development tasks). When a production task completes, insert a quality monitoring task. If an exception is detected, the handler will be notified immediately for processing. Based on the rule level in monitoring, downstream task execution will be blocked to avoid problem data expansion. Note: The same quality inspection task can associate multiple production tasks; the same production task can also associate multiple quality inspection tasks. Offline Cycle Detection: Independent scheduling. Set periodic quality inspection for selected database tables and core business fields with custom frequency such as daily, hourly, or by minute. Quality tasks will execute on schedule based on the set period. If an exception is detected, subscribers will be notified immediately. |
associated task | Here you can select the module belonging to the production task that must be associated, development space or Data Integration, and can only be associated with up to 5 tasks: Development space: Show the directory tree structure in the development space and support searching folders or task names. Data Integration: Show the task list in data integration. |
Click Next to complete monitor creation and proceed to the association rule interface.
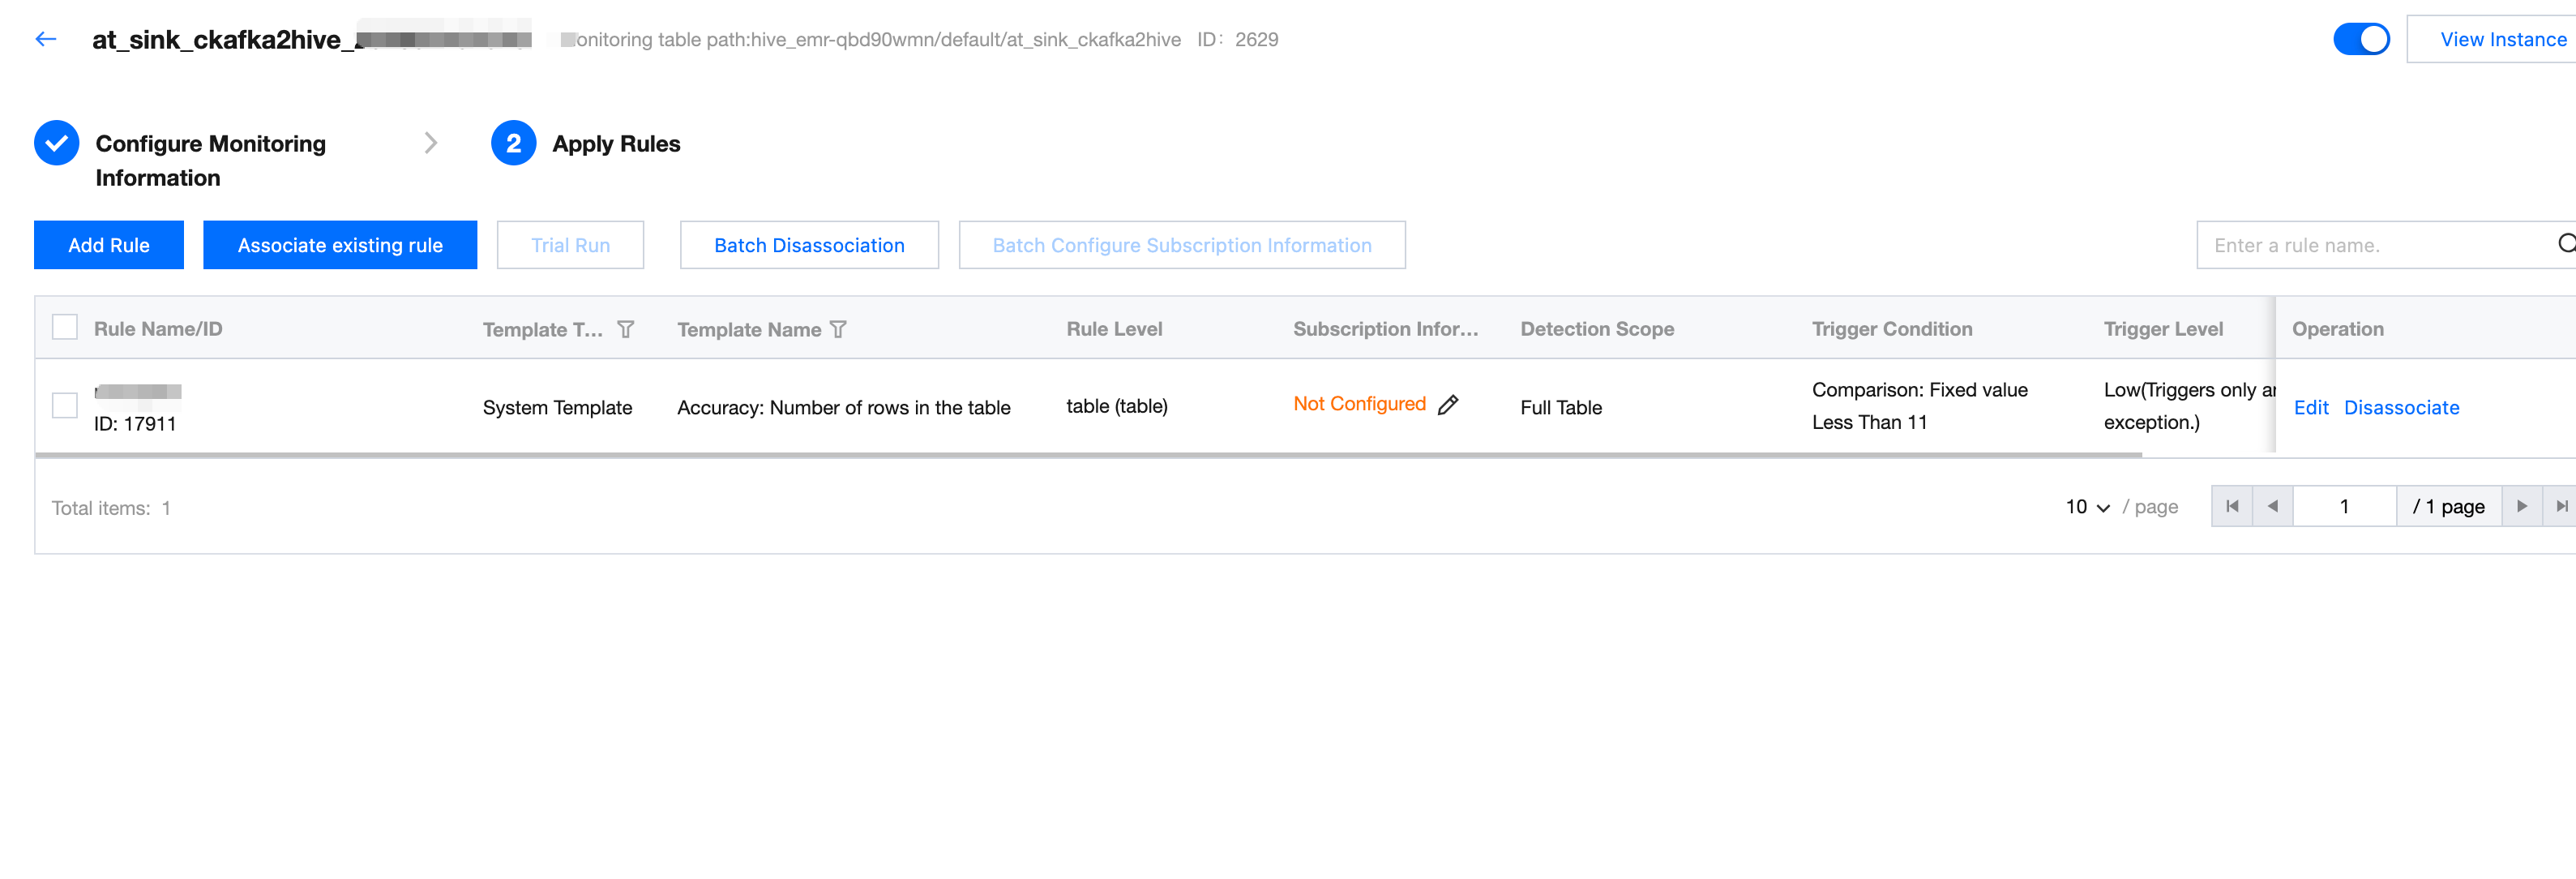
Step Two: Association Rule
Association rules are displayed in one table, with no rules associated with other monitoring tasks. Support edit or associate quality rules (Option).
Note:
Quality rules unassociated with monitoring will not execute.
If existing rules cannot meet business needs, click Associate Existing Rules
Show all rules associated with this monitor, all quality rules associated earlier will be echoed here.
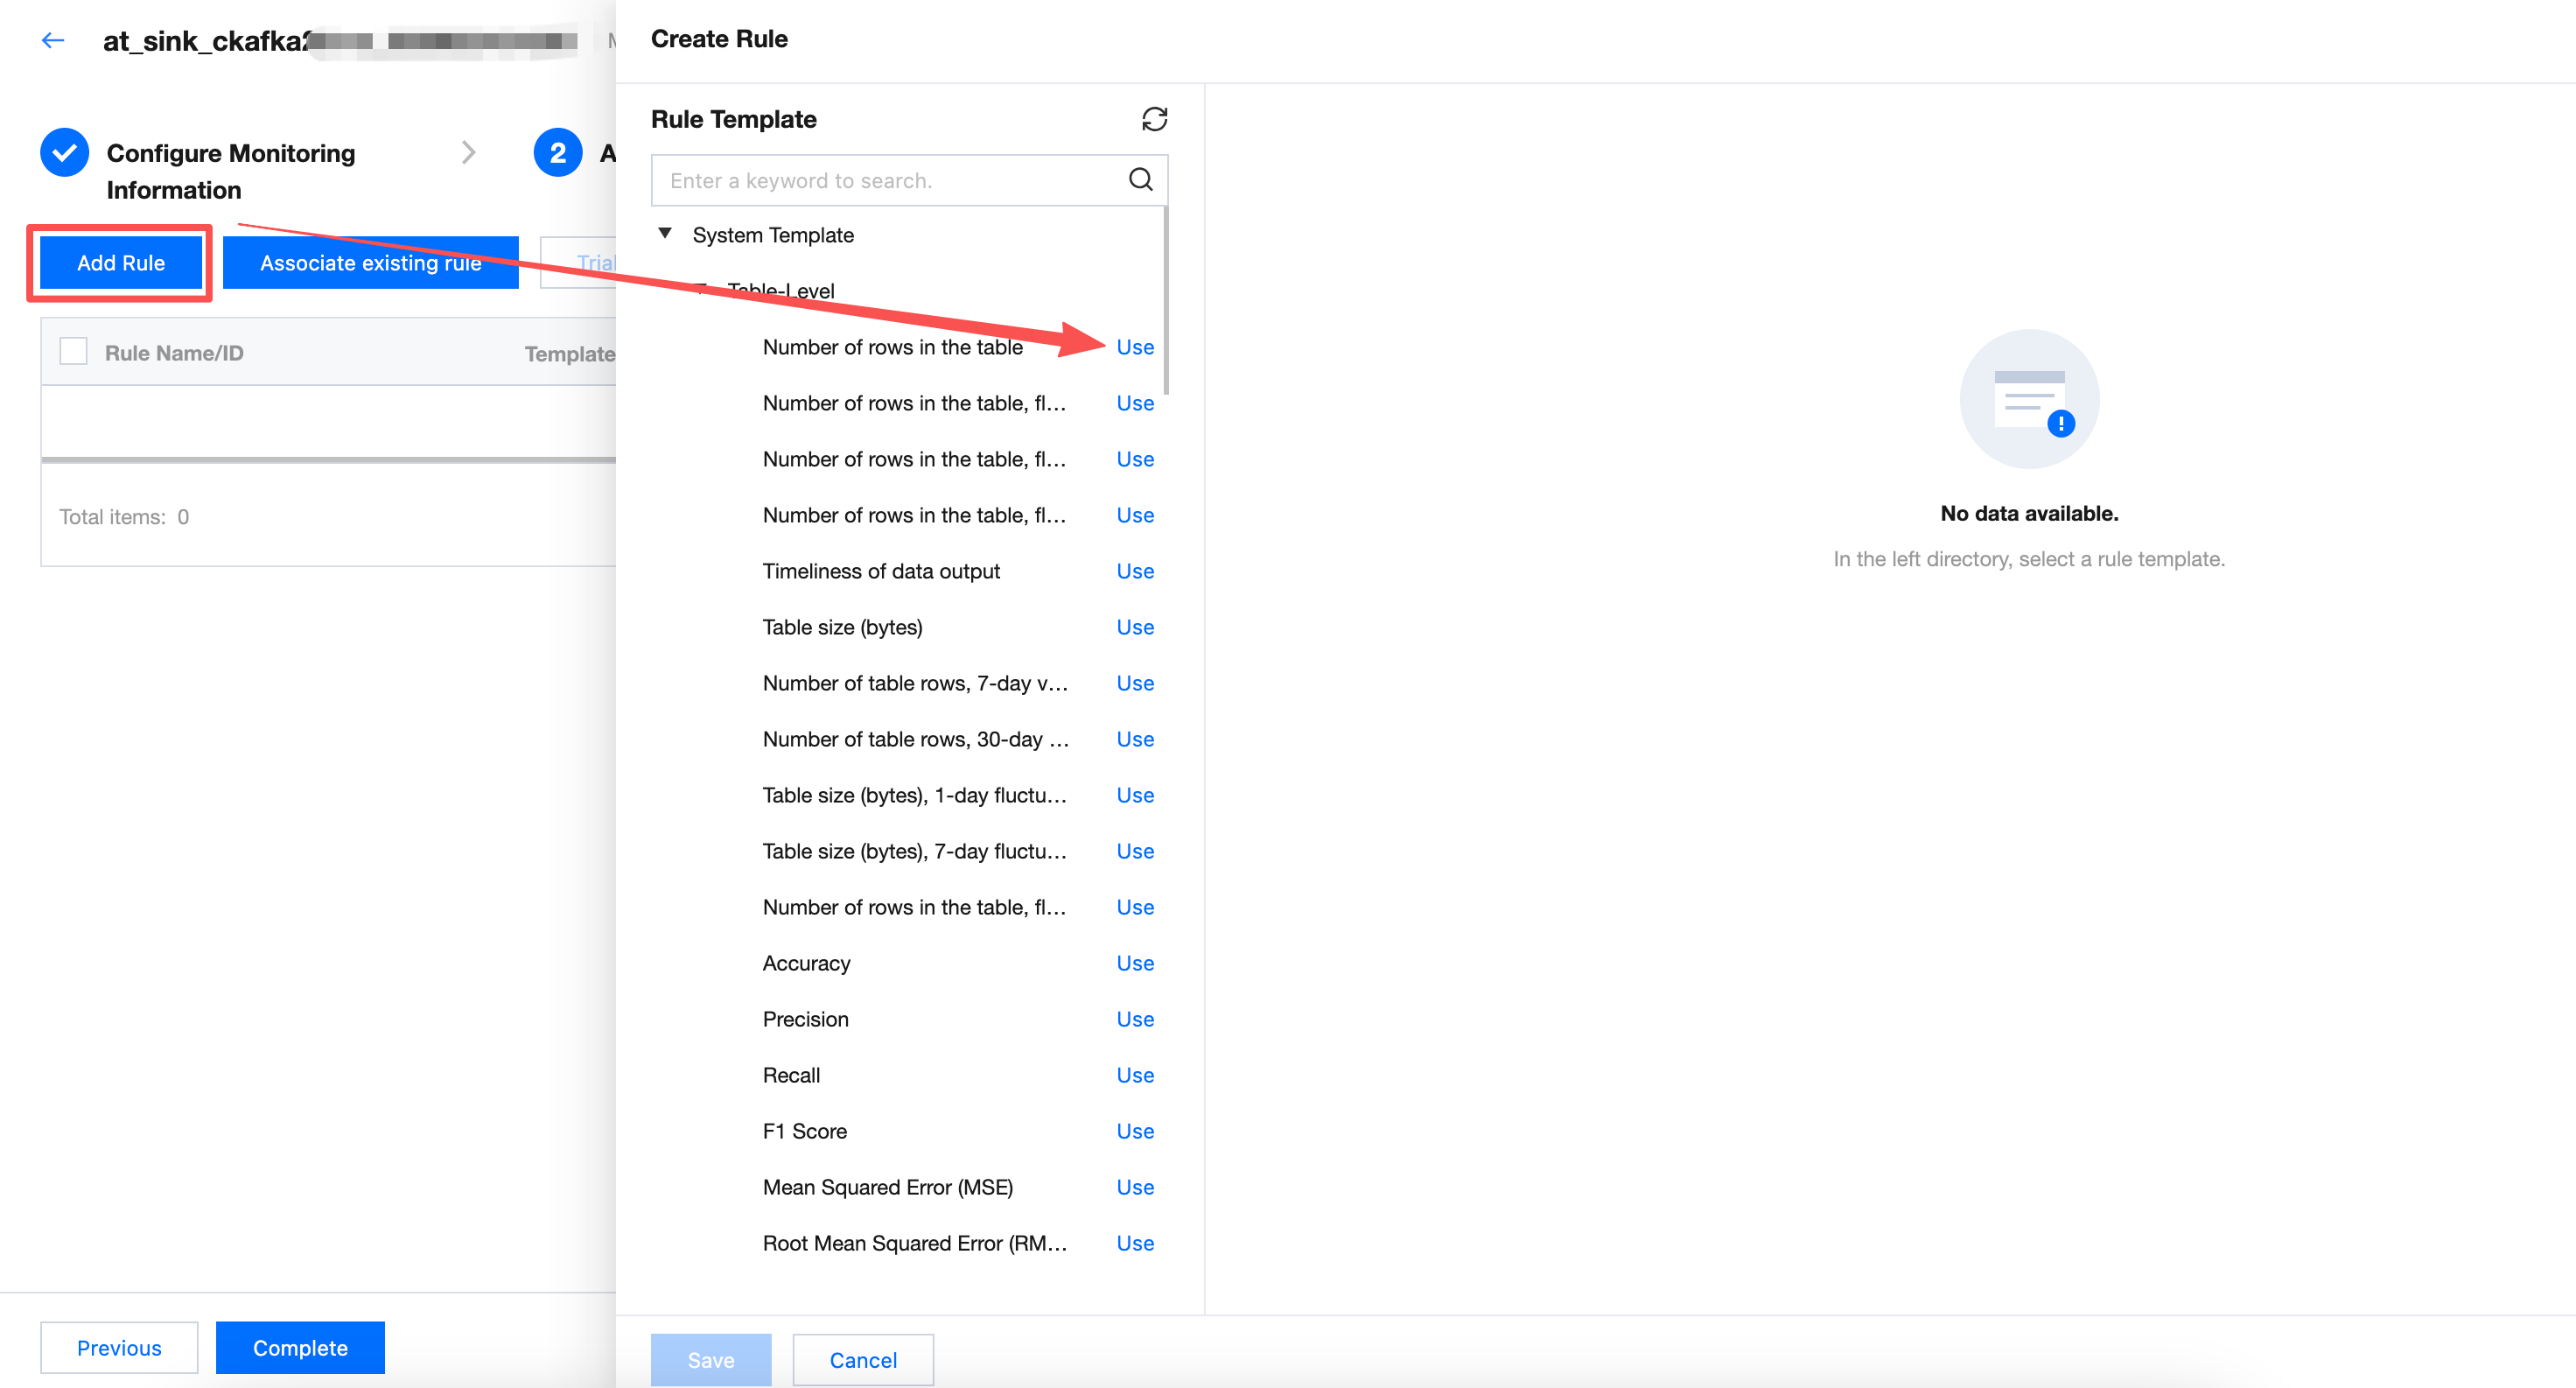
Creating New Rule
Click Create Rule on the rule list, and a pop-up will appear, supporting selection of 1. System Template 2. Custom Template 3. Custom SQL to perform quality validation.
Here you can add multiple rules at once. The newly added rules will be directly associated with this monitor.
Explanation:
Element | Note: |
Rule Type | Select from system template, custom template, or Custom SQL (if you select a rule template from the left-side dendrogram, the selected template parameters are displayed by default here). System template: WeData has built-in 56 rule templates that can be used for free. More details about each template can be found in system template description. Custom template: You can add rules applicable to your own business in the rule template menu for easy reuse. For detailed operation instructions, refer to Custom Template Description. Custom SQL: Directly fill in SQL statement as detection rule. For detailed operation guide, see add quality rules. |
Monitoring Object | Monitoring Object can be divided into: table-level and field-level (if you select a rule template from the left-side dendrogram, the selected template parameters are displayed by default here). Table level, monitoring the number of rows and table size (only supported for Hive tables). Field-level, monitoring whether the field is empty, whether to repeat, average, maximum value, minimum value, etc. |
Select Template | WeData has built-in 56 rule templates that can be used for free. More details about each template can be found in System Template Description. (if you select a rule template from the left-side dendrogram, the selected template parameters are displayed by default here). |
Detection Range | You can choose full table or conditional scan. Full table: The quality rule will verify the full data in the table. Conditional scan: The quality rule will only verify the detection range filled in here. For example:
Note: Here, fill in the partition field to avoid full table scan for every quality task, preventing wastage of computational resources. In SQL, ${yyyy-MM-dd-1d} is a date variable that represents one day before the execution date. It will be replaced with a specific date during Quality Task Execution. For example: When the quality task is executed at 2024-05-02 00:00:00, ${yyyy-MM-dd-1d} will be replaced with 2024-05-01. |
Trigger Condition | Comparison operator: Select less than. Comparison operator: Fill in 1. Number of table rows is less than 1, combined with the time variable filled in the detection range, indicating: when no new data was added yesterday, trigger alarm. Note: The trigger condition filled here is abnormal value, i.e., conditions for triggering alarms. |
Trigger Level | Select Medium. Trigger Level can be divided into: High, Medium, Low. High: When an alarm is triggered, immediately block downstream task execution (valid only when associated with production tasks). Medium: Trigger alarm only. Low: Do not trigger alarm, only show abnormal result display. |
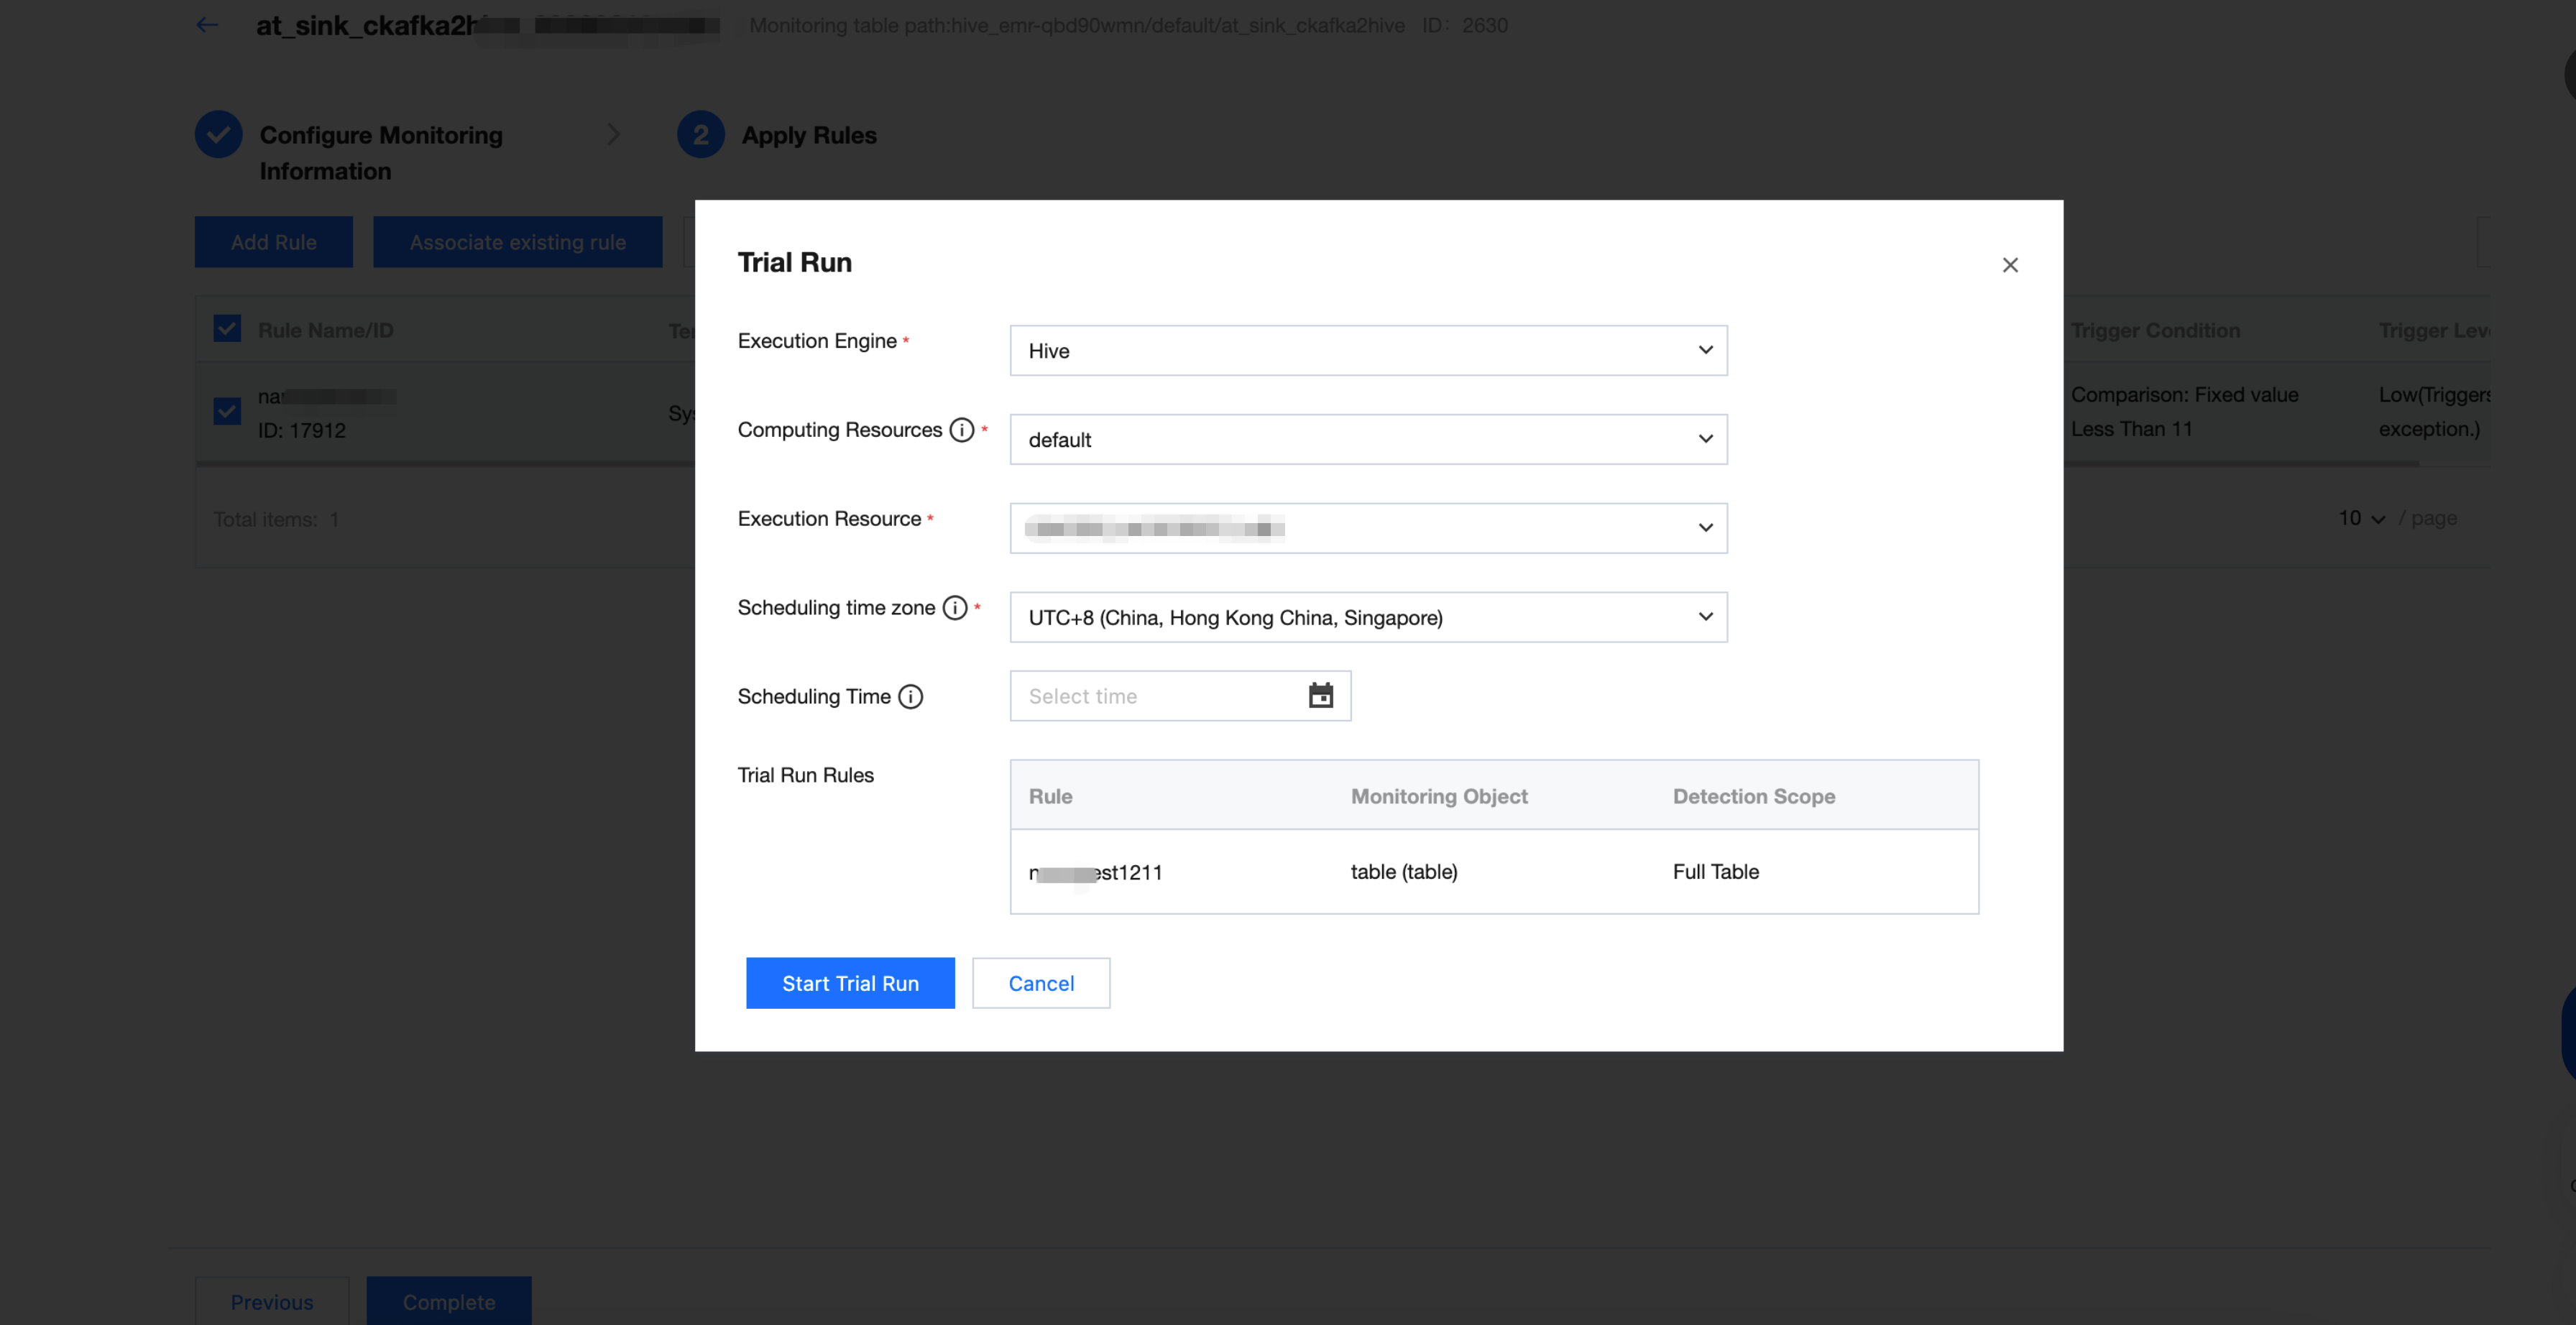
Trial Run
1. Select the rule you hope to trial run, then click Trial Run.
2. Modify the scheduling time, then click Start Trial Run. After the trial run ends, you can click Click to View Operation Results.
Note:
Since the partitioning when inserting data is 2024-05-01, you can fill in 2024-05-02 here.
Viewing Trial Run Results
1. Enter the execution instance and result page, then click on the left dropdown triangle to expand rule details.
2. Click Execution History for a specific monitor to view historical run results.
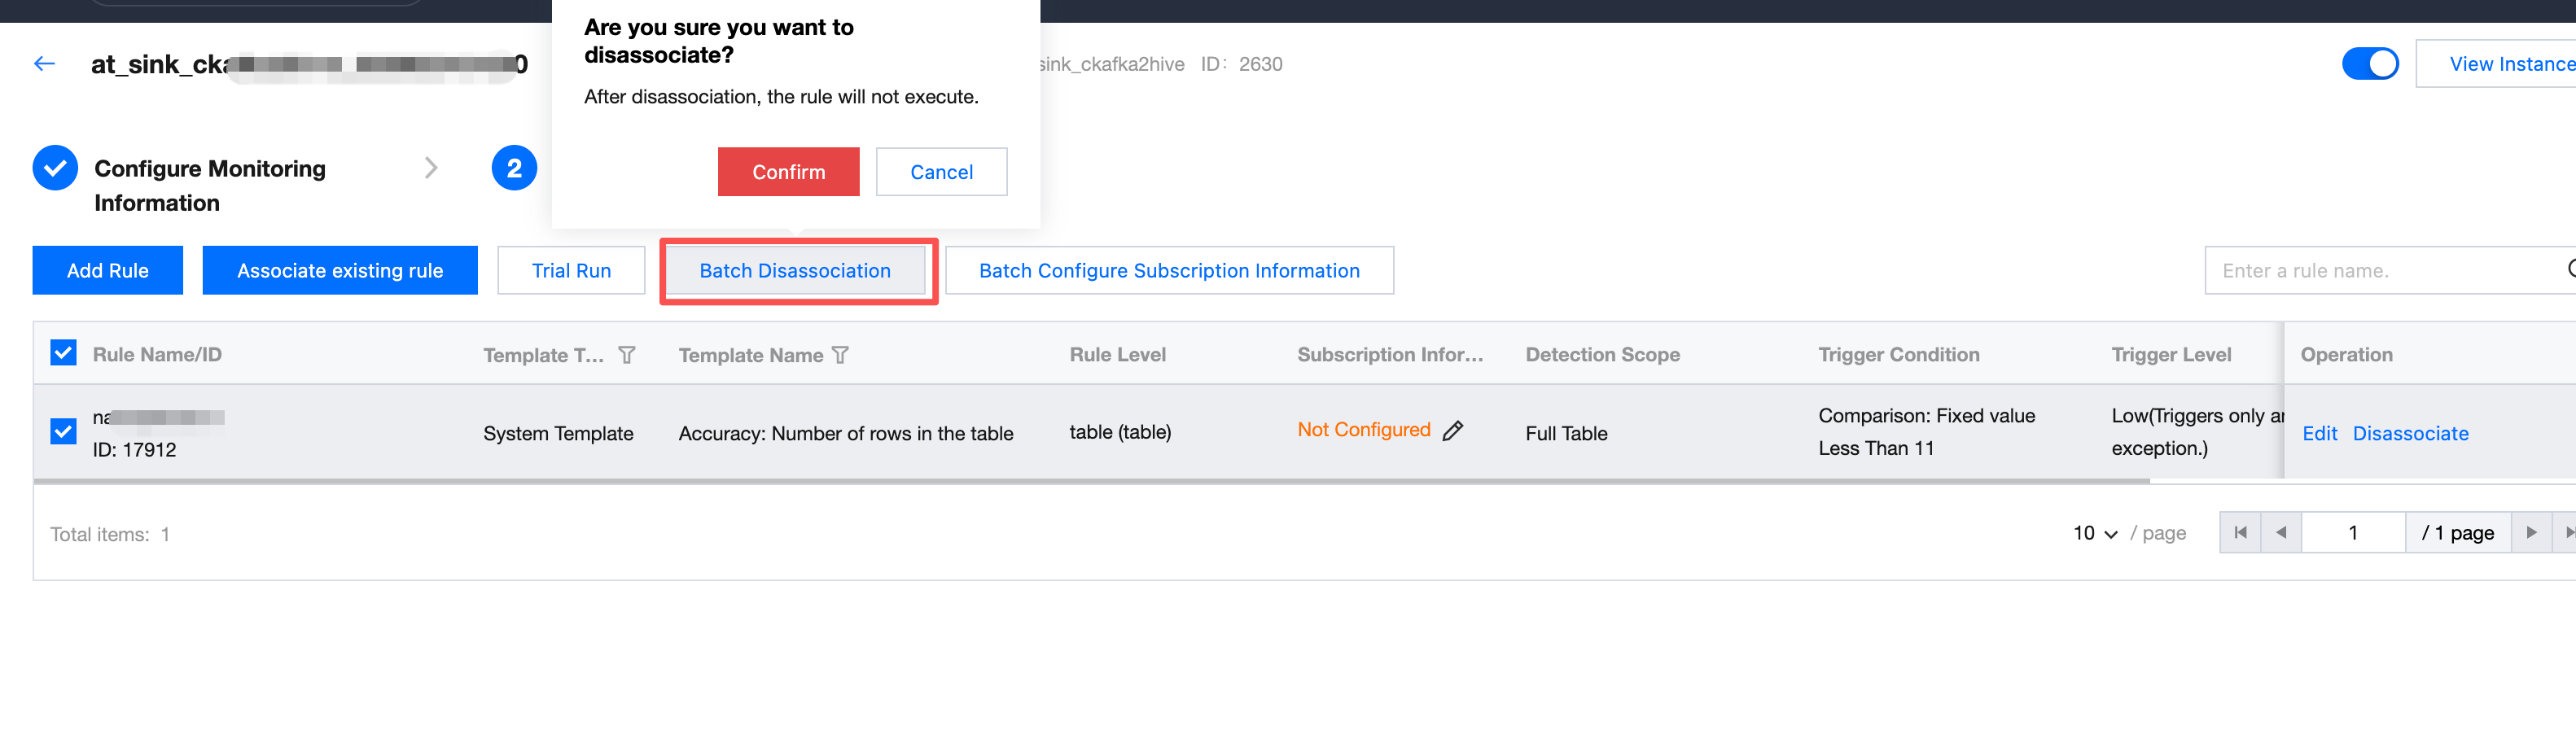
Batch Unbinding
Bulk removal of the correlation between the selected rules and the monitor.
Note:
Quality rules unassociated with monitoring will not execute.
To reassociate this rule, you can operate on the association rule page.
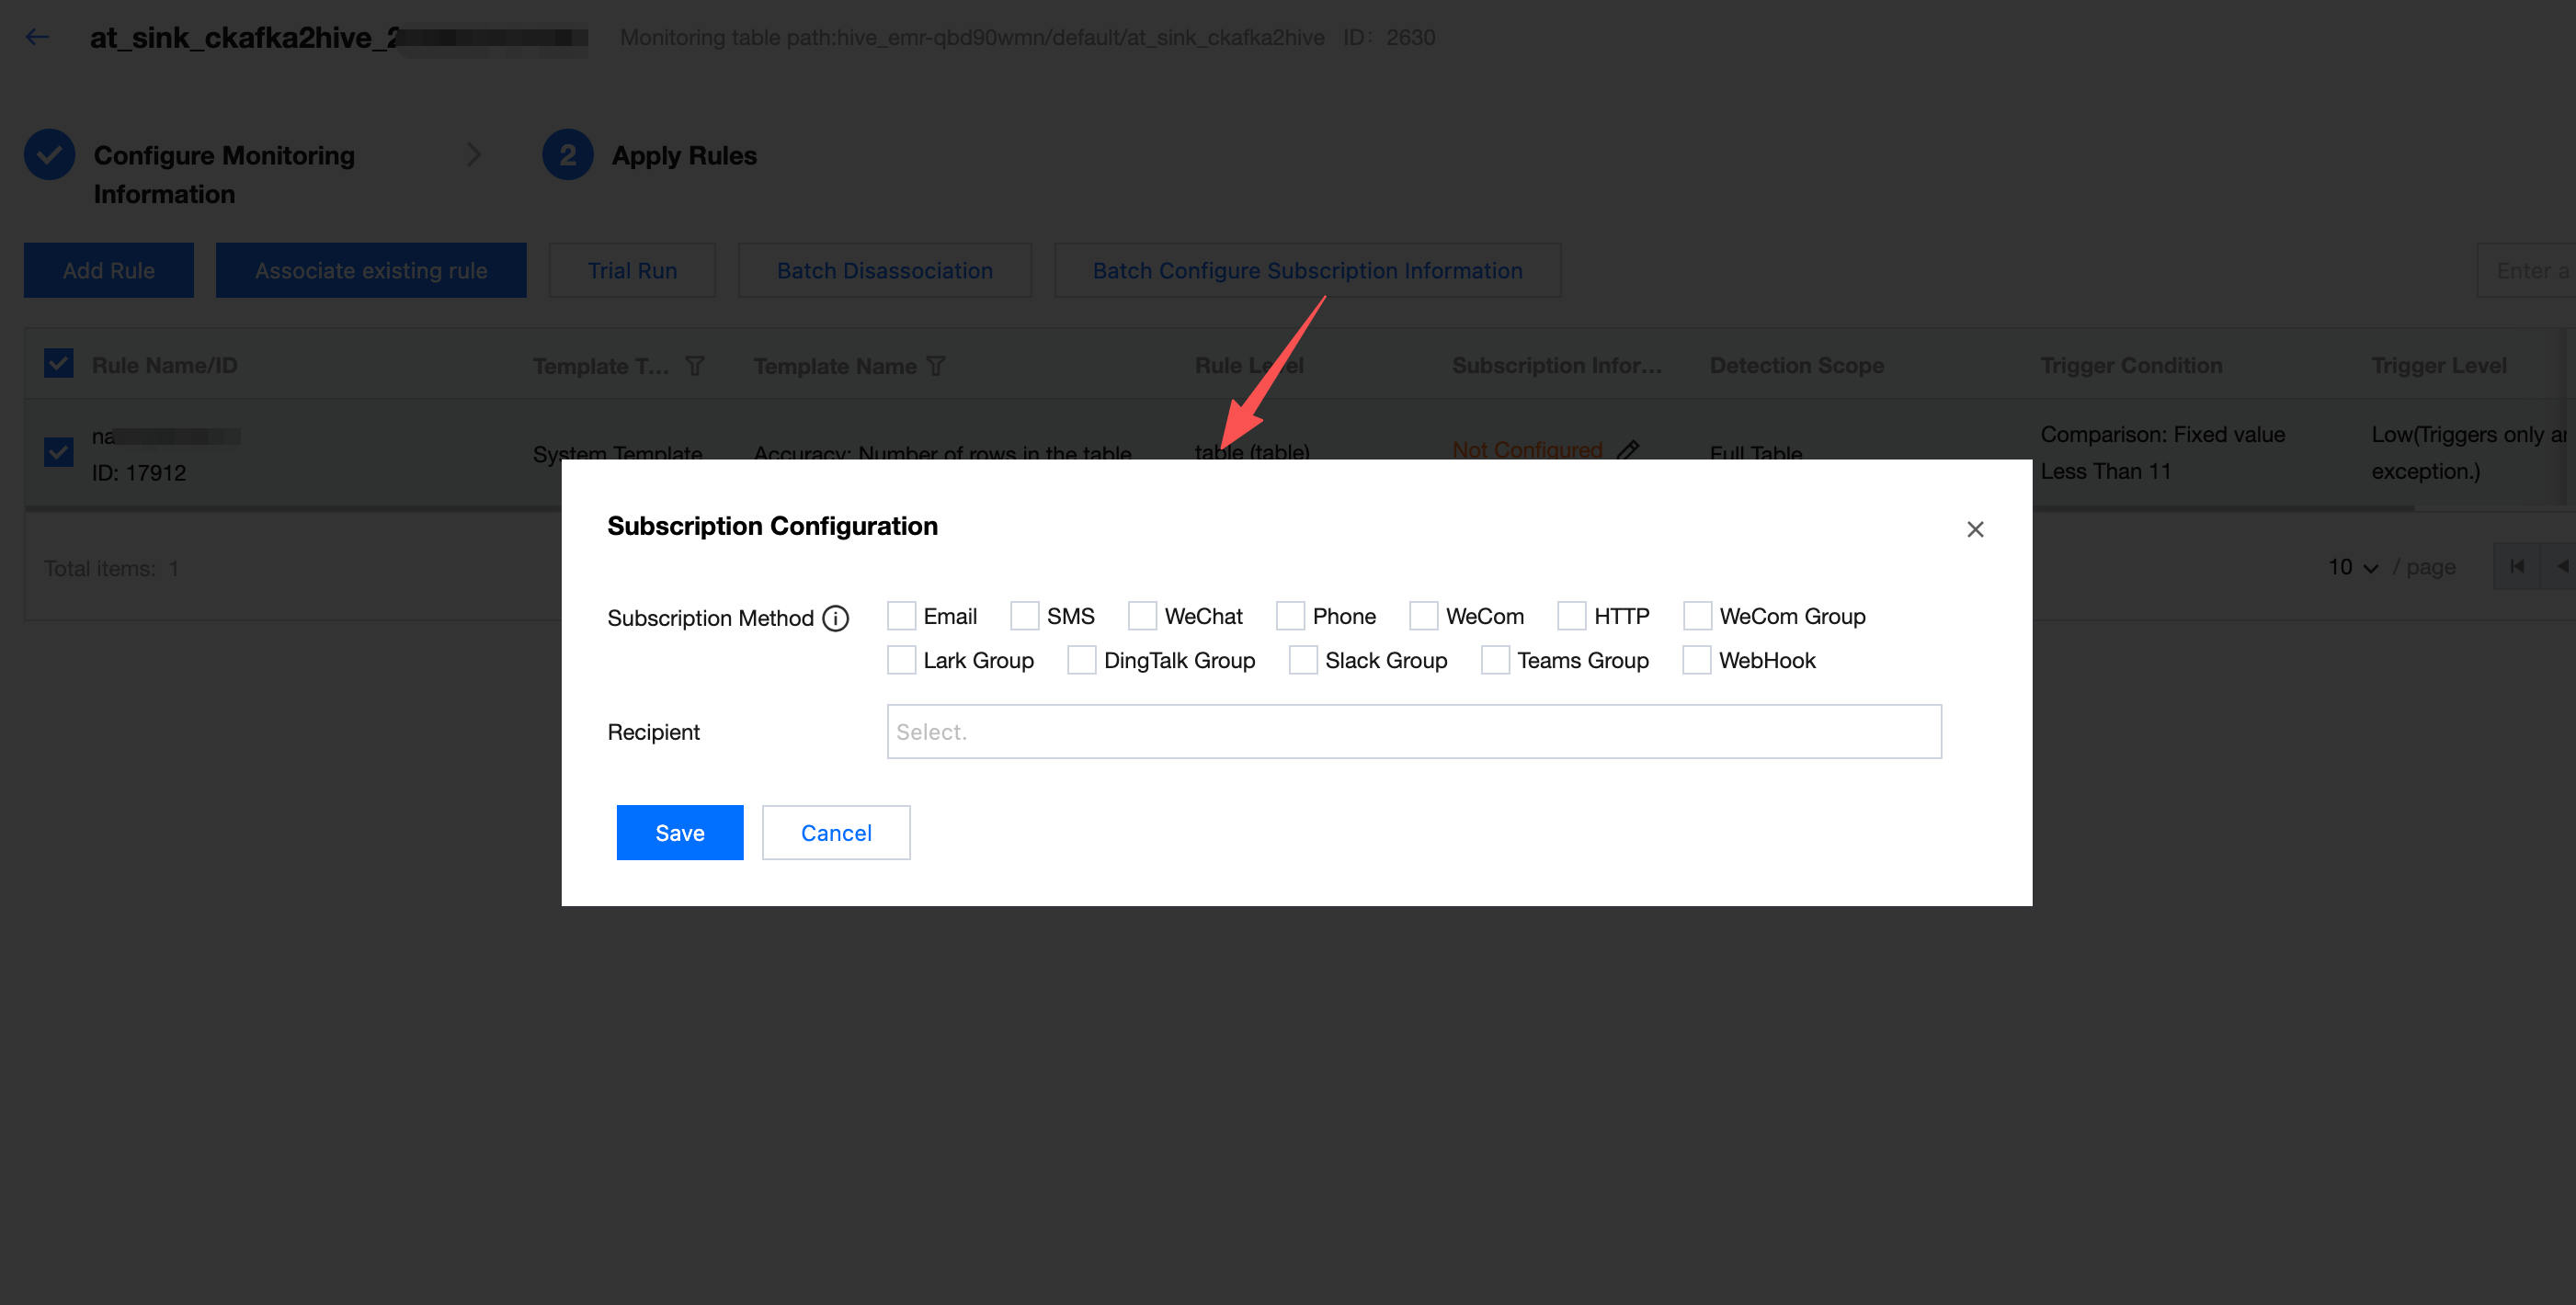
Configuring Subscription
When the task running result of quality inspection meets trigger conditions (result not as expected, detection result failed), what method to send notifications and notify whom.
Enter the Subscription Configuration interface, check the Subscription Method, set up the Recipient, and click Save.
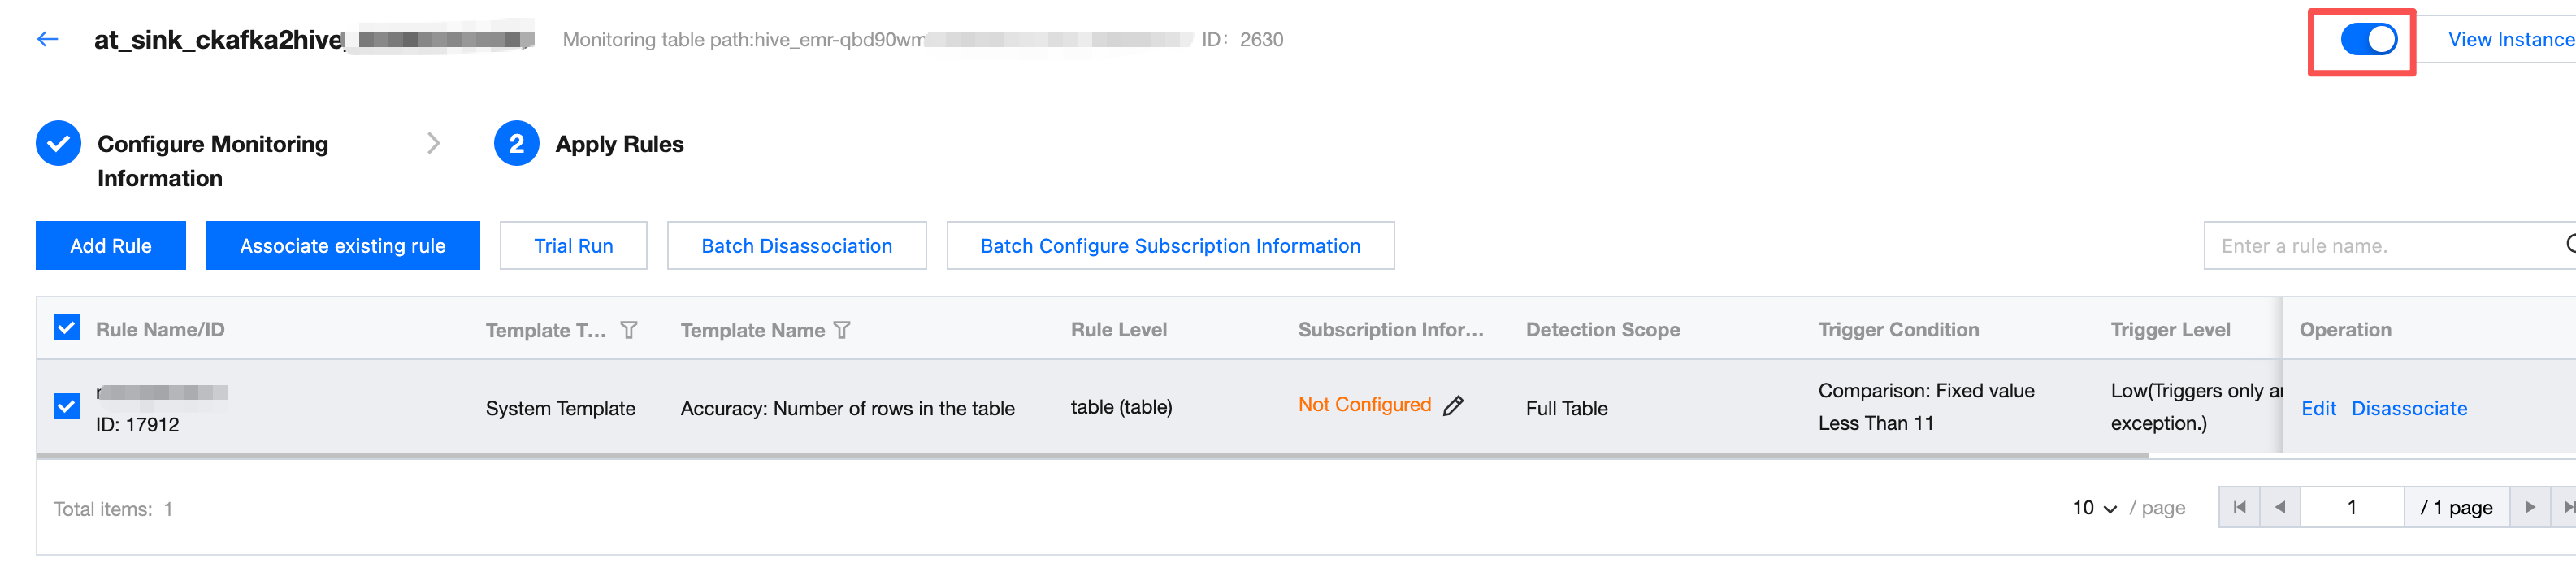
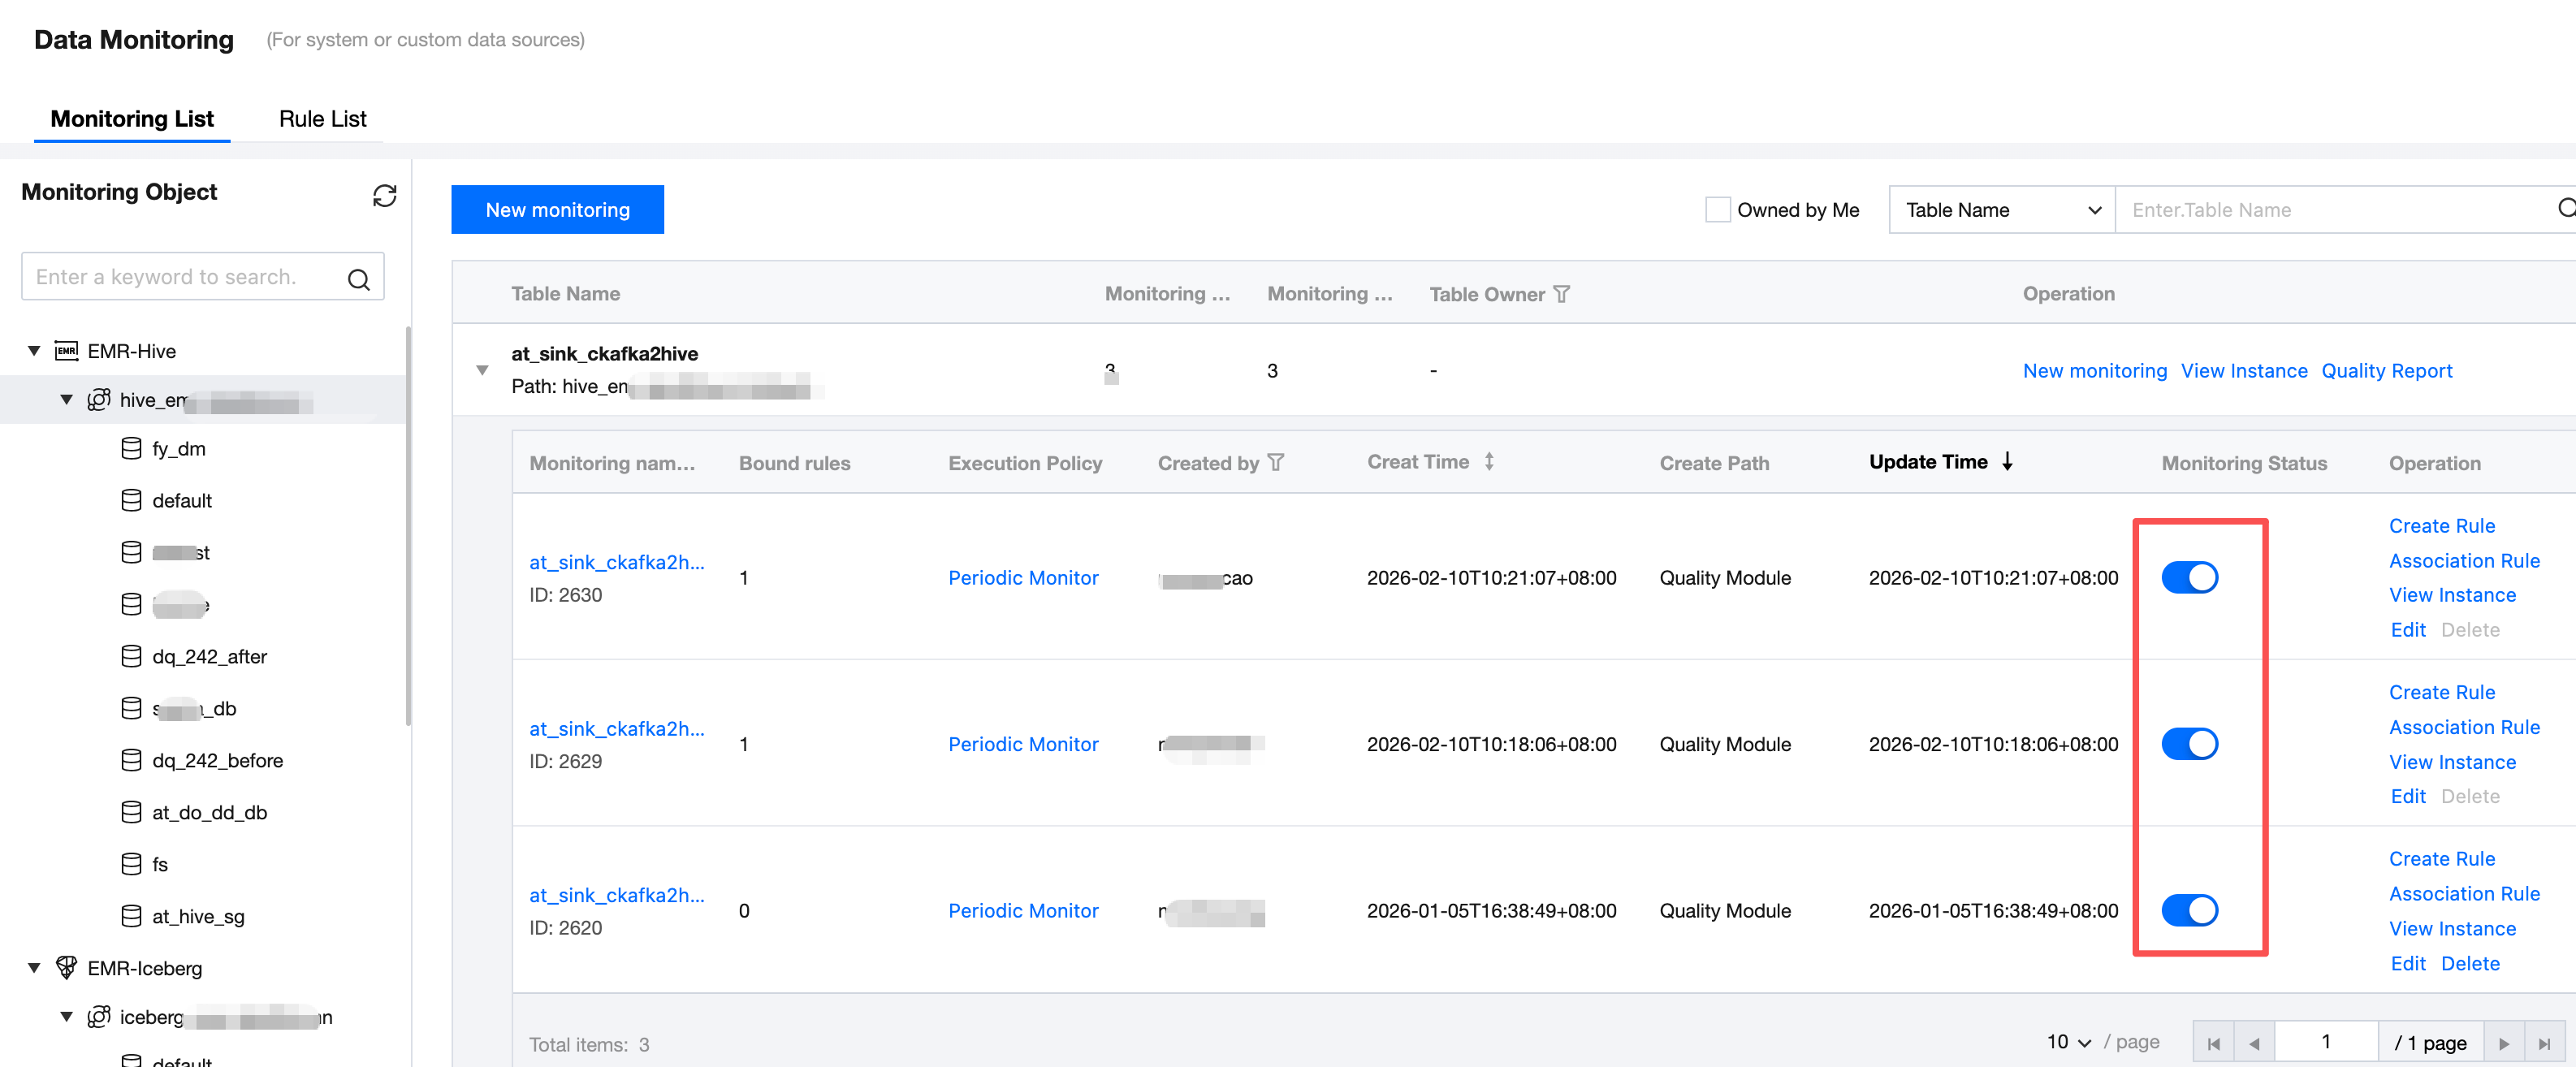
Enabling Monitoring
Based on the trial run result of monitoring, you can enable or disable monitoring in the monitoring status column (monitoring is enabled by default after creation).
Note:
Only monitoring tasks in enabled state will automatically run.
Viewing Task Execution Result
When the quality task execution is complete, if the detection result is abnormal, the system will automatically send an alarm and block downstream tasks for high-trigger-level tasks.
For database table owners and data development engineers, promptly troubleshoot exceptions and solve problems.
1. On the data quality > Ops management > execution instance and results page, select data sources and database in sequence to view task execution results.
2. On this page, you can view the task detection status and expand the left dropdown triangle to view the results and logs of each rule.
Note:
Detection status is divided into two categories:
Instance execution status:
Waiting to run: The scheduling task instance is waiting on the scheduling side to run.
Executing: The scheduling task instance is in progress.
Success: The scheduling task instance is distributed successfully.
Failure: Scheduling task instance distribution failed (possible reasons: execution machine environment impact, manual user termination, business exception reporting)
Detection status:
Normal: After successful execution of all rules under the current instance, the detection result is all in normal status.
Abnormal: If any rule under the current instance is triggered, it is deemed abnormal.
Detecting: Rules under the instance are executing
Not detected: The rule has not yet started execution or execution was unsuccessful.
피드백