Scheme Overview
Download
Focus Mode
Font Size
Background information
Currently, users can only obtain the server-side monitoring data of Distributed Cache, but cannot capture the full-link latency from client request to response. When latency issues occur, the lack of client-side latency data makes it difficult to quickly identify the root cause. Additionally, sporadic latency jitter is hard to capture, and the absence of historical data hinders retrospective analysis. Operations engineers can only rely on tools like packet capture for troubleshooting, resulting in low efficiency and high costs.
Scheme Overview
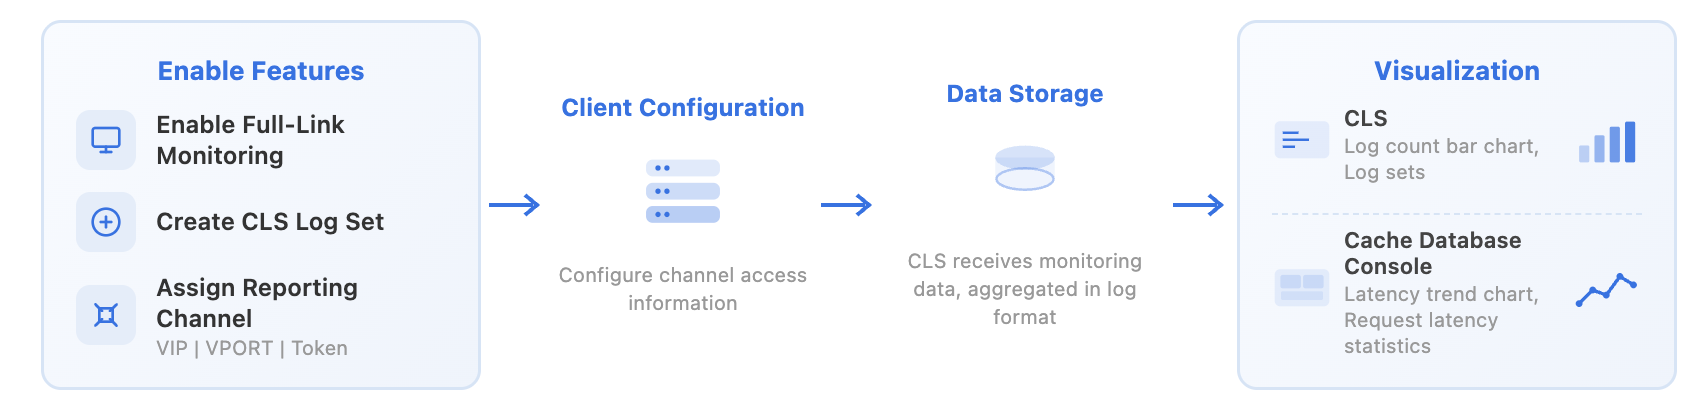
The Full-Link Analysis feature is designed to centrally deliver the full-lifecycle latency data from all Distributed Cache instances under a Tencent Cloud account to Cloud Log Service (CLS) for centralized analysis. CLS collects and stores Distributed Cache monitoring data in a structured format, converting scattered latency metrics into a unified log format for display. This enables comprehensive monitoring and in-depth performance analysis of Distributed Cache.
Note:
Currently, this feature only supports client-side scenarios using the Spring Boot + Lettuce framework.
Stage | Main Feature | |
Creates logsets. | Creates a CLS logset for storing monitoring data in a log-structured manner. | |
| Allocates a dedicated channel for reporting monitoring data. | The system automatically allocates a dedicated reporting channel based on the VPC and returns the following information: VIP: channel access address. VPORT: channel access port. Token: reporting authentication credential. |
Configuring the Environment | The full-link monitoring function supports only the Spring Boot + Lettuce framework. The component version requirements are as follows: Lettuce: 6.4.2.RELEASE and above. Spring Boot: 3.4.3 and above. | |
| Configure reporting parameters | Configure dedicated channel access address and authentication Token. Configure the request latency metrics to be reported. |
Data processing | Data collection and reporting | Lettuce performs latency statistics for each command and aggregates the latency of the same type of commands within the statistical window. Spring Boot reports latency data via the OTLP (OpenTelemetry Protocol). Note: OTLP, as the standard transmission protocol for the OpenTelemetry project, boasts efficient and scalable characteristics. It accurately captures latency information for each Distributed Cache operation, including key metrics such as command execution time and network transmission latency. |
| Data aggregation storage | CLS performs aggregation calculations on raw monitoring metrics based on time windows. Stores monitoring data in a (Key-Value) log-structured format to facilitate search queries and data analysis. |
CLS log set | Visually displays log distribution and latency changes in the form of bar charts. The display of monitoring data in log sets supports search and analysis. | |
| Provide an end-to-end view. | Based on aggregated monitoring data, the Distributed Cache console provides full-link visualization: Latency trend chart: Displays latency change trends over time to help identify performance fluctuations. Monitoring log table: Statistically displays detailed latency data for each request in tabular format. |
Help and Support
Was this page helpful?
You can also Contact sales or Submit a Ticket for help.
Help us improve! Rate your documentation experience in 5 mins.
Feedback