This document describes the use cases and operations directions of pie charts.
Use Cases
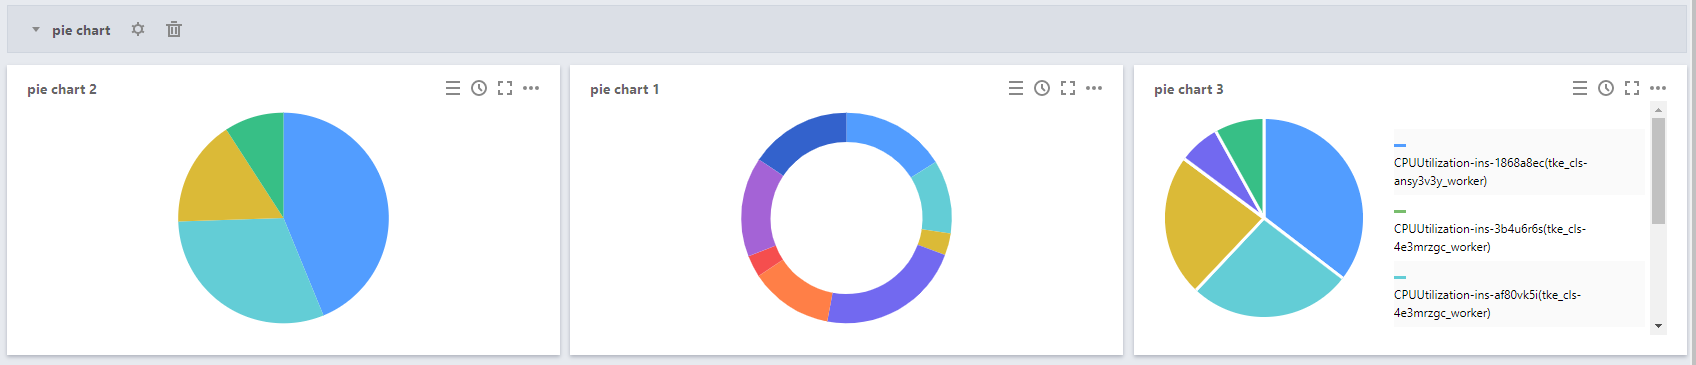
Pie chart: can clearly show the proportion of each instance regarding the same metric. Pie charts can be used when you want to view the proportion of each instance regarding the same metric without requiring an elaborate display of data.
Configuration effects of pie charts:
Directions
1. Log in to the Tencent Cloud Observability Platform console and click Dashboard > Default Dashboard on the left sidebar.
2. Click
> Create a Chart to go to the chart editing page.
3. In the chart configuration module, select “Pie Chart” as the chart type.
4. Configure the pie chart information as follows:
Chart elements
Pie type: indicates the pie chart display mode, which can be the doughnut chart mode or the pie chart mode.
Statistical mode: indicates the metric statistical mode, which can be the current value, the minimum value, the maximum value, the average value, or the sum.
Sort by: indicates the mode in which the proportions of different instances in the metric data are sorted. The value can be default (automatic sorting by the system), ascending, or descending.
Unit: indicates whether to display the unit of the statistical value. For more information on the meanings of different units, see “List of Units” in Step 2: Configure the chart.
Gap width: indicates whether a gap is required between sections in a pie chart. The value can be no gap or 1px to 5px. A greater value indicates a larger gap.
Precision: indicates the number of decimal places to be retained for the metric statistical value. 0: do no retain any decimals. 1: retain one decimal place.
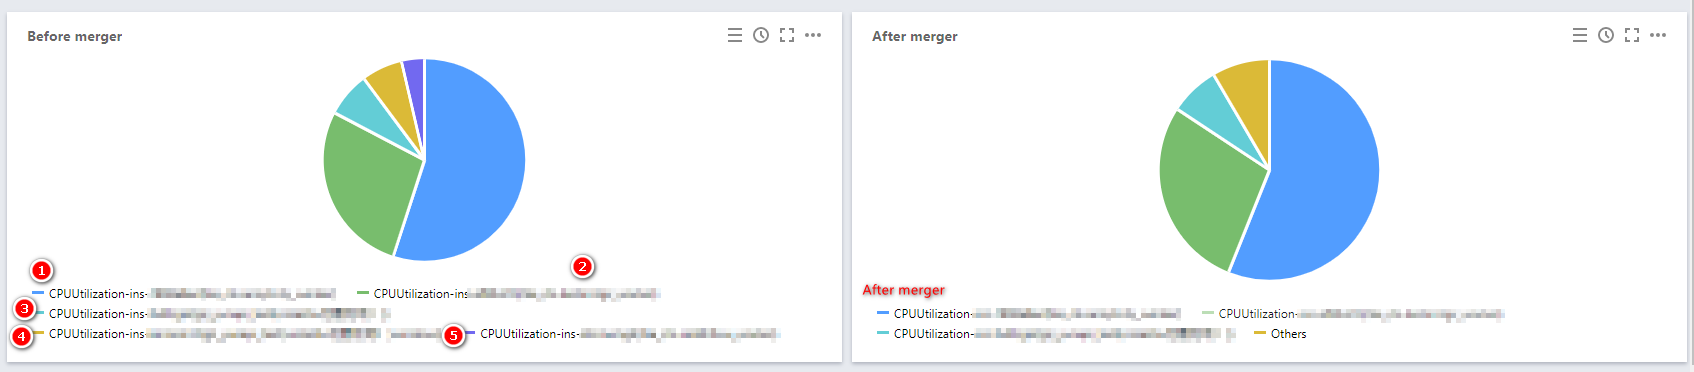
Merge: indicates whether to merge the numerical metric values of different instances. For example, if you enter 3, the numerical metric values of instances numbered later than 3 will be merged. In the following figure, Merge is set to 3 as an example, which means that the data of instances ④ and ⑤ are merged as other data.
Legend configuration
You can specify the display positions of legends.
Show: indicates whether to show legends in charts.
Table Type: can be the maximum value, the minimum value, the average value, or the current value. After you select a table type, the data will be sorted by this type.
Put on the Right: indicates whether to place the instances, the maximum value, the minimum value, the average value, and the current value on the right side of charts. By default, they are placed below charts.
Max, Min, Avg, Sum, and Current Value: indicates whether to display the maximum value, the minimum value, the average value, the sum, and the current value below charts.
Precision: indicates the number of decimal places to be retained for the maximum value, the minimum value, the average value, the sum, and the current value. 0: do no retain any decimals. 1: retain one decimal place.