tencent cloud

Tencent Cloud Observability Platform

Release Notes and Announcements
Release Notes
Product Introduction
Overview
Strengths
Basic Features
Basic Concepts
Use Cases
Use Limits
Purchase Guide
Tencent Cloud Product Monitoring
Application Performance Management
Mobile App Performance Monitoring
Real User Monitoring
Cloud Automated Testing
Prometheus Monitoring
Grafana
EventBridge
PTS
Quick Start
Monitoring Overview
Instance Group
Tencent Cloud Product Monitoring
Application Performance Management
Real User Monitoring
Cloud Automated Testing
Performance Testing Service
Prometheus Getting Started
Grafana
Dashboard Creation
EventBridge
Alarm Service
Cloud Product Monitoring
Tencent Cloud Service Metrics
Operation Guide
CVM Agents
Cloud Product Monitoring Integration with Grafana
Troubleshooting
Practical Tutorial
Application Performance Management
Product Introduction
Access Guide
Operation Guide
Practical Tutorial
Parameter Information
FAQs
Mobile App Performance Monitoring
Overview
Operation Guide
Access Guide
Practical Tutorial
Tencent Cloud Real User Monitoring
Product Introduction
Operation Guide
Connection Guide
FAQs
Cloud Automated Testing
Product Introduction
Operation Guide
FAQs
Performance Testing Service
Overview
Operation Guide
Practice Tutorial
JavaScript API List
FAQs
Prometheus Monitoring
Product Introduction
Access Guide
Operation Guide
Practical Tutorial
Terraform
FAQs
Grafana
Product Introduction
Operation Guide
Guide on Grafana Common Features
FAQs
Dashboard
Overview
Operation Guide
Alarm Management
Console Operation Guide
Troubleshooting
FAQs
EventBridge
Product Introduction
Operation Guide
Practical Tutorial
FAQs
Report Management
FAQs
General
Alarm Service
Concepts
Monitoring Charts
CVM Agents
Dynamic Alarm Threshold
CM Connection to Grafana
Documentation Guide
Related Agreements
Application Performance Management Service Level Agreement
APM Privacy Policy
APM Data Processing And Security Agreement
RUM Service Level Agreement
Mobile Performance Monitoring Service Level Agreement
Cloud Automated Testing Service Level Agreement
Prometheus Service Level Agreement
TCMG Service Level Agreements
PTS Service Level Agreement
PTS Use Limits
Cloud Monitor Service Level Agreement
API Documentation
History
Introduction
API Category
Making API Requests
Monitoring Data Query APIs
Alarm APIs
Legacy Alert APIs
Notification Template APIs
TMP APIs
Grafana Service APIs
Event Center APIs
TencentCloud Managed Service for Prometheus APIs
Monitoring APIs
Data Types
Error Codes
Glossary

CVM Node Exporter

PDF
포커스 모드
폰트 크기
마지막 업데이트 시간: 2025-08-29 18:16:34
This document describes how to install Node Exporter to expose CVM basic metrics to TMP.

Directions

Step 1. Download and install Node Exporter

Download and install Node Exporter (used to collect basic metric data) in the target CVM instance. Click here or run the following command for download:
wget https://rig-intl-1258344699.cos.ap-singapore.myqcloud.com/prometheus-agent/node_exporter -O node_exporter
The file directory is as follows:


Step 2. Run Node Exporter to collect basic monitoring data

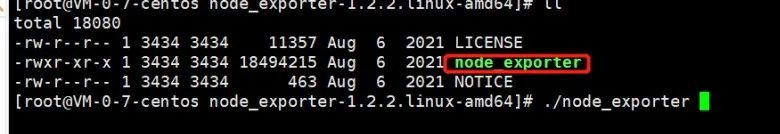
1. Go to the target folder and run Node Exporter.
cd node_exporter-1.3.1.linux-amd64
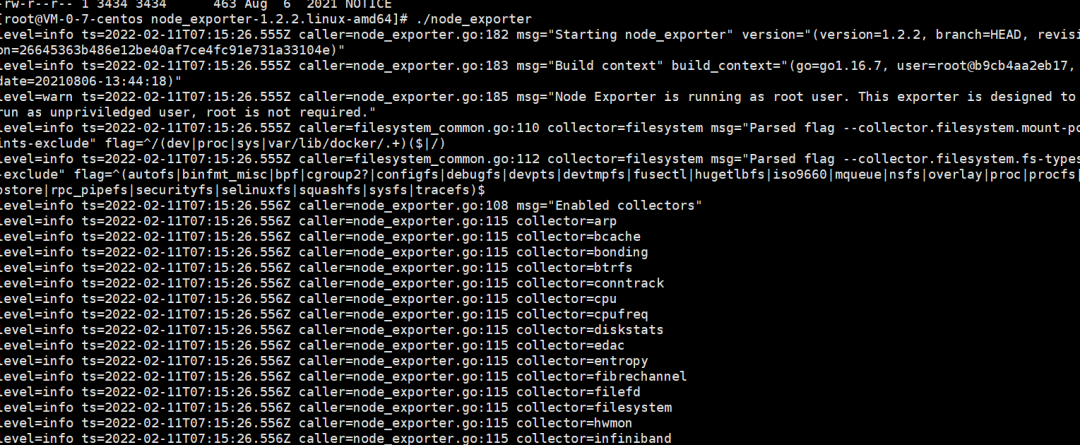
./node_exporter
If the following result is displayed, basic monitoring data has been collected successfully.


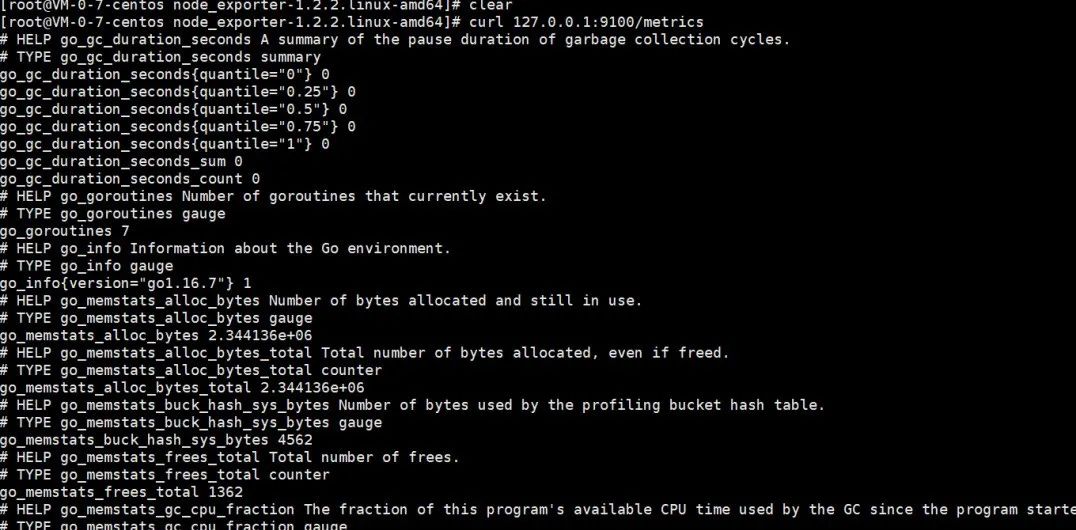
2. Run the following command to expose the basic monitoring data to port 9100:
curl 127.0.0.1:9100/metrics
You can see the following metric monitoring data that is exposed after the command is executed.


Step 3. Configure the collection

Log in to the TMP console, select Integration Center > CVM, and configure the information in Task Configuration as prompted. Below is a sample configuration of a scrape task:
job_name: example-job-name
metrics_path: /metrics
cvm_sd_configs:
- region: ap-guangzhou
ports:
- 9100
filters:
- name: tag: Sample tag key
values:
- Sample tag value
relabel_configs:
- source_labels: [__meta_cvm_instance_state]
regex: RUNNING
action: keep
- regex: __meta_cvm_tag_(.*)
replacement: $1
action: labelmap
- source_labels: [__meta_cvm_region]
target_label: region
action: replace

Step 4. Check whether data is reported successfully

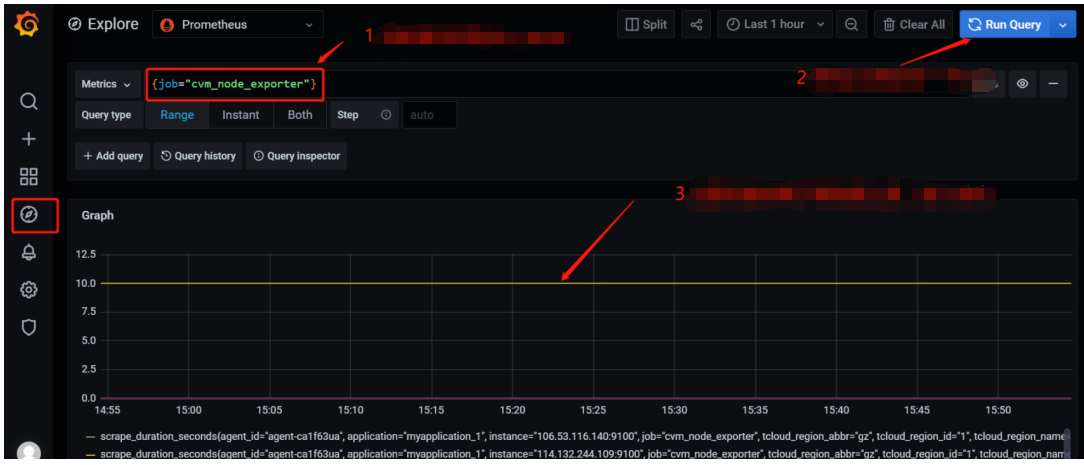
Log in to the TMP console and click the Grafana icon to enter Grafana. Search for {job="cvm_node_exporter"} in Explore to see whether there is data, and if so, data is reported successfully.


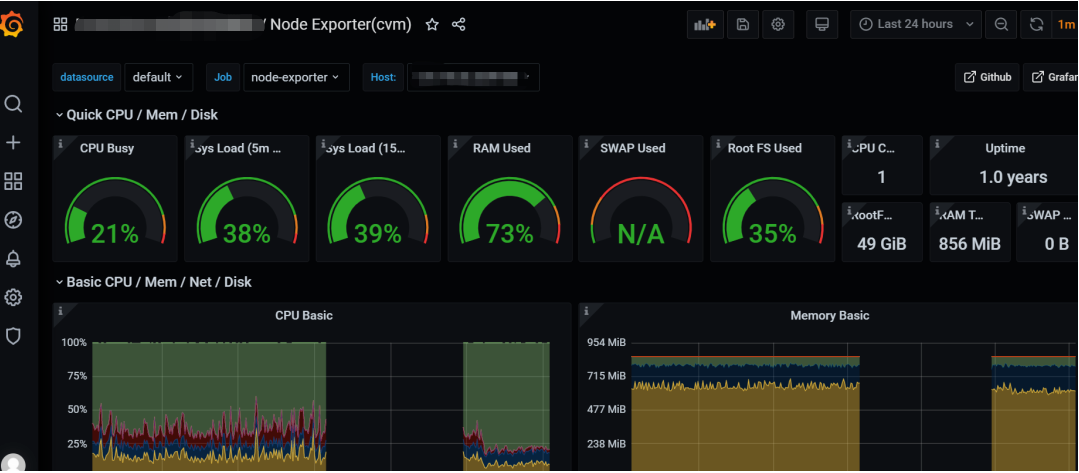
Step 5. Configure the dashboard

Every product has some existing JSON files that can be directly imported into the dashboard.
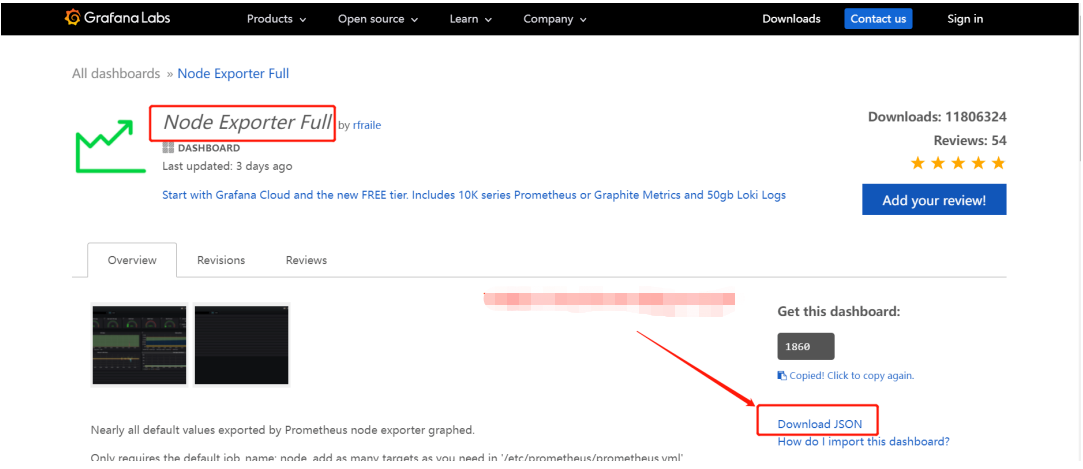
1. Download a dashboard file: Go to the Dashboard page, search for node_exporter, and select the latest dashboard for download.


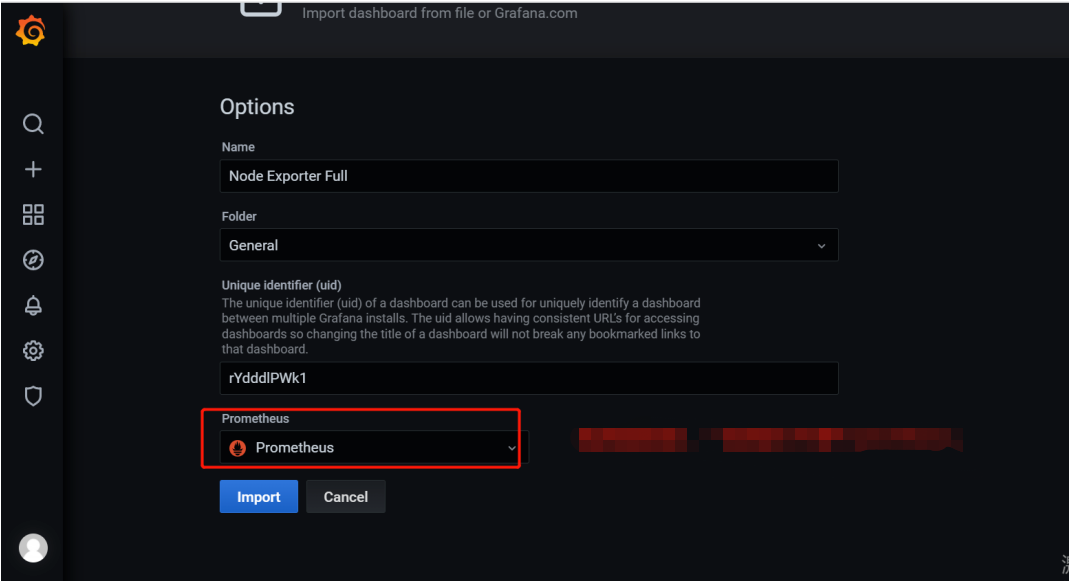
2. Import a JSON file into the dashboard: Log in to the TMP console, select Basic Info > Grafana Address to enter Grafana. In the Grafana console, select Create > Import and upload the dashboard file in Upload JSON file.


도움말 및 지원

문제 해결에 도움이 되었나요?

피드백