Release Notes
Nacos Integration
Scenarios
This document aims to guide you to quickly collect Nacos monitoring data. Regardless of whether Nacos is deployed on a standalone server or in a Kubernetes cluster, you can easily obtain the node running status and metric information by following the instructions below.
Operation Steps
Exposing Monitoring Metrics for Nacos
This section explains how to enable Prometheus monitoring metric exposure for the Nacos service in the Traditional Edition Deployment, Docker Deployment, and Kubernetes Deployment environments. The instructions apply to both the standalone mode and the cluster mode. In the cluster mode, you need to identify the nodes to be collected in advance, and ensure that all the nodes to be collected have completed the corresponding metric exposure configuration.
1. Locate the application.properties file in the conf folder under the Nacos installation directory. Example path:
{NACOS_HOME}/conf/application.properties
{NACOS_HOME} is the actual path where Nacos is installed.
2. Add the following configurations at the end of the .properties file (if the configurations already exist, modify the configurations to match the following):
management.endpoints.web.exposure.include=prometheus
3. Save the file, and restart the Nacos service to apply the configurations.
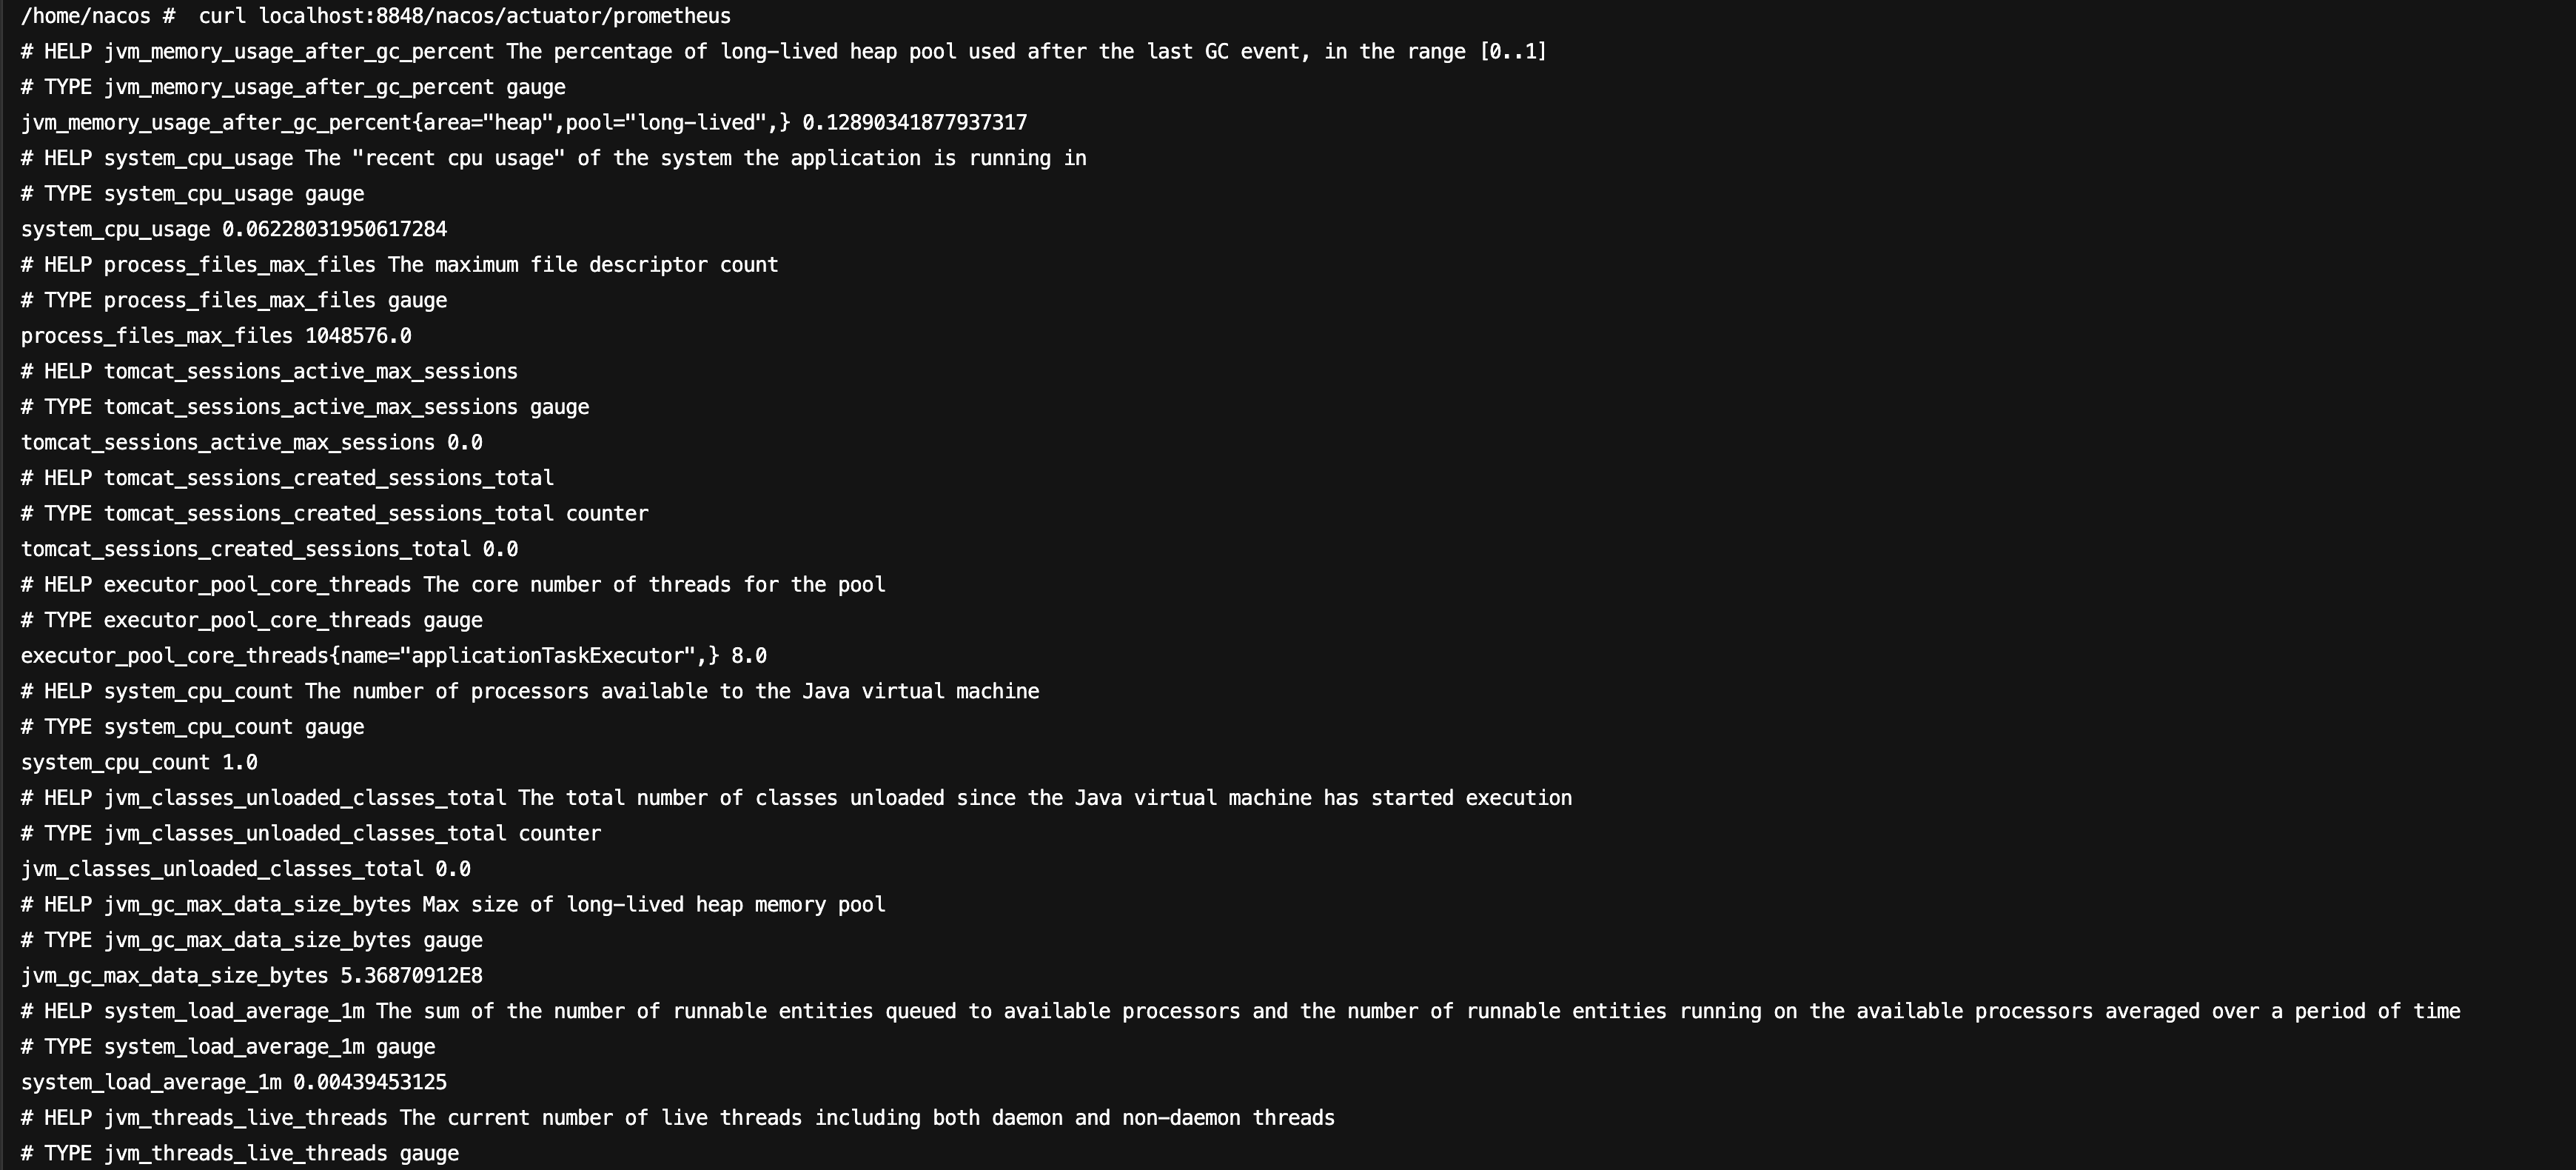
4. After the service starts, run the following command on the host to check whether metrics data has been generated.
curl localhost:8848/nacos/actuator/prometheus
The command execution result is as follows:

1. Inject environment variables.
Configuration method 1: Inject environment variables via docker-compose. A docker-compose.yml example is shown below.
version: "3"services:nacos:image: nacos/nacos-server:latestcontainer_name: nacosports:- "8848:8848"environment:# ...# Add this environment variable.- management.endpoints.web.exposure.include=prometheus# ...
Configuration method 2: Inject environment variables via docker run. When running the Nacos container, directly use the -e parameter to set the required environment variables for the container.
docker run -d \\--name nacos \\-e management.endpoints.web.exposure.include=prometheus \\-p 8848:8848 \\nacos/nacos-server:latest
2. After the container starts, enter the container, and run the following command to confirm whether metrics data has been generated.
curl localhost:8848/nacos/actuator/prometheus
The command execution result is as follows:

1. In a Kubernetes environment, monitoring metrics can be exposed by adding environment variables.
kind: StatefulSetapiVersion: apps/v1metadata:name: nacosnamespace: publicspec:replicas: 3selector:matchLabels:app: nacostemplate:metadata:labels:app: nacosspec:containers:- name: nacosimage: nacos/nacos-server:latestenv:#...# Add this environment variable.- name: management.endpoints.web.exposure.includevalue: 'prometheus'#...
2. After an environment variable is added, the Nacos service will restart. After the restart, enter the Pod, and run the following command to check whether metrics data is available:
curl localhost:8848/nacos/actuator/prometheus
The command execution result is as follows:
Configuring Collection
1. Log in to the TMP console.
2. Select the corresponding Prometheus instance from the instance list.
3. Go to the instance details page, and choose Data Collection > Integration Center.
4. Locate and click Nacos in the Integration Center. An installation window will pop up. On the installation page, fill in the integration name and select the deployment method. The configuration methods are as follows.
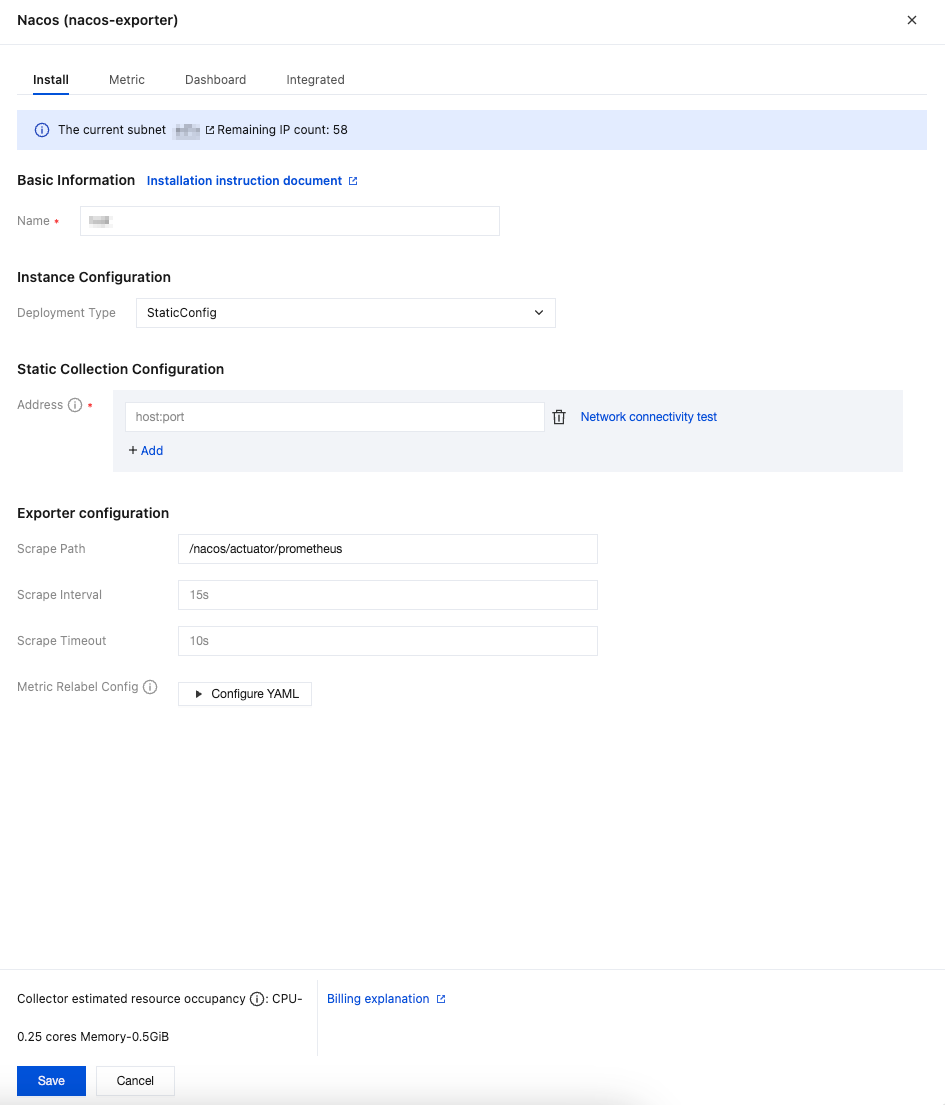
If Nacos is deployed in a non-container environment, you can use the StaticConfig deployment type to deploy the collection configurations for monitoring. The configuration steps are as follows:
1. In the pop-up installation window, find Deployment Type under Instance Configuration, then select StaticConfig from the drop-down list.
2. In Static Collection Configuration > Address, fill in the host:port of the Nacos service. Multiple addresses can be added. Network interconnectivity with the Prometheus instance should be ensured.
3. Confirm whether the path specified in Exporter Configuration > Scrape Path is consistent with the configurations of the Nacos service.
4. Fill in other Exporter configurations as needed, then click Save.
Parameter | Description |
Name | Integration name, which should comply with the following naming conventions: The name should be unique. The name should fully match the regular expression '^[a-z0-9]([-a-z0-9]*[a-z0-9])?(\\.[a-z0-9]([-a-z0-9]*[a-z0-9])?)*$'. |
Deployment Type | Deployment type for monitoring. StaticConfig represents static collection configurations. |
Address | Enter the collection target address in the format host:port. Multiple addresses can be added. Network interconnectivity with the Prometheus instance should be ensured. To enable access over the public network, refer to Enabling Public Network Access for TKE Serverless Cluster. |
Scrape Path | Path for exposing Nacos metrics. Default: /nacos/actuator/prometheus. |
Scrape Interval | Default: 15s. Example values: 60s, 1m30s, 5m. |
Scrape Timeout | Default: 10s. The scrape timeout should be less than or equal to the scrape interval. Specify the value in the same format as the scrape interval. |
Metric Relabel Config | Optional. Prometheus native metric_relabel_configs and Prometheus Operator native metricRelabelings configurations are compatible, but cannot be used simultaneously. |
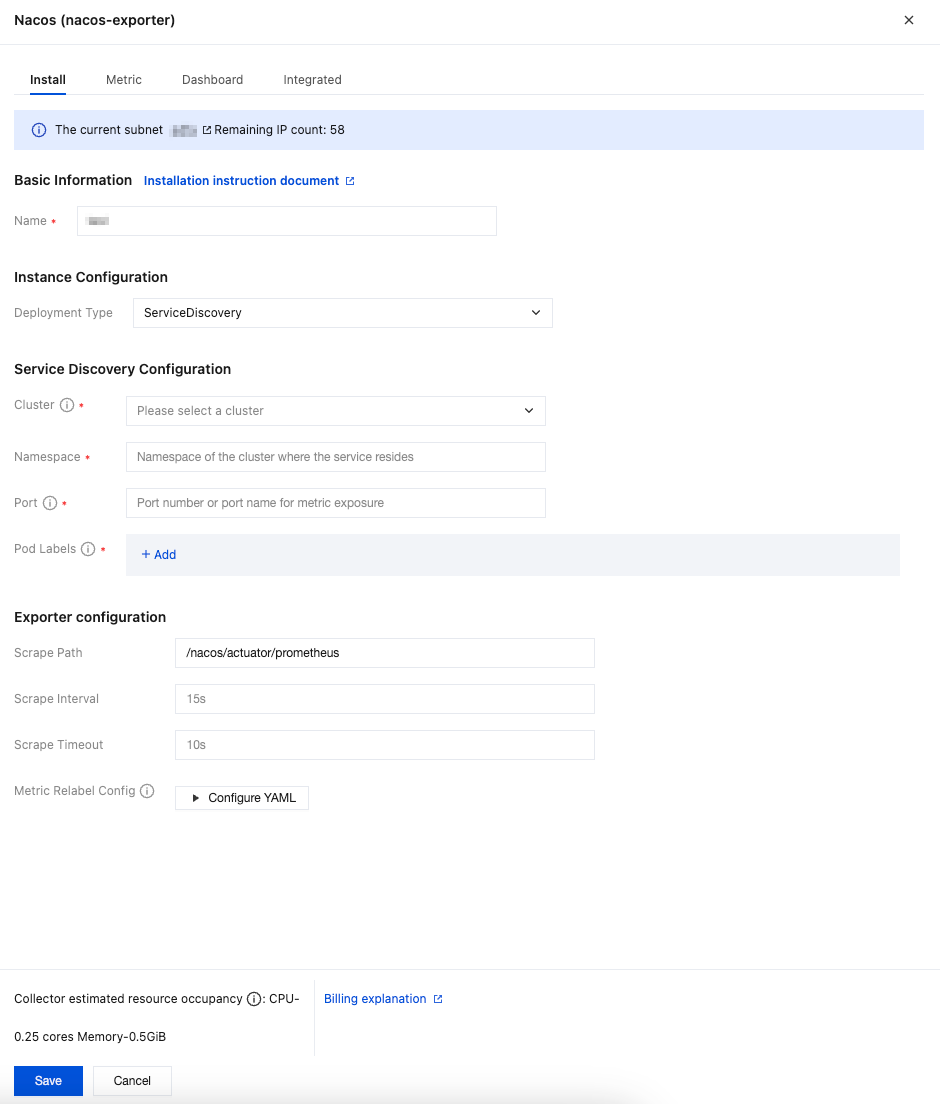
If Nacos is deployed in a container environment, you can use the ServiceDiscovery deployment type to deploy the collection configurations for monitoring. The configuration steps are as follows:
1. Ensure that the current Prometheus instance has been successfully associated with the cluster where Nacos resides. For detailed steps, refer to Integration with TKE.
2. In the pop-up installation window, find Deployment Type under Instance Configuration, then select ServiceDiscovery from the drop-down list.
3. Under Service Discovery Configuration, select the cluster where the Nacos service to be monitored is located, then fill in the namespace of the Nacos service, the metric exposure port number or port name, and the Nacos pod labels.
4. Confirm whether the path specified in Exporter Configuration > Scrape Path is consistent with the configurations of the Nacos service.
5. Fill in other Exporter configurations as needed, then click Save.
Parameter | Description |
Name | Integration name, which should comply with the following naming conventions: The name should be unique. The name should fully match the regular expression '^[a-z0-9]([-a-z0-9]*[a-z0-9])?(\\.[a-z0-9]([-a-z0-9]*[a-z0-9])?)*$'. |
Deployment Type | Deployment type for monitoring. ServiceDiscovery represents service discovery configurations. |
Cluster | Cluster where the Nacos service to be monitored is located. Ensure that the cluster has been successfully associated with the current Prometheus instance. For detailed steps, refer to Integration with TKE. |
Namespace | Namespace of the cluster where the Nacos service is located. |
Port | Port number or port name for Nacos metric exposure. Port configurations should be added in the workload spec.template.spec.containers.ports. |
Pod Labels | Tag that the Pod of the Nacos service explicitly configures in metadata.labels. When a Pod is created through a workload, the Pod tag is the tag configured in the workload spec.template.metadata.labels. |
Scrape Path | Path for exposing Nacos metrics. Default: /nacos/actuator/prometheus. |
Scrape Interval | Default: 15s. Example values: 60s, 1m30s, 5m. |
Scrape Timeout | Default: 10s. The scrape timeout should be less than or equal to the scrape interval. Specify the value in the same format as the scrape interval. |
Metric Relabel Config | Optional. Prometheus native metric_relabel_configs and Prometheus Operator native metricRelabelings configurations are compatible, but cannot be used simultaneously. |
Viewing Monitoring Data
Prerequisites
The Prometheus instance has been bound to a Grafana instance.
Operation Steps
1. Log in to the TMP console, and select the corresponding Prometheus instance to go to the management page.
2. Choose Data Collection > Integration Center. On the Integration Center page, find and click the Nacos monitoring card to open the integration page. Select Dashboard > Dashboard Install/Upgrade to install the corresponding Grafana Dashboard.
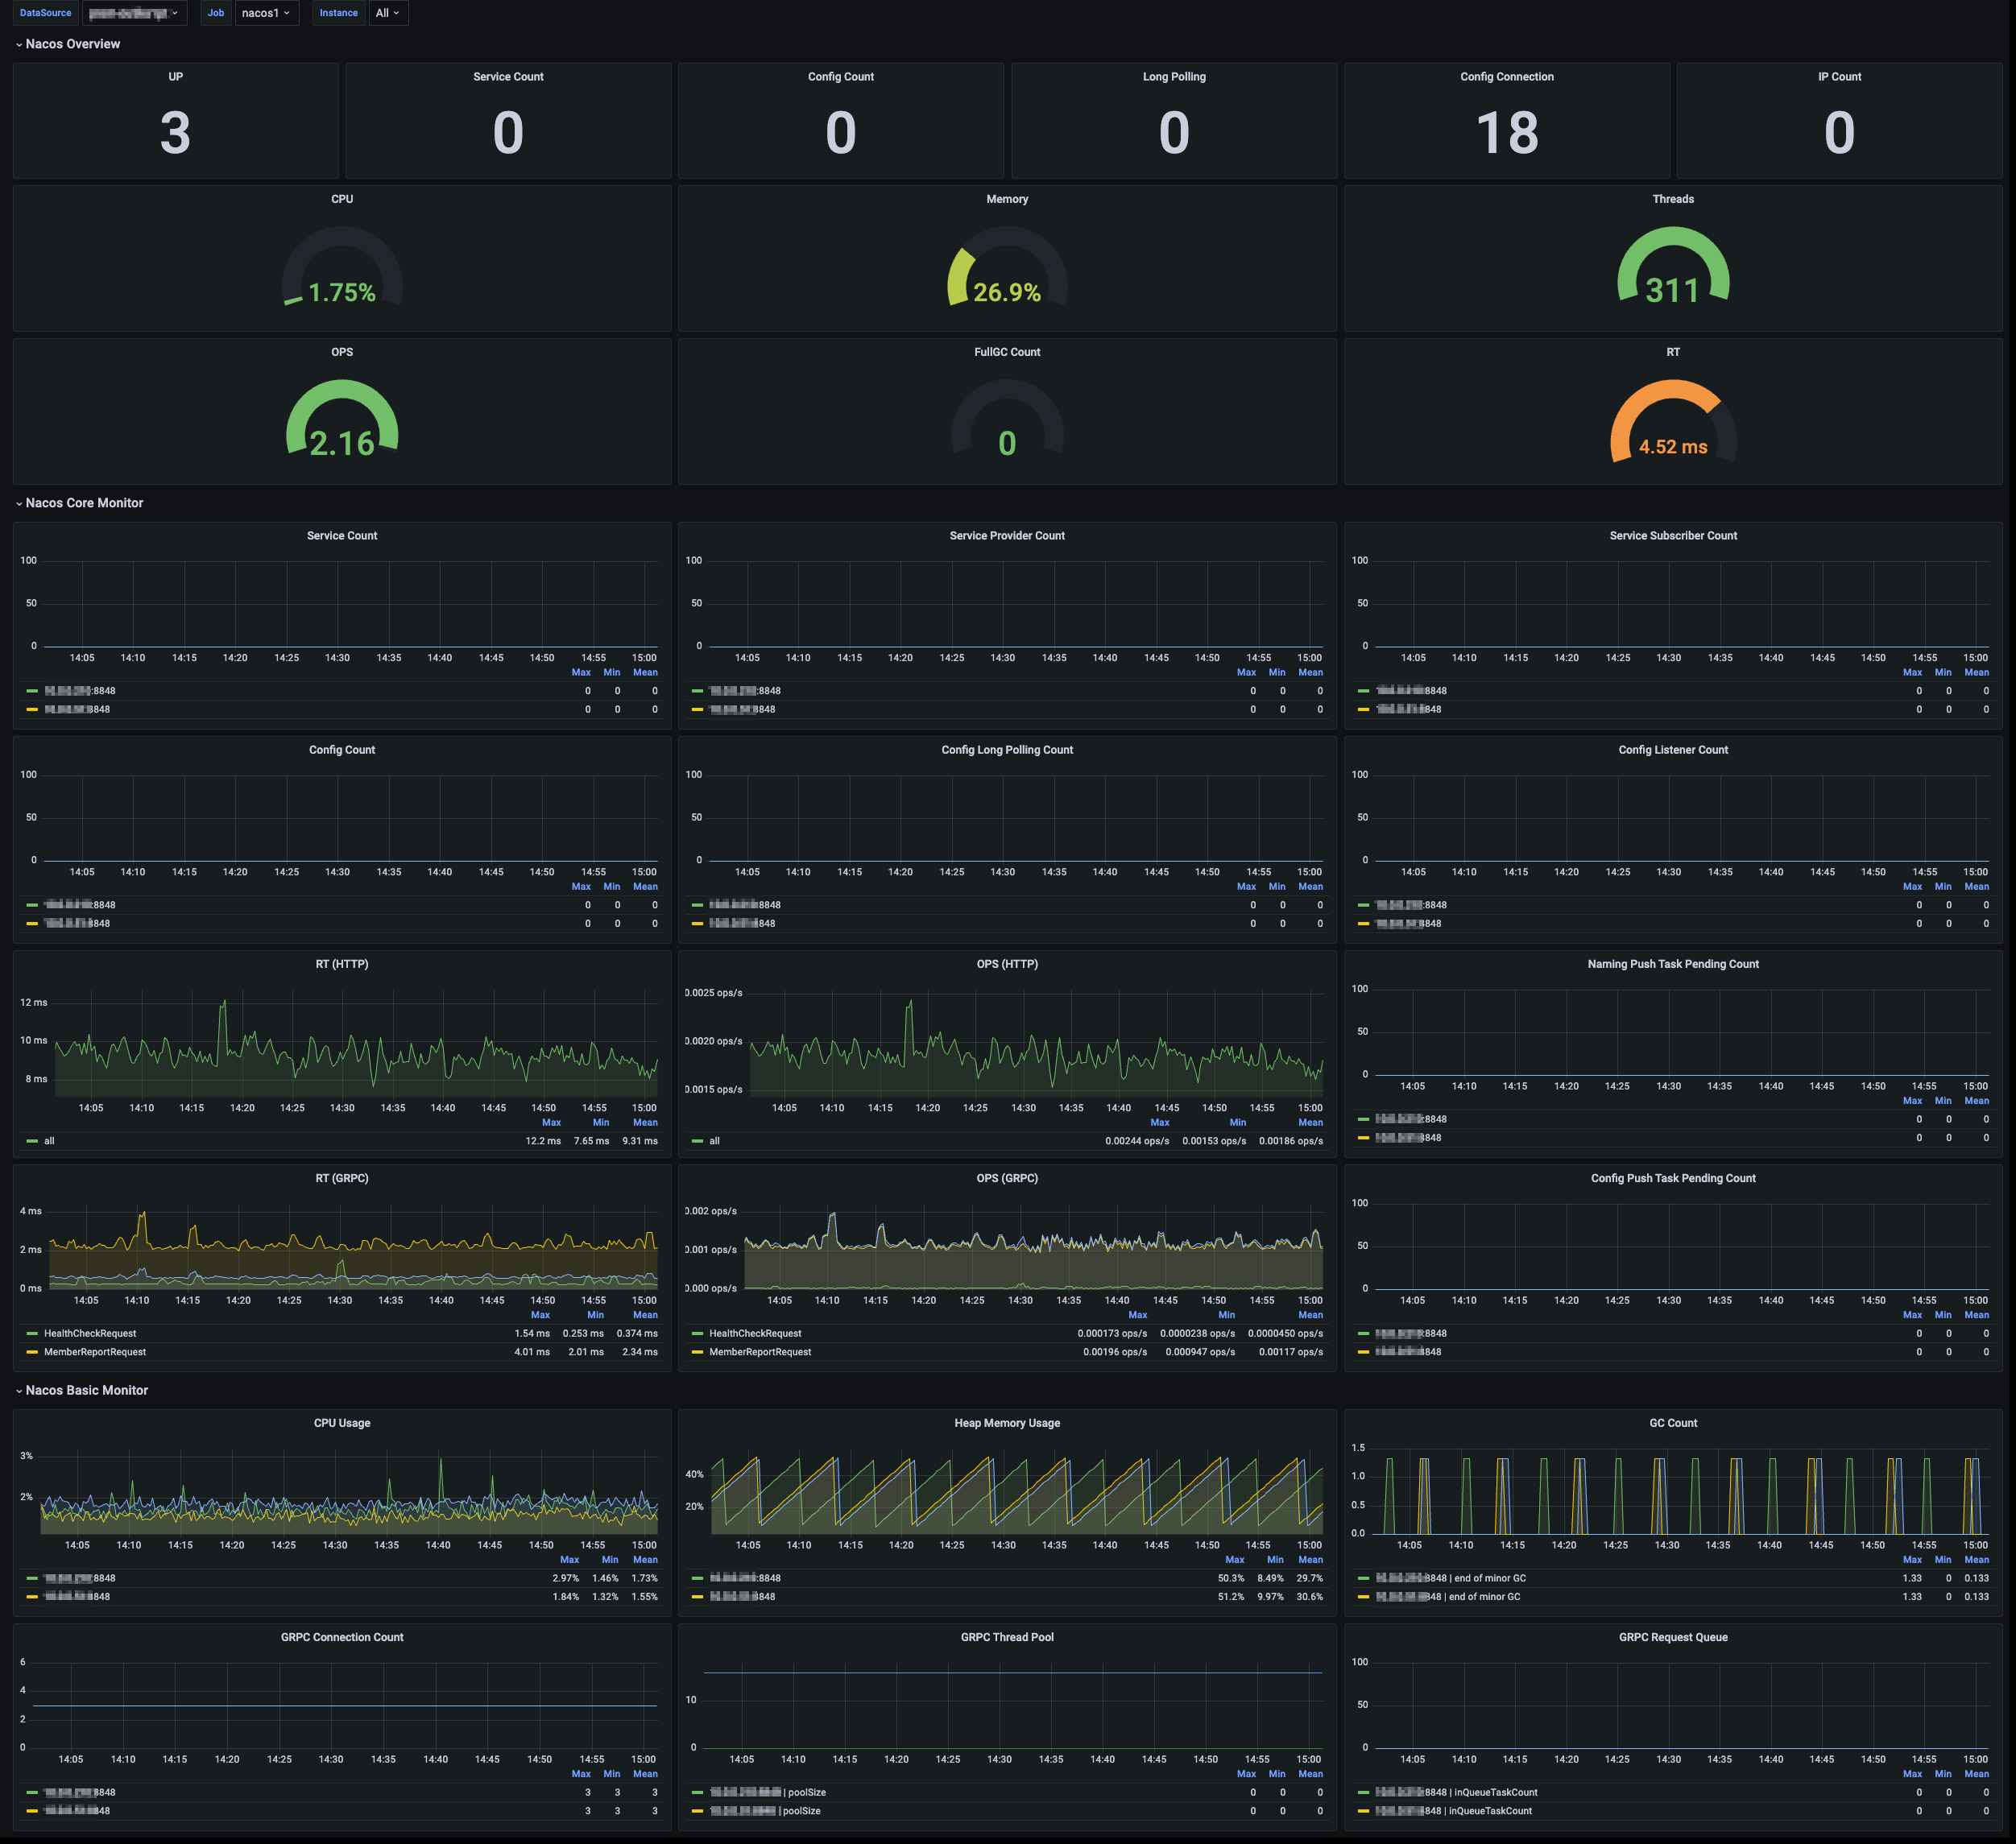
3. Select View Integrated. In the integrated result list, click the Grafana icon to automatically go to the Nacos monitoring dashboard and view the monitoring data related to the instance, as shown below:
피드백