tencent cloud

Tencent Cloud Observability Platform

Release Notes and Announcements
Release Notes
Product Introduction
Overview
Strengths
Basic Features
Basic Concepts
Use Cases
Use Limits
Purchase Guide
Tencent Cloud Product Monitoring
Application Performance Management
Mobile App Performance Monitoring
Real User Monitoring
Cloud Automated Testing
Prometheus Monitoring
Grafana
EventBridge
PTS
Quick Start
Monitoring Overview
Instance Group
Tencent Cloud Product Monitoring
Application Performance Management
Real User Monitoring
Cloud Automated Testing
Performance Testing Service
Prometheus Getting Started
Grafana
Dashboard Creation
EventBridge
Alarm Service
Cloud Product Monitoring
Tencent Cloud Service Metrics
Operation Guide
CVM Agents
Cloud Product Monitoring Integration with Grafana
Troubleshooting
Practical Tutorial
Application Performance Management
Product Introduction
Access Guide
Operation Guide
Practical Tutorial
Parameter Information
FAQs
Mobile App Performance Monitoring
Overview
Operation Guide
Access Guide
Practical Tutorial
Tencent Cloud Real User Monitoring
Product Introduction
Operation Guide
Connection Guide
FAQs
Cloud Automated Testing
Product Introduction
Operation Guide
FAQs
Performance Testing Service
Overview
Operation Guide
Practice Tutorial
JavaScript API List
FAQs
Prometheus Monitoring
Product Introduction
Access Guide
Operation Guide
Practical Tutorial
Terraform
FAQs
Grafana
Product Introduction
Operation Guide
Guide on Grafana Common Features
FAQs
Dashboard
Overview
Operation Guide
Alarm Management
Console Operation Guide
Troubleshooting
FAQs
EventBridge
Product Introduction
Operation Guide
Practical Tutorial
FAQs
Report Management
FAQs
General
Alarm Service
Concepts
Monitoring Charts
CVM Agents
Dynamic Alarm Threshold
CM Connection to Grafana
Documentation Guide
Related Agreements
Application Performance Management Service Level Agreement
APM Privacy Policy
APM Data Processing And Security Agreement
RUM Service Level Agreement
Mobile Performance Monitoring Service Level Agreement
Cloud Automated Testing Service Level Agreement
Prometheus Service Level Agreement
TCMG Service Level Agreements
PTS Service Level Agreement
PTS Use Limits
Cloud Monitor Service Level Agreement
API Documentation
History
Introduction
API Category
Making API Requests
Monitoring Data Query APIs
Alarm APIs
Legacy Alert APIs
Notification Template APIs
TMP APIs
Grafana Service APIs
Event Center APIs
TencentCloud Managed Service for Prometheus APIs
Monitoring APIs
Data Types
Error Codes
Glossary

TKE Monitoring

PDF
포커스 모드
폰트 크기
마지막 업데이트 시간: 2024-08-07 22:08:14

Background

As we all know, Prometheus is the best monitoring tool for container scenarios. However, self-building Prometheus is too expensive for small and medium-sized enterprises with limited Ops manpower, and it is likely to hit performance bottlenecks for large enterprises with rapid business development. Therefore, using Prometheus managed on the cloud has become the first choice for more and more cloud companies. For how to use the managed Prometheus to monitor TKE, see Tencent Kubernetes Engine (TKE).

Directions

Step 1. Purchasing an instance

1. Log in to the TMP console.
2. Click Create, select the purchase region, storage duration and select the Grafana instance to be associated based on your needs. If there is no Grafana instance, see Creating Instance to create one. You need to create an instance and complete the purchase.
3. After completing the configuration, click Buy Now. For more information on billing rules, see Pay-as-You-Go Description.

Step 2. Integrate with TKE

1. After creating the instance, click the ID/Name of the target instance in the instance list to enter the instance details page.
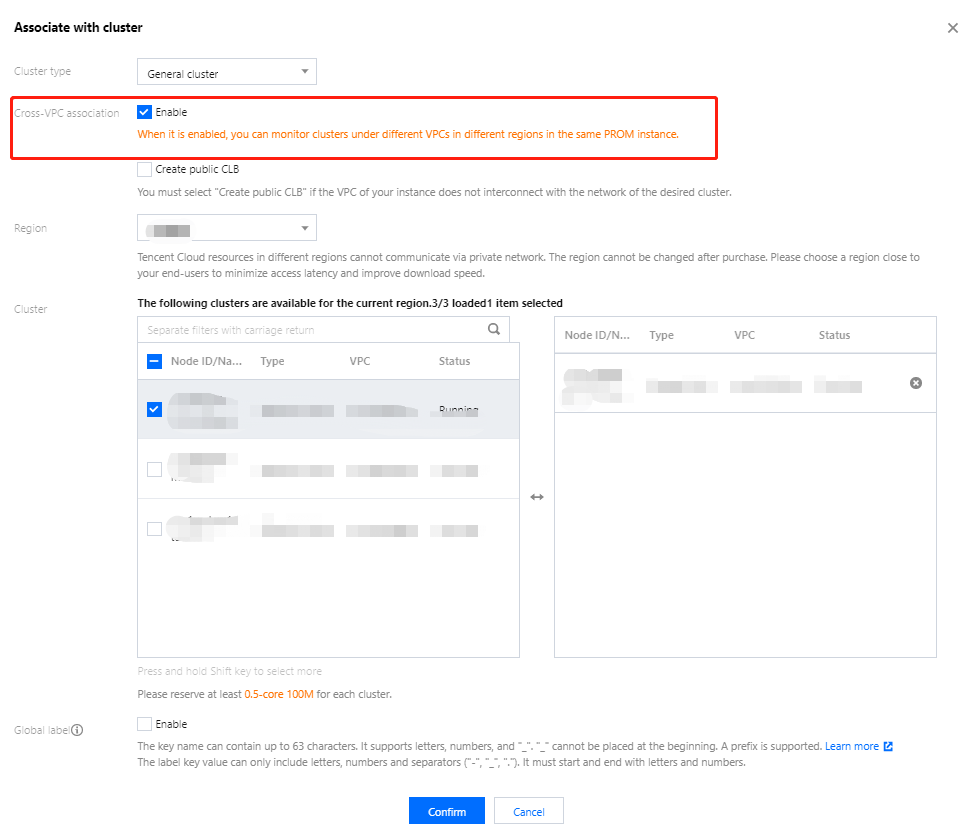
2. On the left sidebar, click Integrate with TKE > Associate Cluster.
3. Select the cluster that needs to be associated in the pop-up window. A total of 4 types of clusters are supported: standard cluster, elastic cluster, registered cluster, and edge cluster. The clusters can be across VPCs. If different VPCs are not interconnected, you need to create a public network CLB instance.

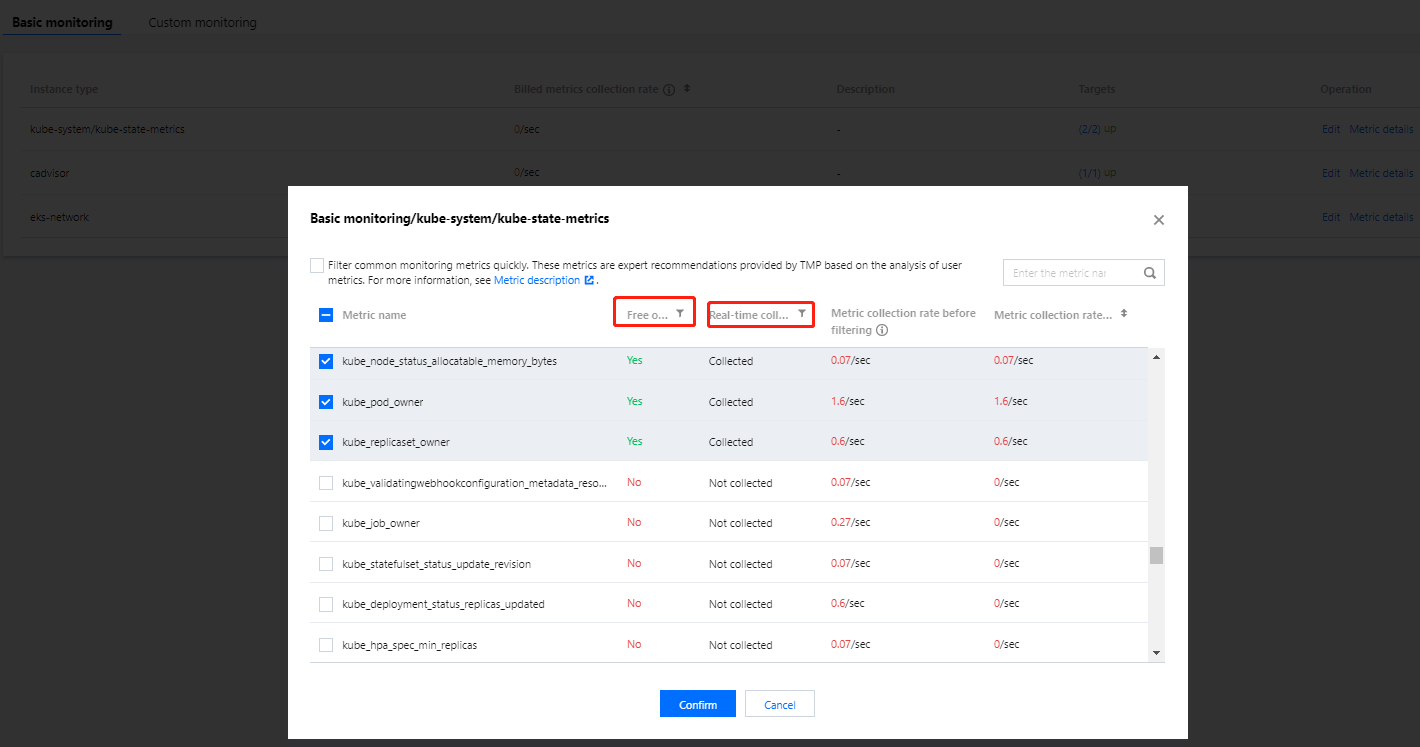
4. After associating the cluster, you can manually configure metrics for collection on Cluster Monitoring > Data Collection Configuration, view the default free basic collection metrics, and add or reduce the metrics as needed.


Step 3. View monitoring data in Grafana

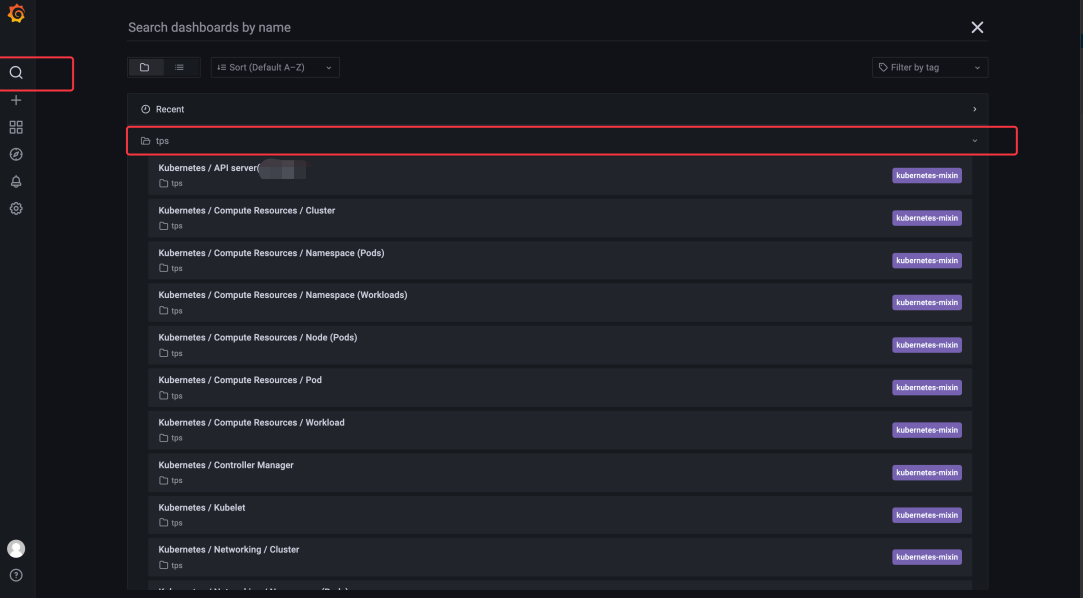
1. Click the Grafana icon to the right of the instance in the instance list to enter the Grafana service platform.
2. In the dashboard search list, TKE-related monitoring panels are preset by default, and click a panel name.

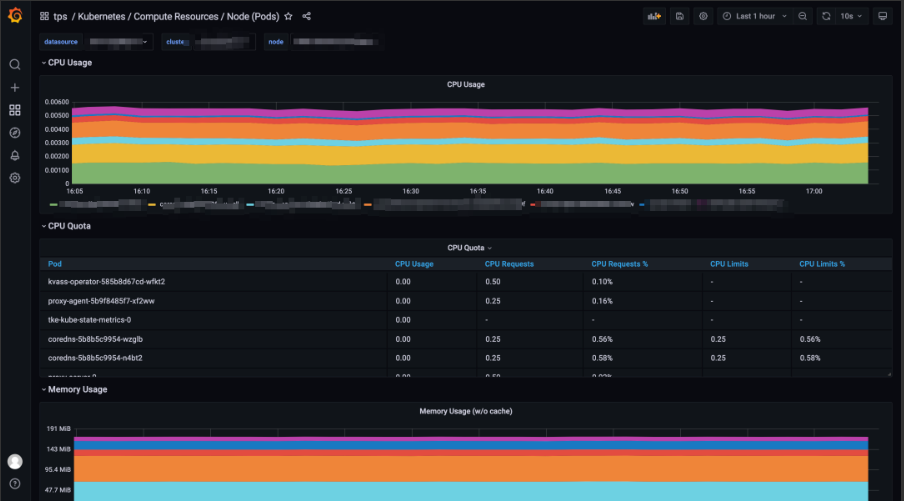
Enter the panel page, and you can view the preset monitoring data charts.


Step 4. Configure the alert policy

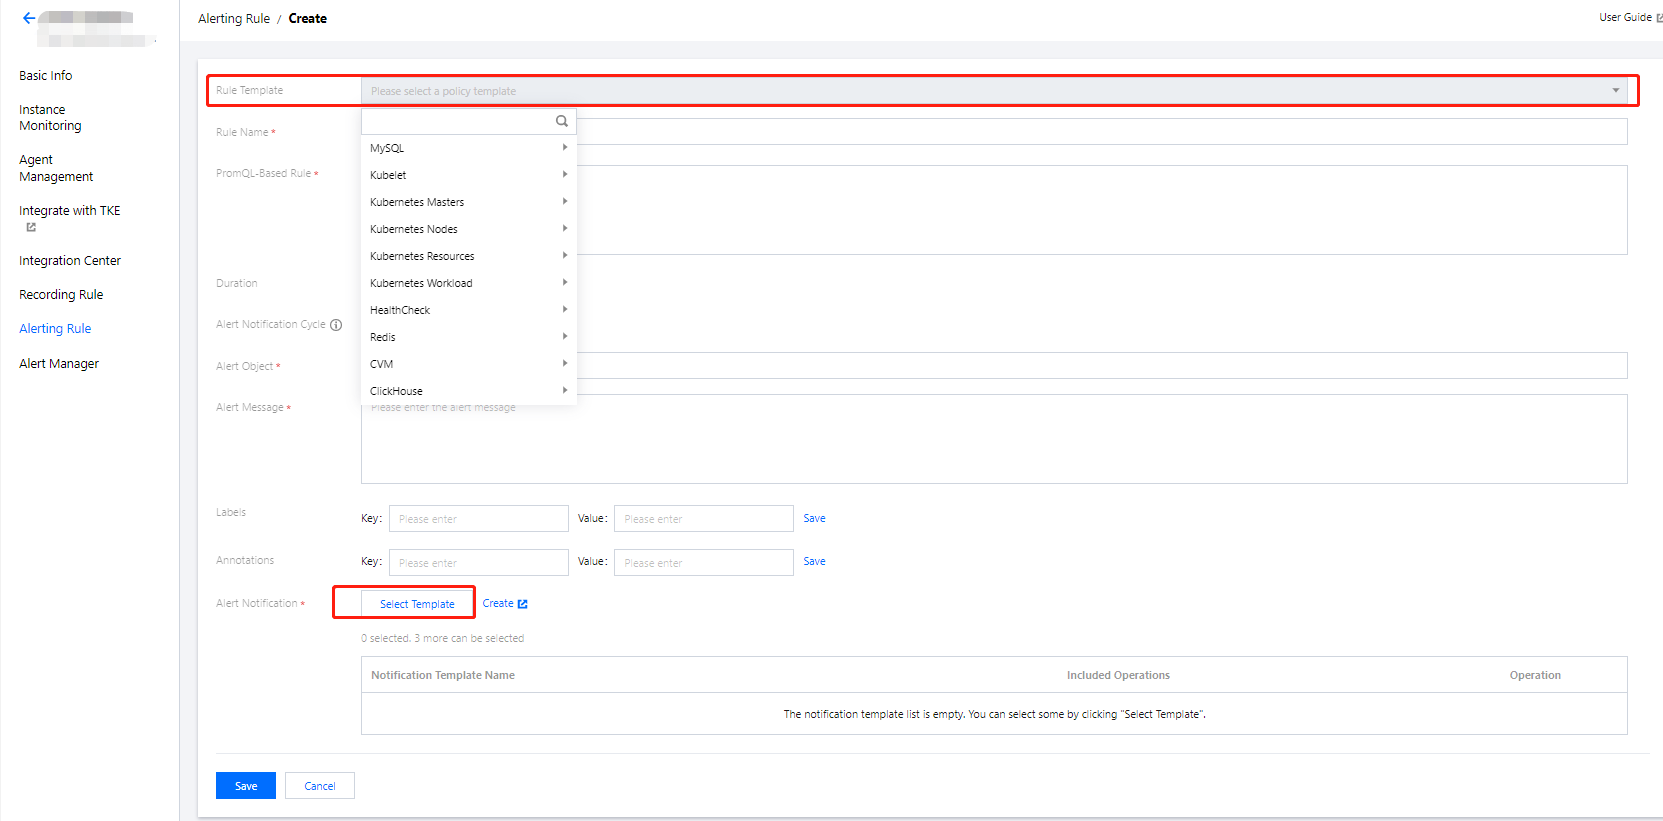
On the Prometheus instance details page, click Alerting Rule, and you can select a preset template type without manual configuration. For alert notifications, you can select existing notification templates on the TCOP to quickly configure alerts.


도움말 및 지원

문제 해결에 도움이 되었나요?

피드백