tencent cloud

Tencent Cloud Observability Platform

Release Notes and Announcements
Release Notes
Product Introduction
Overview
Strengths
Basic Features
Basic Concepts
Use Cases
Use Limits
Purchase Guide
Tencent Cloud Product Monitoring
Application Performance Management
Mobile App Performance Monitoring
Real User Monitoring
Cloud Automated Testing
Prometheus Monitoring
Grafana
EventBridge
PTS
Quick Start
Monitoring Overview
Instance Group
Tencent Cloud Product Monitoring
Application Performance Management
Real User Monitoring
Cloud Automated Testing
Performance Testing Service
Prometheus Getting Started
Grafana
Dashboard Creation
EventBridge
Alarm Service
Cloud Product Monitoring
Tencent Cloud Service Metrics
Operation Guide
CVM Agents
Cloud Product Monitoring Integration with Grafana
Troubleshooting
Practical Tutorial
Application Performance Management
Product Introduction
Access Guide
Operation Guide
Practical Tutorial
Parameter Information
FAQs
Mobile App Performance Monitoring
Overview
Operation Guide
Access Guide
Practical Tutorial
Tencent Cloud Real User Monitoring
Product Introduction
Operation Guide
Connection Guide
FAQs
Cloud Automated Testing
Product Introduction
Operation Guide
FAQs
Performance Testing Service
Overview
Operation Guide
Practice Tutorial
JavaScript API List
FAQs
Prometheus Monitoring
Product Introduction
Access Guide
Operation Guide
Practical Tutorial
Terraform
FAQs
Grafana
Product Introduction
Operation Guide
Guide on Grafana Common Features
FAQs
Dashboard
Overview
Operation Guide
Alarm Management
Console Operation Guide
Troubleshooting
FAQs
EventBridge
Product Introduction
Operation Guide
Practical Tutorial
FAQs
Report Management
FAQs
General
Alarm Service
Concepts
Monitoring Charts
CVM Agents
Dynamic Alarm Threshold
CM Connection to Grafana
Documentation Guide
Related Agreements
Application Performance Management Service Level Agreement
APM Privacy Policy
APM Data Processing And Security Agreement
RUM Service Level Agreement
Mobile Performance Monitoring Service Level Agreement
Cloud Automated Testing Service Level Agreement
Prometheus Service Level Agreement
TCMG Service Level Agreements
PTS Service Level Agreement
PTS Use Limits
Cloud Monitor Service Level Agreement
API Documentation
History
Introduction
API Category
Making API Requests
Monitoring Data Query APIs
Alarm APIs
Legacy Alert APIs
Notification Template APIs
TMP APIs
Grafana Service APIs
Event Center APIs
TencentCloud Managed Service for Prometheus APIs
Monitoring APIs
Data Types
Error Codes
Glossary
문서Tencent Cloud Observability PlatformPrometheus MonitoringPractical TutorialEnabling Public Network Access for TKE Serverless Cluster

Enabling Public Network Access for TKE Serverless Cluster

PDF
포커스 모드
폰트 크기
마지막 업데이트 시간: 2024-08-07 22:08:22

Overview

TMP is integrated with CM. When creating an integration, if you select COS, you need to enable public network access for the TKE Serverless cluster of the target CM exporter, as COS doesn't support private network access.

Directions

1. Log in to the TMP console.
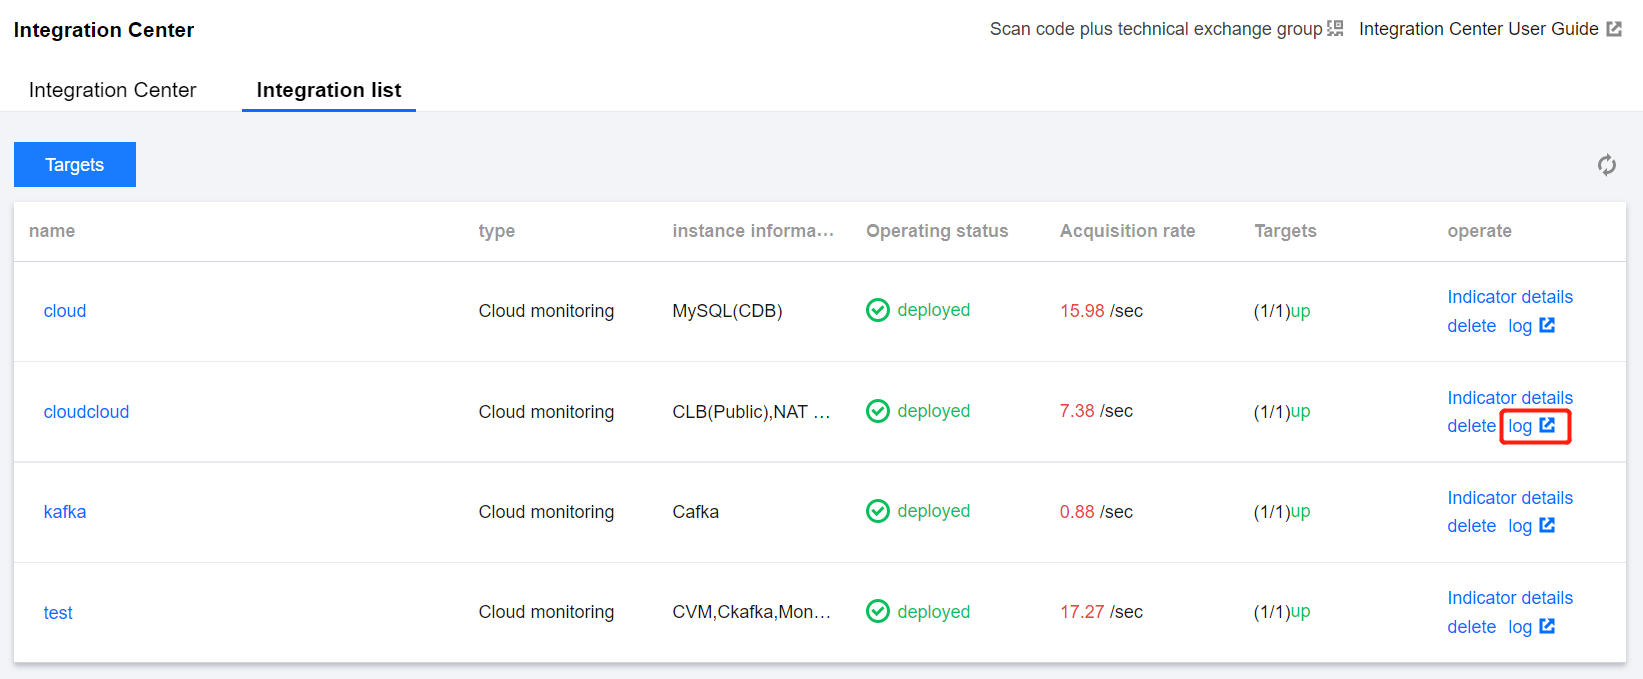
2. Click the target instance to enter the instance management page. Then, click Integration Center > Integration List.
3. Click Log in the Operation column of the line where Type is CM.


4. On the topbar, switch to the Pod management page. Click the instance name to enter the cluster page.
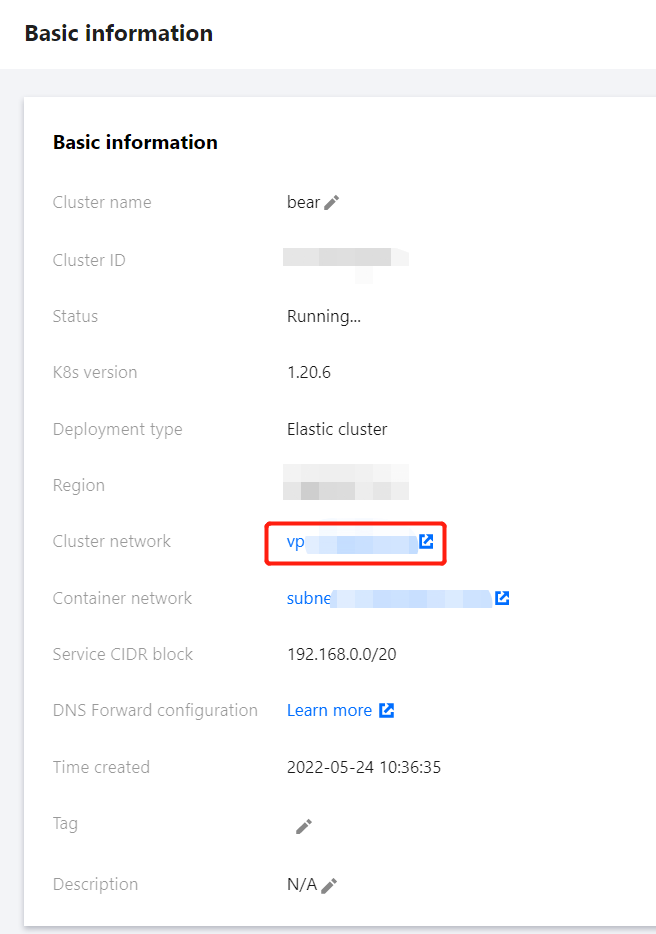
5. On the Basic Info page, click Container Network.


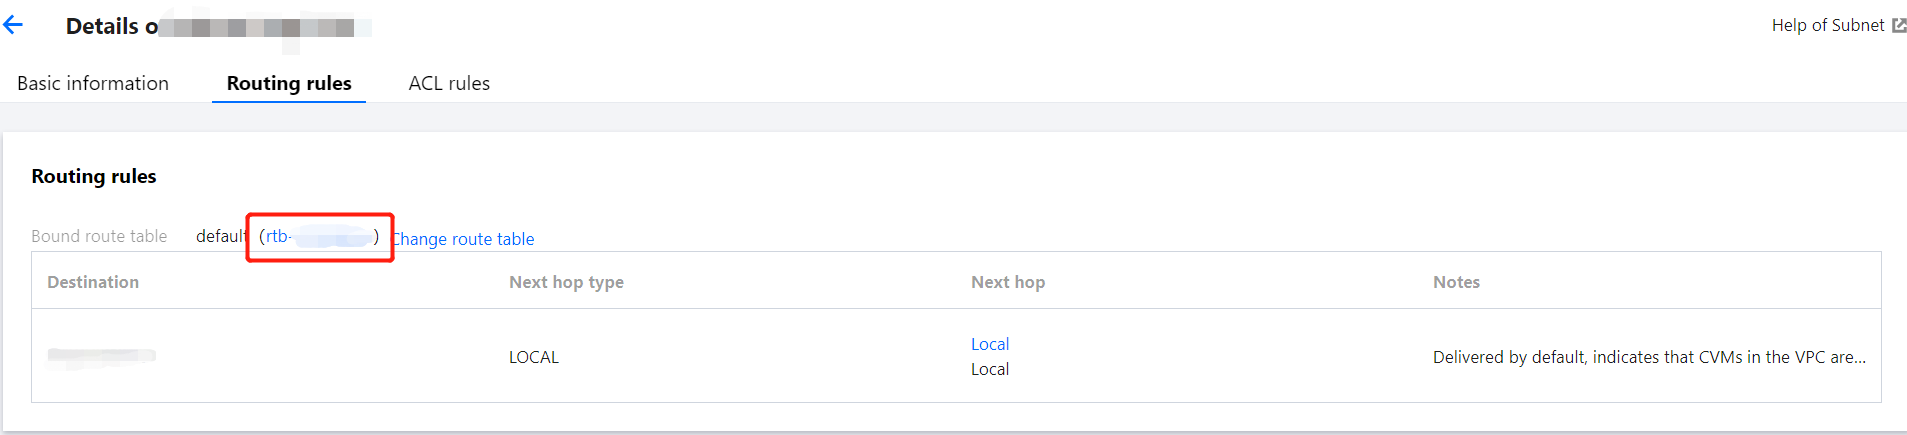
6. On the topbar of the container network page, switch to the Routing Policy tab. Click the route table link (rtb-xxx in the list) to enter the route table page.


7. On the route table page, click Create Routing Policy.
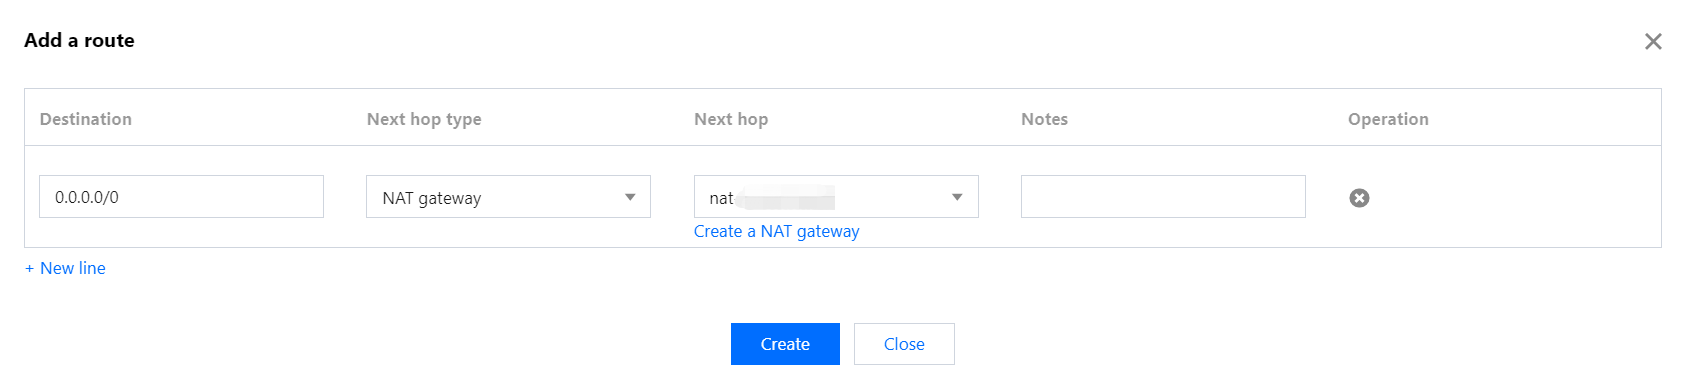
Destination: Enter 0.0.0.0/0.
Next Hop Type: Select NAT Gateway.
Next Hop: Select the target gateway. If there is no gateway, create one as instructed in Getting Started.


8. Click Create. After the creation is successful, public network access is enabled for TKE Serverless.

도움말 및 지원

문제 해결에 도움이 되었나요?

피드백