LogListener Observability Metrics
Download
포커스 모드
폰트 크기
Overview
The LogListener observability metrics are the runtime monitoring capabilities that CLS provides for the LogListener collector. During the processes of log collection, parsing, and sending, LogListener periodically reports a series of built-in metrics. These metrics cover multiple dimensions, including collection link integrity, sending quality, parsing correctness, exception counts, collector status, reliability and fault tolerance, and system resource usage. The metrics are stored in CLS in the form of Metric topics. You can use PromQL to query the metrics, configure dashboards and alarm policies, and monitor the operational status of LogListener on each machine in real time.
Use Cases
Collection Link Monitoring: You can monitor the log collection status of each machine in real time via dashboards or PromQL queries, focusing on metrics such as file lag, queue backlog, sending success rate, and number of retries.
Data Integrity Verification: It enables end-to-end data flow integrity verification based on metrics such as input volume, successful processing volume, discarded volume, filtered volume, and truncated volume.
Parsing and Timing Issue Troubleshooting: For different parsing modes (JSON, delimiter, regex, combined parsing), it monitors the respective counts of various parsing failures to quickly locate mismatches between log formats and parsing configurations.
Collector Resource Monitoring: As a resident collection process, LogListener requires continuous monitoring of its own resource consumption. You can focus on metrics such as LogListener CPU utilization, LogListener memory usage, and number of business threads.
Exception Alarms and Fault Troubleshooting: You can configure alarm policies based on exception count metrics such as file read errors, file permission errors, file not found errors, file descriptor exhaustion errors, and network errors, combined with process status metrics like process abnormal restart count, to achieve real-time fault awareness.
Prerequisites
LogListener must be installed and deployed, and its version must be v3.6.1 or later. The observability metrics capability relies on the new LogListener collection architecture. If your LogListener version is earlier than v3.6.1, upgrade it first. For details, see the Installation and Upgrade Guide. CLS provides the following default configurations:
Default Configuration Item | Configuration Content |
Metric topic | When you have machines in a region that meet the prerequisites and report data, CLS automatically creates a default metric topic for you in that region and saves the currently and future generated LogListener metric data to the default metric topic. Metric topic: cls_collector_services_metric |
Storage Time | Retained for 7 days by default. |
Dashboard | A LogListener observability dashboard is generated by default. |
LogListener Observability Dashboard
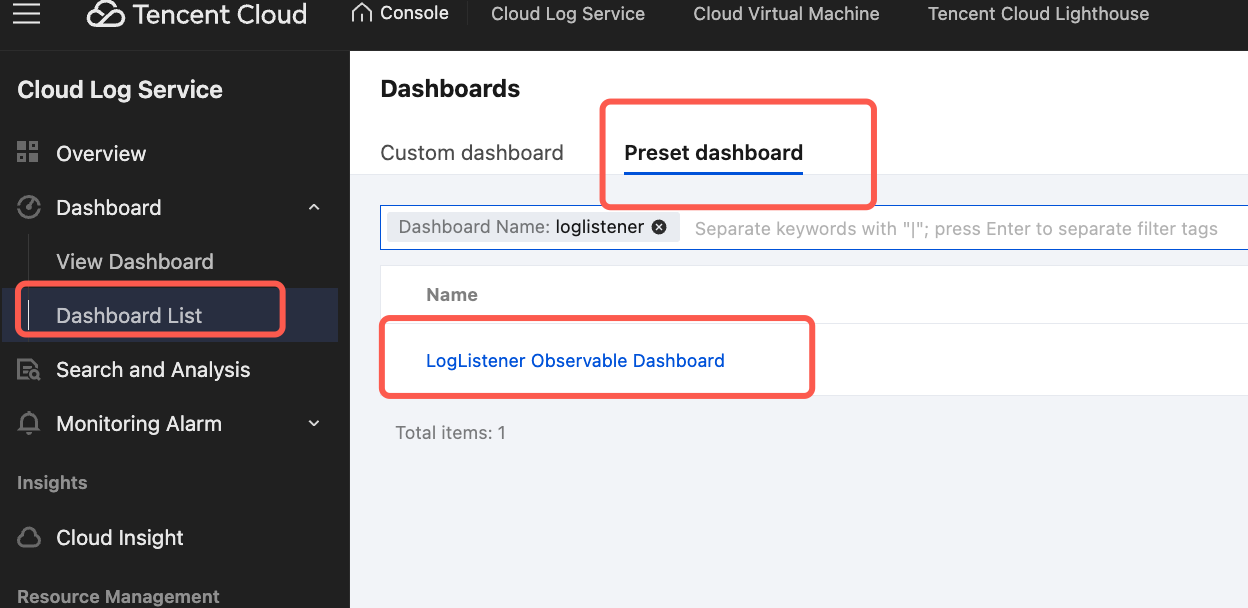
1. Log in to the CLS console.
2. In the left sidebar, choose Dashboard > Dashboard List, then locate and enter the LogListener Observable Dashboard under the Preset Dashboard Tag.
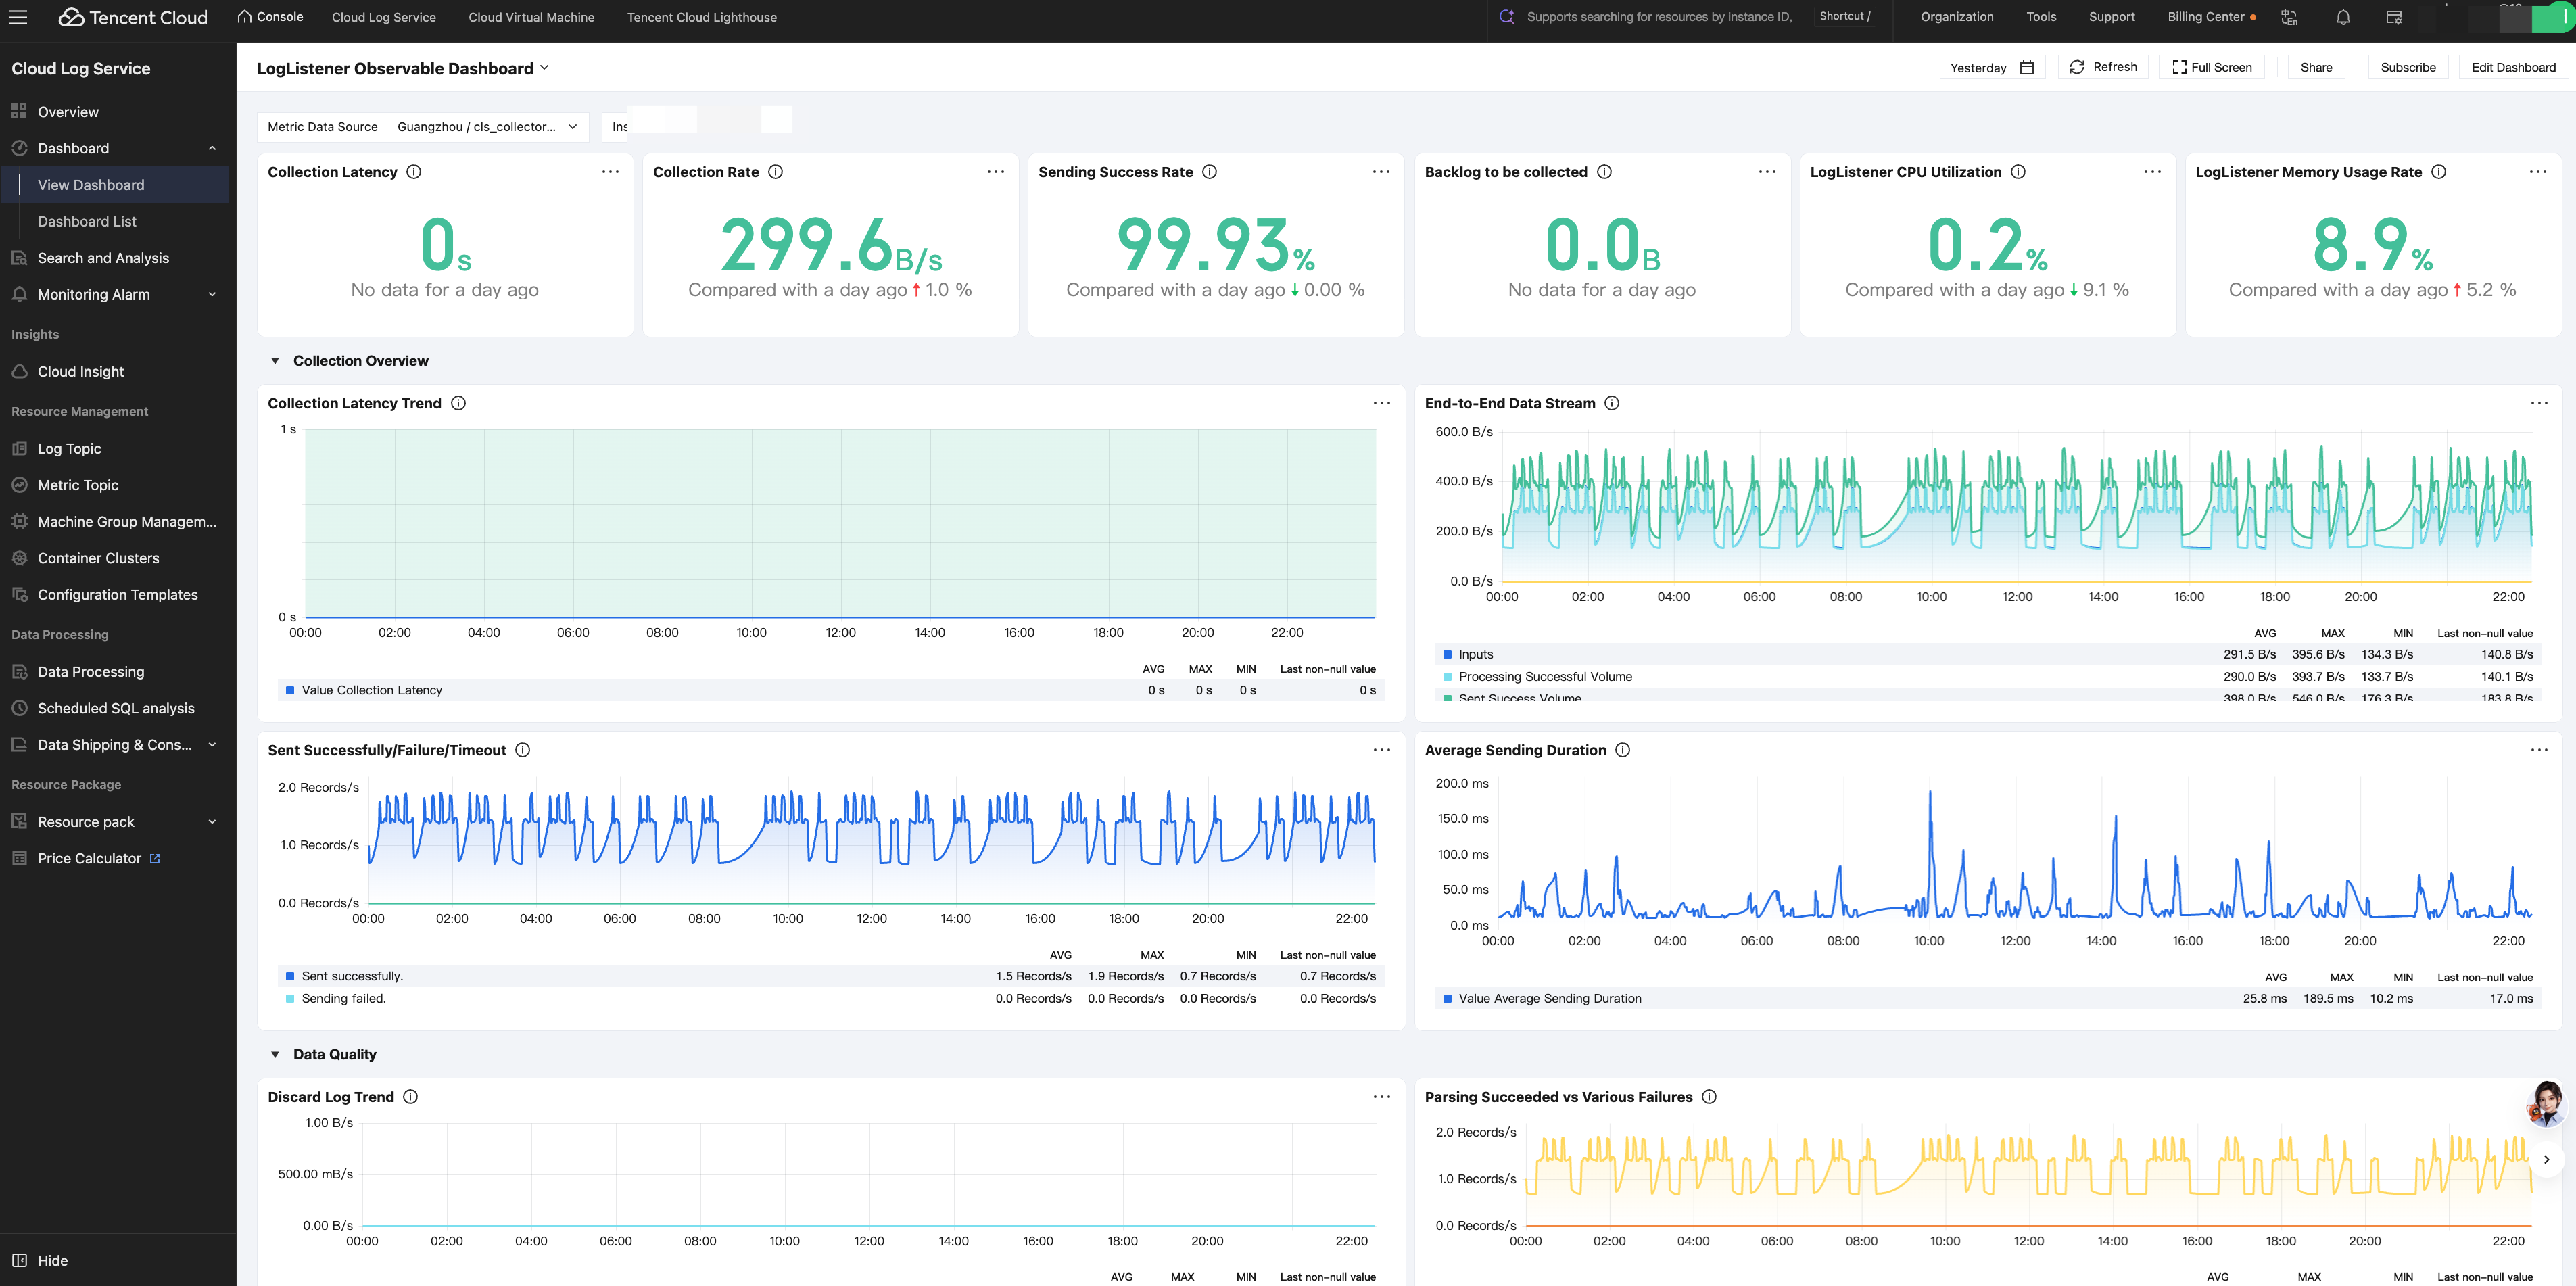
3. In the top filter bar: select cls-collector-services-metric for Metric Data Source and the target machine IP address for Instance IP.
4. View LogListener observability information, including metrics such as collection latency, collection rate, sending success rate, collection backlog, and CPU/memory utilization.
Collection Latency: The internal CLS processing delay (the time elapsed from when CLS detects a log to when the upload is complete) reflects the end-to-end delay from log detection to upload completion.
Collection Rate: The number of raw log bytes read by the LogListener input plugin per unit of time.
Sending Success Rate: The proportion of successful requests among all log sending requests to CLS.
Backlog to be collected: The difference between the current file size and the offset already read by LogListener.
LogListener CPU Utilization: The CPU utilization of the LogListener process itself.
LogListener Memory Usage Rate: The resident memory usage of the LogListener process.
To customize a dashboard, you can create charts on the dashboard editing page based on the metric fields below in this document and in combination with PromQL. For more information, see Create Dashboard.
Metric Field Descriptions
LogListener observability metrics are categorized into six major types based on their purpose:
Core Business Metrics: For example, processing latency, file backlog, etc.
Exception Monitoring Metrics: For example, file read error count, request error count, etc.
LogListener Self-Monitoring Metrics: For example, LogListener process CPU utilization, memory usage, etc.
Reliability and Fault Tolerance Metrics: For example, point update write count, etc.
System Monitoring Metrics: For example, overall system CPU utilization, memory size, etc.
Independent Alarm Monitoring Metrics: For example, LogListener alarm count statistics.
Core Business Metrics
Core business metrics reflect the processing volume, performance, and quality of LogListener on the log collection, parsing, and delivery paths. The metrics are as follows:
Field | Description |
cls_processing_delay_ms | CLS internal processing delay (the time elapsed from when CLS perceives a log to when the upload is completed), reflecting the end-to-end latency from log perception to upload completion. |
file_lag_size | File lag (backlog to be collected). It is the difference between the current file size and the offset read by LogListener, accumulated across all files of the collector. This metric reflects the collection progress. A continuously increasing value indicates that the collection speed cannot keep up with the log generation speed. |
pipeline_queue_size | The volume of data pending processing in the current pipeline queue. |
pipeline_queue_count | The length of the queue pending processing in the current pipeline. |
send_queue_size | The volume of data pending processing/sending in the current send queue. |
send_queue_count | The length of the queue pending processing/sending in the current send queue. |
event_queue_size | Event queue size. |
polling_event_queue_size | Polling event queue size. |
events_produced_total | Total number of events produced. |
events_consumed_total | Total number of events consumed. |
events_lag | Current number of backlogged events. |
events_consumed_failed_total | Number of events failed to be consumed. |
send_log_time | Time consumed by a single send request, in milliseconds. Metric type: Histogram, with bucket boundaries of 10, 25, 50, 100, 250, 500, 1000, 2500, 5000, and 10000 ms. P50/P90/P99 latency can be calculated using the histogram_quantile function. |
send_log_size | Total size of logs sent. |
process_count | Number of logs processed. |
process_bytes | Size of logs processed. |
input_size | Total size of raw logs received by the input plugin. This metric serves as the source benchmark for data integrity verification. |
processor_success_count | Number of logs successfully processed. |
processor_success_size | Size of logs successfully processed. |
dropped_log_count | Number of logs dropped. This metric counts the logs that are actively discarded during the collection or processing phase. |
dropped_log_size | Size of logs dropped. |
truncate_log_size | Size of truncated logs; the cumulative size of logs truncated when they exceed the single-log length limit. |
multi_line_parse_failures_count | Number of multi-line parse failures. |
multi_line_parse_failures_size | Size of multi-line parse failures. |
total_filter_count | Number of logs filtered. This metric counts the logs that are filtered out by the filtering rules in the collection configuration. |
total_filter_size | Size of filtered logs. |
send_success_count | Number of logs successfully sent. |
send_success_size | Size of logs successfully sent. |
send_failed_count | Number of logs that failed to be sent. |
send_failed_size | Size of logs that failed to be sent. |
send_timeout_log_count | Number of logs that timed out during sending; a send timeout is usually caused by network abnormalities or slow server response. |
send_timeout_log_size | Size of logs that timed out during sending. |
total_resend | Total number of retries. LogListener automatically retries after a send failure. A high number of retries usually indicates network jitter or server-side throttling. |
parse_success_count | Number of logs successfully parsed. This metric counts the global parsing status (covering all parsing modes). |
parse_success_size | Size of logs successfully parsed. |
parse_fail_count | Number of logs that failed to be parsed; global parsing failure statistics. |
parse_fail_size | Size of logs that failed to be parsed. |
json_parse_failures_count | Number of logs that failed JSON parsing; counted only in JSON collection mode. |
json_parse_failures_size | Size of logs that failed JSON parsing. |
delimiter_mismatch_failures_count | Number of logs that failed delimiter matching; counted only in delimiter collection mode. |
delimiter_mismatch_failures_size | Size of logs that failed delimiter matching. |
multi_parse_failures_count | Number of logs that failed combined parsing; parsing successes from subsequent data processing are also counted in this metric. |
multi_parse_failures_size | Size of logs that failed combined parsing. |
regex_match_failures_count | Number of logs that failed regex matching; counted only in full regex collection mode. |
regex_match_failures_size | Size of logs that failed regex matching. |
time_format_success_count | Number of logs with successfully parsed time format. |
time_format_success_size | Size of logs with successfully parsed time format. |
time_format_failures_count | Number of logs that failed time format parsing. |
time_format_failures_size | Size of logs that failed time format parsing. |
Abnormal Monitoring Metrics
Exception monitoring metrics count the various error events encountered by LogListener during its operation.
Field | Description |
file_read_error | Number of file read errors, covering scenarios such as disk I/O errors and file corruption. |
file_permission_error | Number of file permission errors, caused by insufficient file permissions leading to read failure. |
file_not_found_error | Number of file not found errors, file does not exist or cannot be opened. |
file_stat_error | File status acquisition failure error count, counted when the system stat() function fails to obtain file metadata (size, modification time, inode, and so on). |
file_open_limit_error | Number of file descriptor exhaustion errors, triggered when the system file descriptor reaches the process or system-level limit. |
params_invalid_error | Number of configuration parameter errors, for example, when private network access is configured but the actual machine region does not match the target CLS service region. |
send_network_error | Number of network errors, covering scenarios such as network timeout, connection failure, and DNS resolution failure. |
request_error | Number of request errors, covering all other types of request errors, such as HTTP 429, 404, 401, and Topic not found. |
LogListener Self-Monitoring Metrics
LogListener self-monitoring metrics are used to observe the resource consumption, lifecycle, and operational status of the LogListener process itself.
Field | Description |
loglistener_cpu_usage | CPU utilization of the LogListener process. |
loglistener_mem_used | Memory usage of the LogListener process. |
total_open_files | Number of files currently opened by LogListener. When the value approaches the ulimit -n limit, there is a risk that new files cannot be opened. |
total_monitor_dirs | Total number of directories currently under continuous monitoring by LogListener. This metric counts the number of directories for which the collection plugin is currently listening to inotify events. |
max_file_limit | Maximum number of files that can be opened, as configured for LogListener. |
max_dir_limit | Maximum number of directories that can be monitored, as configured for LogListener. |
process_stop_code | Process exit code. It records the status code returned when the LogListener process exits normally or abnormally, with different values corresponding to different exit reasons. |
process_restart_times | Number of abnormal process restarts. It counts the cumulative number of abnormal restarts that have occurred for the LogListener process since its first startup. |
thread_count_business | Number of started business threads. It refers to the number of threads related to successfully started collection tasks for the LogListener process at the current moment. |
thread_count_system_total | Total number of system threads started. It refers to the total number of system-level threads for the LogListener process at the current moment (including all threads such as runtime framework threads and collection business threads). This metric additionally carries the pid Tag. |
task_process_time | Task processing time. It records the cumulative time consumed by threads within LogListener to process log collection tasks. |
task_process_count | Task count. It counts the total number of log collection tasks that have been processed and completed by LogListener since its startup. |
total_log_configs | Number of currently active collection configurations for LogListener. |
Reliability and Fault Tolerance Metrics
Reliability and fault tolerance metrics are used to observe the reliability performance of LogListener in scenarios such as configuration hot reloading and Checkpoint persistence.
Field | Description |
checkpoint_update_count | Number of Checkpoint update writes. LogListener periodically persists collection checkpoints to ensure no data loss upon restart. |
config_reload_success_count | Number of successful configuration hot reloads. |
config_reload_failure_count | Number of configuration hot reload failures. |
System Monitoring Metrics
System monitoring metrics reflect the overall resource usage of the host where LogListener resides, assisting in determining whether collection exceptions are caused by system-level resource constraints.
Field | Description |
system_cpu_usage | Overall CPU utilization of the system. |
system_mem_usage | Total system memory size. |
system_mem_available | Currently available system memory size. |
system_mem_used | Currently used system memory size. |
system_mem_util | System memory utilization. |
system_disk_total_bytes | Total system disk capacity. Currently, the root directory ( /) is collected by default. |
system_disk_used_bytes | Used system disk capacity. |
system_disk_usage_percent | System disk utilization. |
Alarm Monitoring Metrics
Alarm monitoring metrics count the number of alarm events generated internally by LogListener. Combined with service logs, they can be used to quickly locate collector exceptions.
Field | Description |
loglistener_alarm_alarm_count | LogListener alarm count statistics. It counts the total number of all alarm events triggered internally by LogListener. |
피드백