Kudu table monitoring and Tablet analysis can help you identify data hot spots and skew in tables and Tablet deployment.
1. Kudu table analysis provides load information, including table-level, Tablet, and TabletServer read/write QPS and storage.
2. Through Tablet analysis, you can analyze the historical trends of read/write QPS information for tables or TabletServers, based on real-world scenarios.
Directions
1. Log in to the EMR console and click the ID/Name of the corresponding cluster in the cluster list.
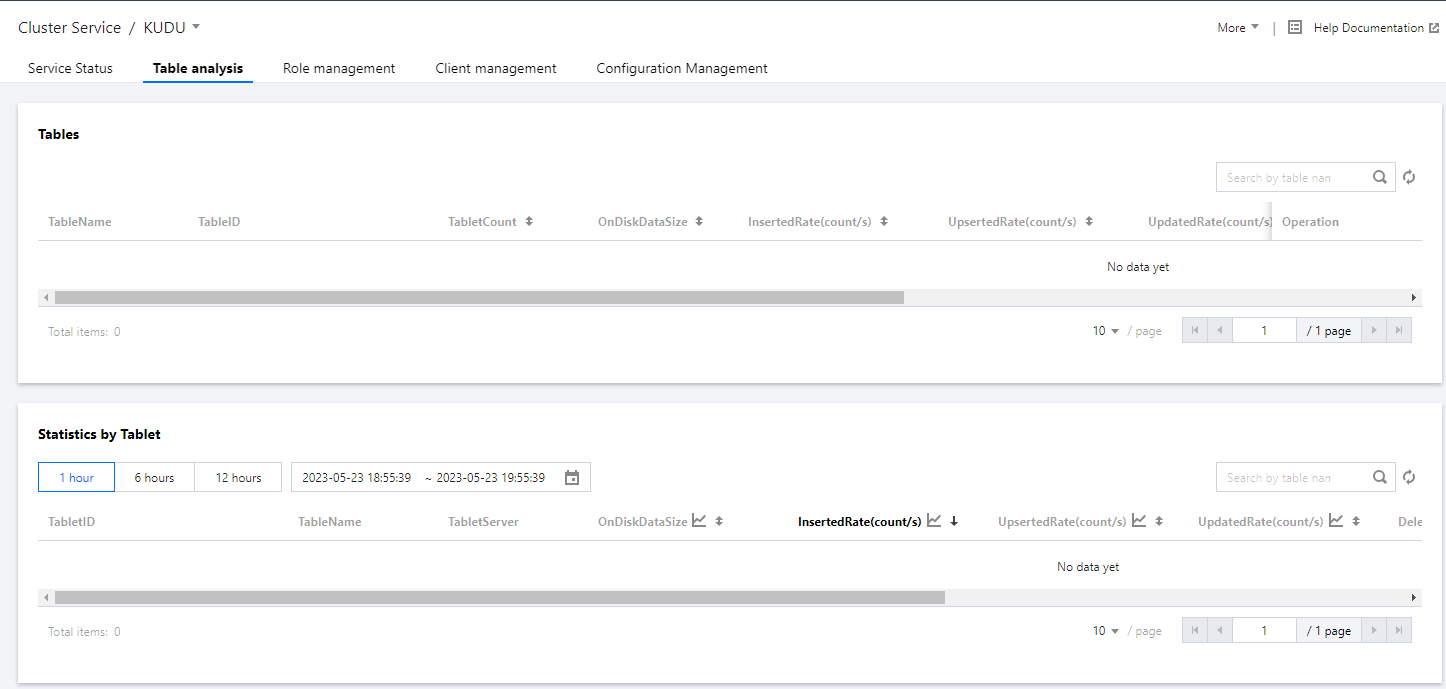
2. On the cluster details page, click Cluster Service and choose Operation > Table Analysis in the top-right corner of the Kudu component block to view the analysis of Kudu table loads.
Supported Operations in the Table List
In the Kudu table list, you can view information about table-level request QPS, write QPS, and OnDiskDataSize storage. You can also identify the top tables in the cluster by using the sorting button in each column header.
Viewing table details
Click a table name to obtain a detailed view of the table. The details page displays the numbers of read/write requests and storage size (including OnDiskDataSize) for the entire table or each individual node. You can switch between nodes by using the node filter in the top-right corner.
Viewing the overall Tablet information
Click Tablets Operation to view the overall information about the read/write request volumes of each Tablet in the table, and identify hot spots within the Tablets.
Viewing Tablet details
Click the corresponding Tablet name to view the Tablet details and metric trends. The details page provides data on request and scan metrics for the selected Tablet at various time granularities. You can change the time granularity in the top-right corner.
Viewing the overall TabletServer information
Click TabletServers Operation to view the overall information about each TabletServer, such as the request latency and data storage.
Tablet Analysis
With Tablet analysis, you can search for the table that a specific region belongs to or filter results by the TabletServer that hosts the region. By examining the average request QPS and average read/write QPS, you can identify hot spots in the cluster where a large number of requests are being processed.
By clicking the view button in the “Average read QPS” or “Average write QPS” column header, you can view the trend of read/write QPS for the current Tablet and observe sudden changes in request traffic. You can specify the time range for the information displayed.