tencent cloud

Tencent Cloud TCHouse-D

Product Introduction
Overview
Concepts
Cluster Architecture
Strengths
Scenarios
Purchase Guide
Billing Overview
Renewal Instructions
Overdue Policy
Refund Instructions
Configuration Adjustment Billing Instructions
Getting Started
Using Tencent Cloud TCHouse-D Through the Console
Using Tencent Cloud TCHouse-D Through a Client
Operation Guide
Cluster Operation
Monitoring and Alarm Configuration
Account Privilege Management
Data Management
Query Management
Modify Configurations
Node Management
Log Analysis
SQL Studio
Enabling Resource Isolation
Development Guide
Design of Data Table
Importing Data
Exporting Data
Basic Feature
Query Optimization
Ecological Expansion Feature
API Documentation
History
Introduction
API Category
Making API Requests
Cluster Operation APIs
Database and Table APIs
Cluster Information Viewing APIs
Hot-Cold Data Layering APIs
Database and Operation Audit APIs
User and Permission APIs
Resource Group Management APIs
Data Types
Error Codes
Cloud Ecosystem
Granting CAM Policies to Sub-accounts
Query Acceleration for Tencent Cloud DLC
Practical Tutorial
Basic Feature Usage
Advanced Features Usage
Resource Specification Selection and Optimization Suggestions
Naming Specifications and Limits to the Database and Data Table
Table Design and Data Import
Query Optimization
Suggested Usage to Avoid
Accessing TCHouse-D via JDBC over the Public Network
Performance Testing
TPC-H Performance Testing
SSB Performance Testing
TPC-DS Performance Testing
FAQs
Common Operational Issues
Common Errors
Contact Us
Glossary
Product Policy
Service Level Agreement
Privacy Policy
Data Processing And Security Agreement

Cluster Monitoring

PDF
Modo Foco
Tamanho da Fonte
Última atualização: 2024-06-27 10:46:35
Tencent Cloud TCHouse-D provides a wide range of monitoring metrics, allowing you to grasp the operating status of the cluster, and configure alarms based on metrics to pay attention to operation information in real time and achieve quick responses.

Monitoring Overview

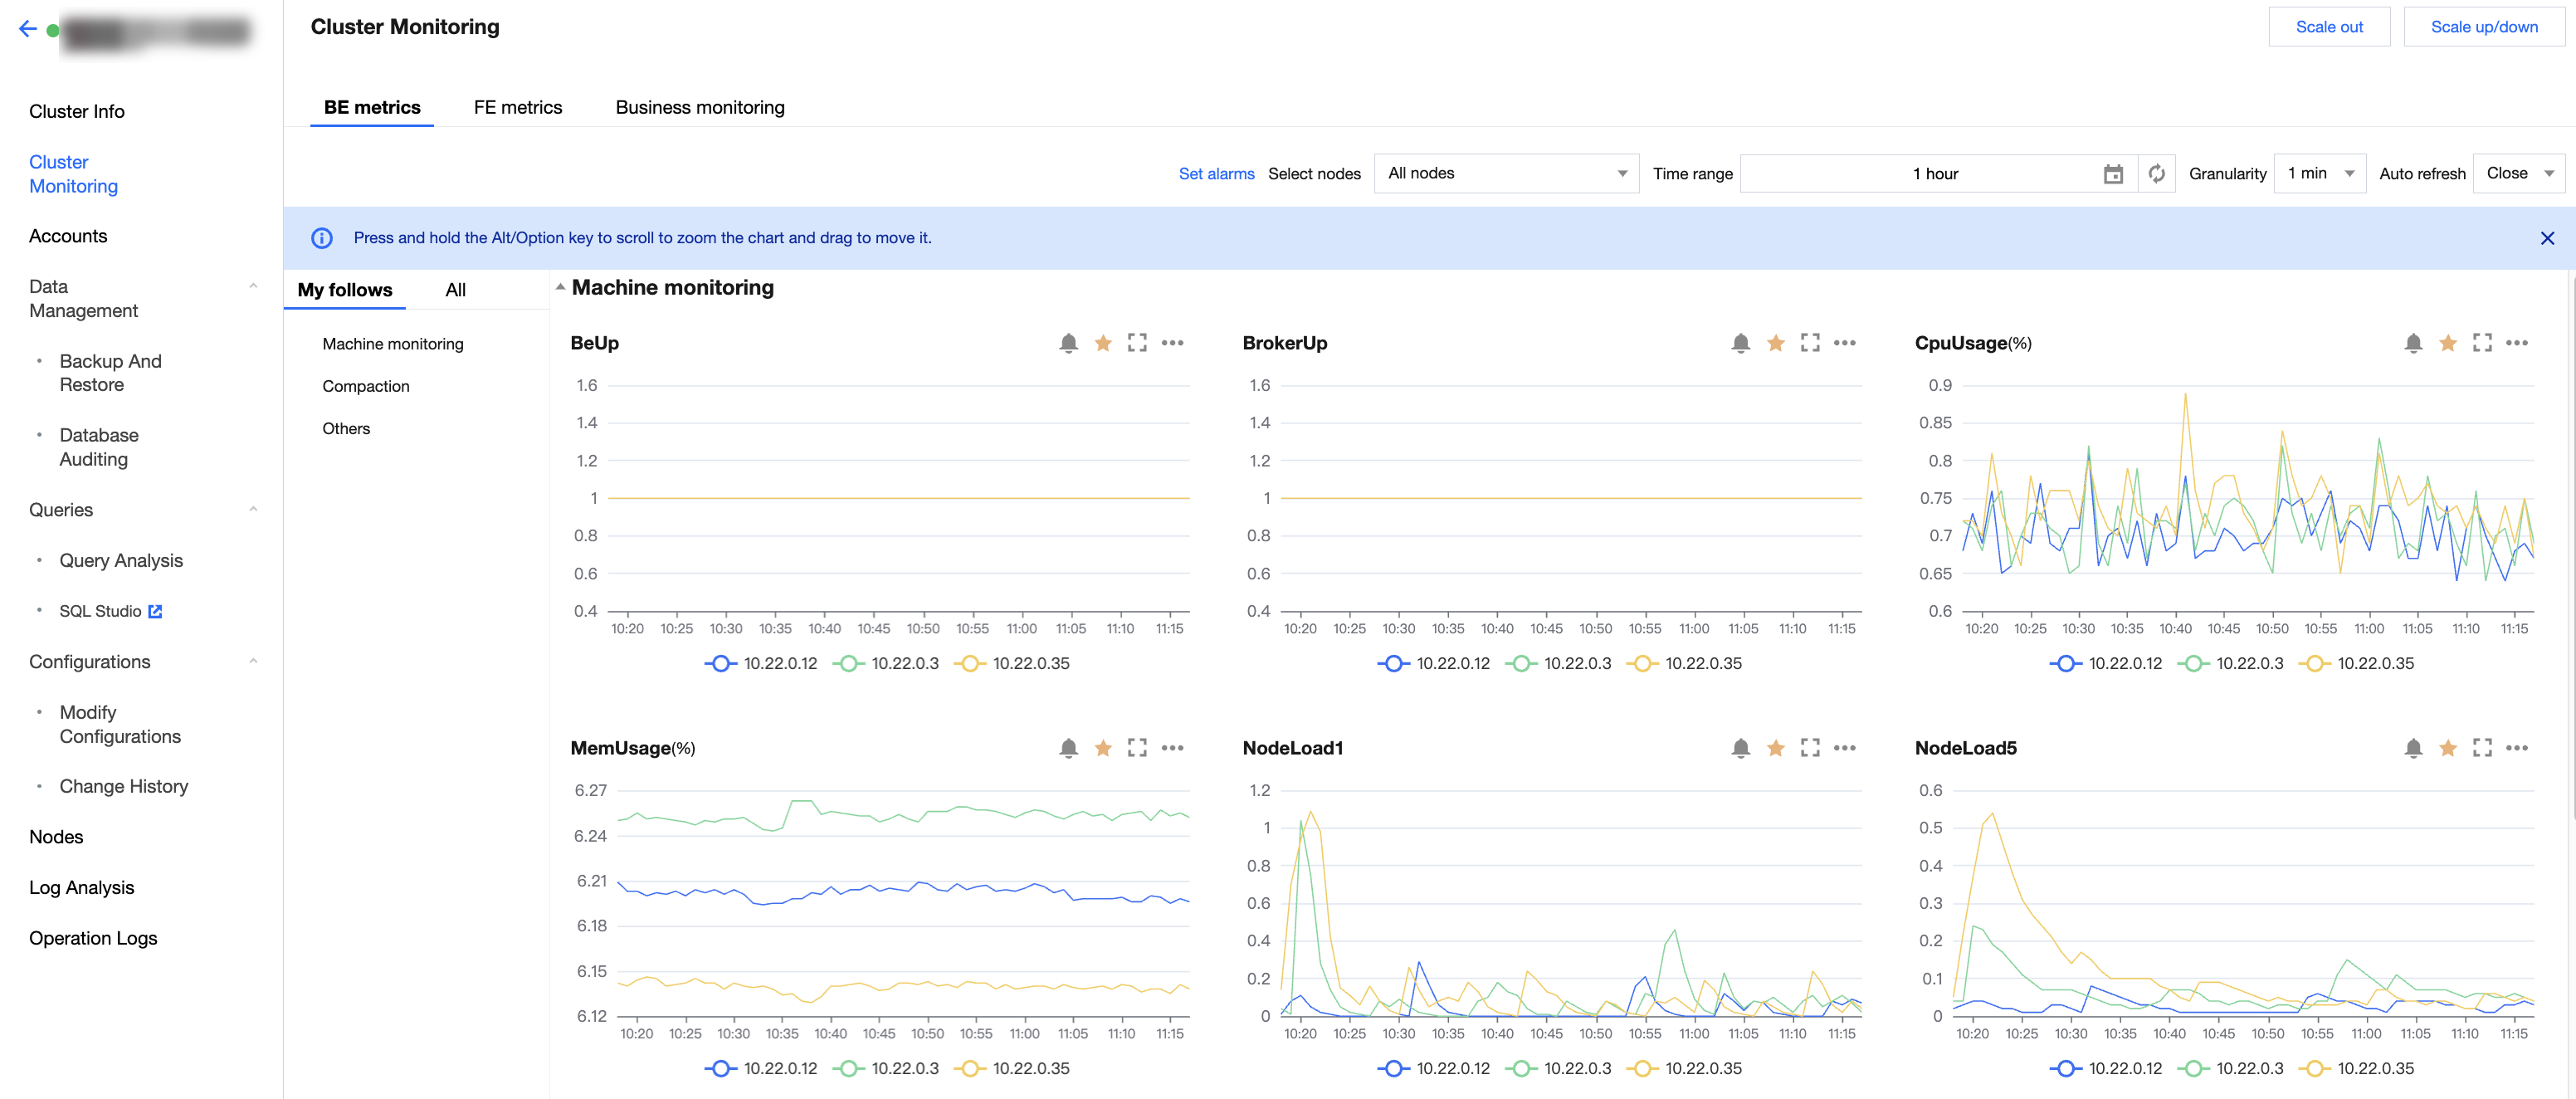
Log in to Tencent Cloud TCHouse-D Console, click on cluster ID/Name to enter the cluster detail page, and click on Cluster Monitoring to check various performance metrics of the cluster.


Note
You can view and export the data for specific monitoring metrics.
Monitoring collection interval is 10 seconds. The timing granularity exhibited can be selected by the user, and the smallest granularity is 1 minute. The monitoring data within the timing granularity are aggregated and shown. The aggregation logic of metric data is to take the maximum.

Feature Details

In general, cluster monitoring is divided into three modules: BE metric monitoring, FE metric monitoring, and business monitoring.
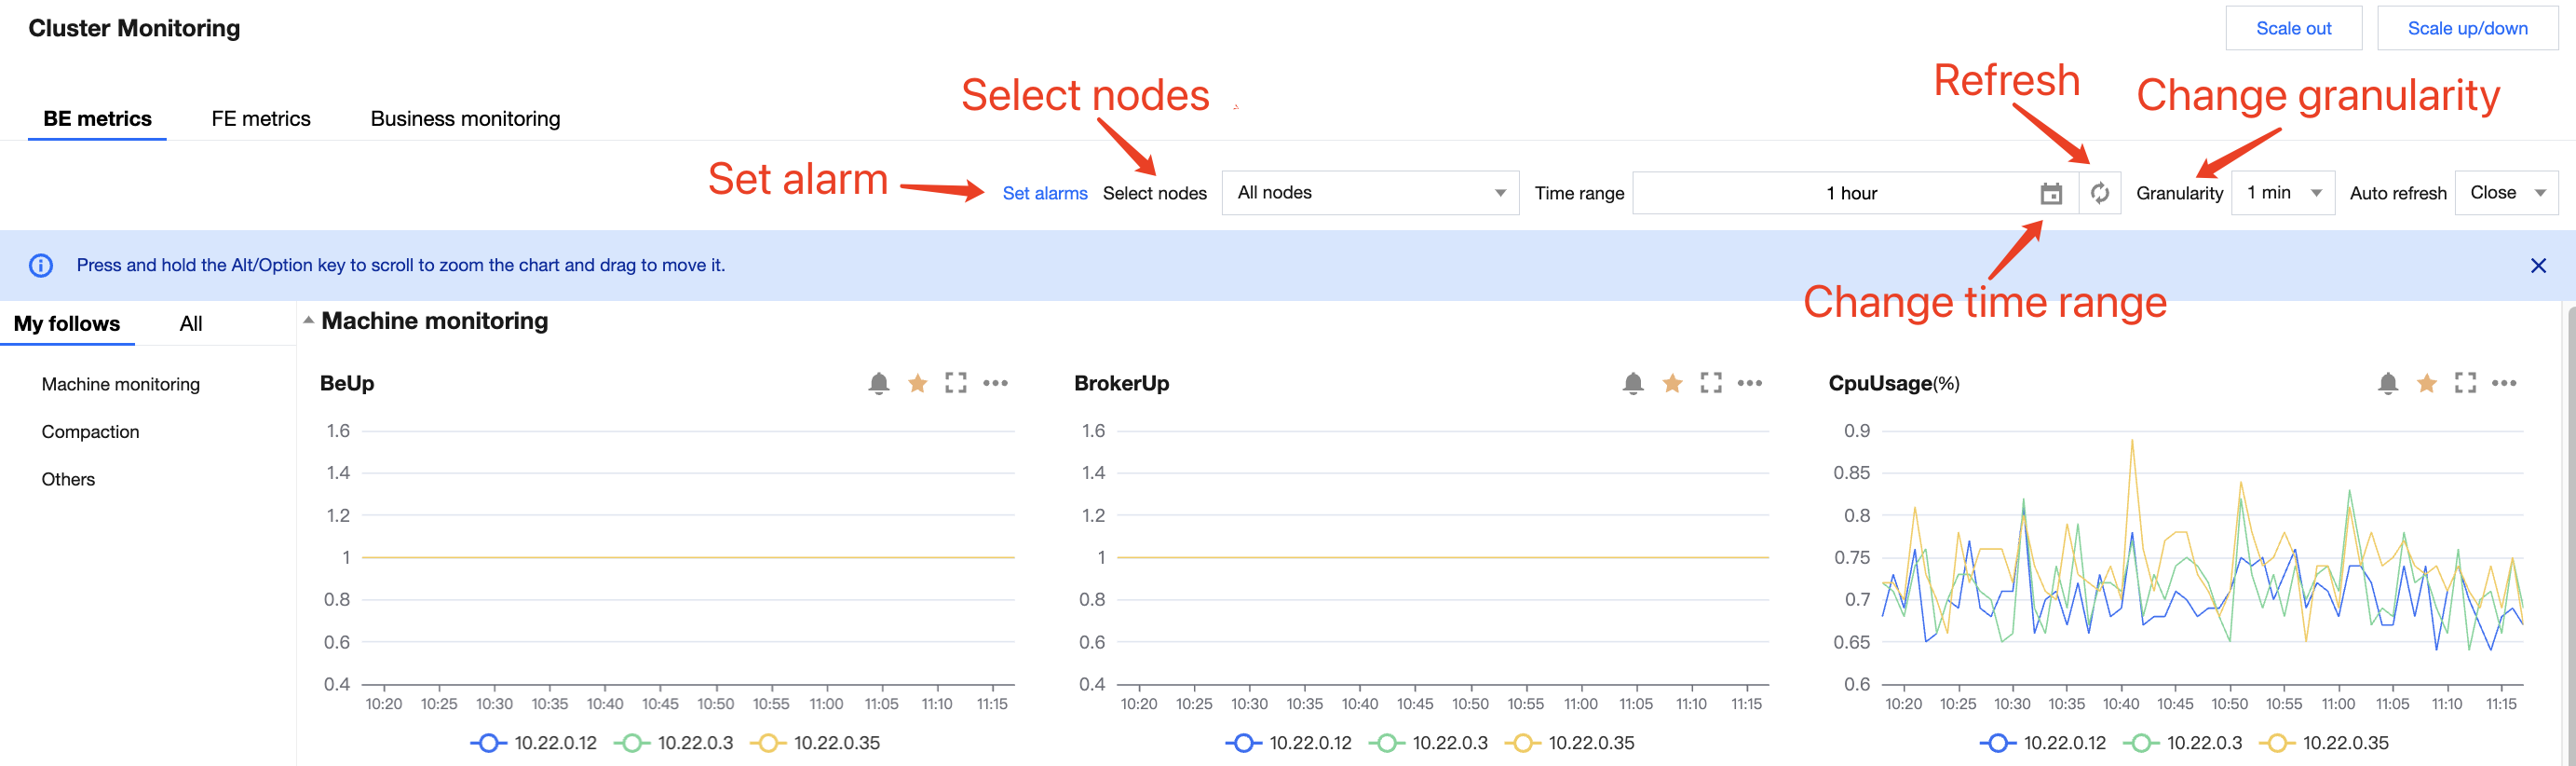
You can adjust the time range of monitoring data to view historical data in different time periods. You can also adjust the timing granularity of monitoring data to view data on different dimension levels.
The monitoring page supports auto-refresh, which updates monitoring charts automatically according to the refresh interval selected by the user, achieving real-time data viewing.


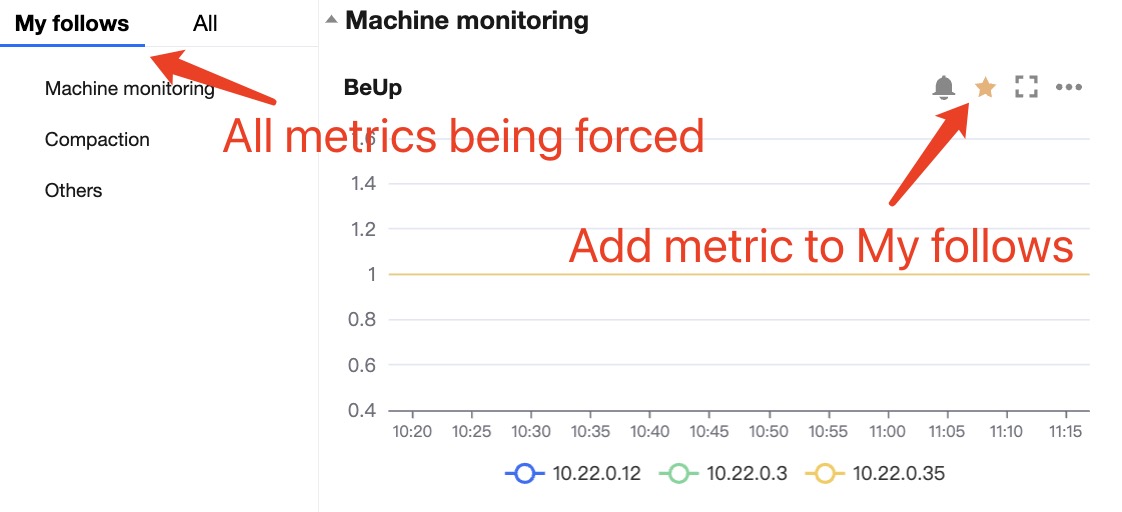
You can add metrics that you wish to focus on to My Follows to quickly view them.
Add metrics to My follows: Click the star-button in the metric chart or the star-button next to the corresponding metric in the metric list.
View favorite metrics: You can switch to My Follows in the metric list and view all important metrics being focused.


Tencent Cloud TCHouse-D Service Monitoring

Cluster monitoring data will be reported to Tencent Cloud Observability Platform, where you can retrieve the monitoring data.

Ajuda e Suporte

Esta página foi útil?

comentários