Instance Operation Monitoring
Scenarios
Polaris provides multiple monitoring metrics for running instances and interfaces to monitor the operation status of Polaris nodes and services, such as: system metrics including CPU, memory, and network. You can use these metrics to understand the real-time operation status of Polaris instances, address potential risks promptly, and ensure stable system operation. This document describes how to view Polaris monitoring data through the TSF console.
Monitoring Metrics and Meanings
Resource Metrics
Metric Category | Metric Name | Meaning of Metrics | Metric Unit |
CPU | CPU utilization | Percentage of CPU resources occupied by server processes | % |
Memory | Memory Utilization | Percentage of memory resources occupied by server processes | % |
Network | Number of inbound network packets | Number of network packets received per second by the server | Per second |
| Number of outbound network packets | Number of network packets sent per second by the server | Per second |
| Inbound network traffic | Amount of data received per second by the server | MBytes/s |
| Outbound network traffic | Amount of data sent per second by the server | MBytes/s |
Disk | Disk read operations per second | Number of disk read operations per second performed by the server | |
| Disk write operations per second | Number of disk write operations per second performed by the server | |
| Disk read bandwidth | Amount of data read per second from disk by the server | Bit/s |
| Disk write bandwidth | Amount of data written per second to disk by the server | Bit/s |

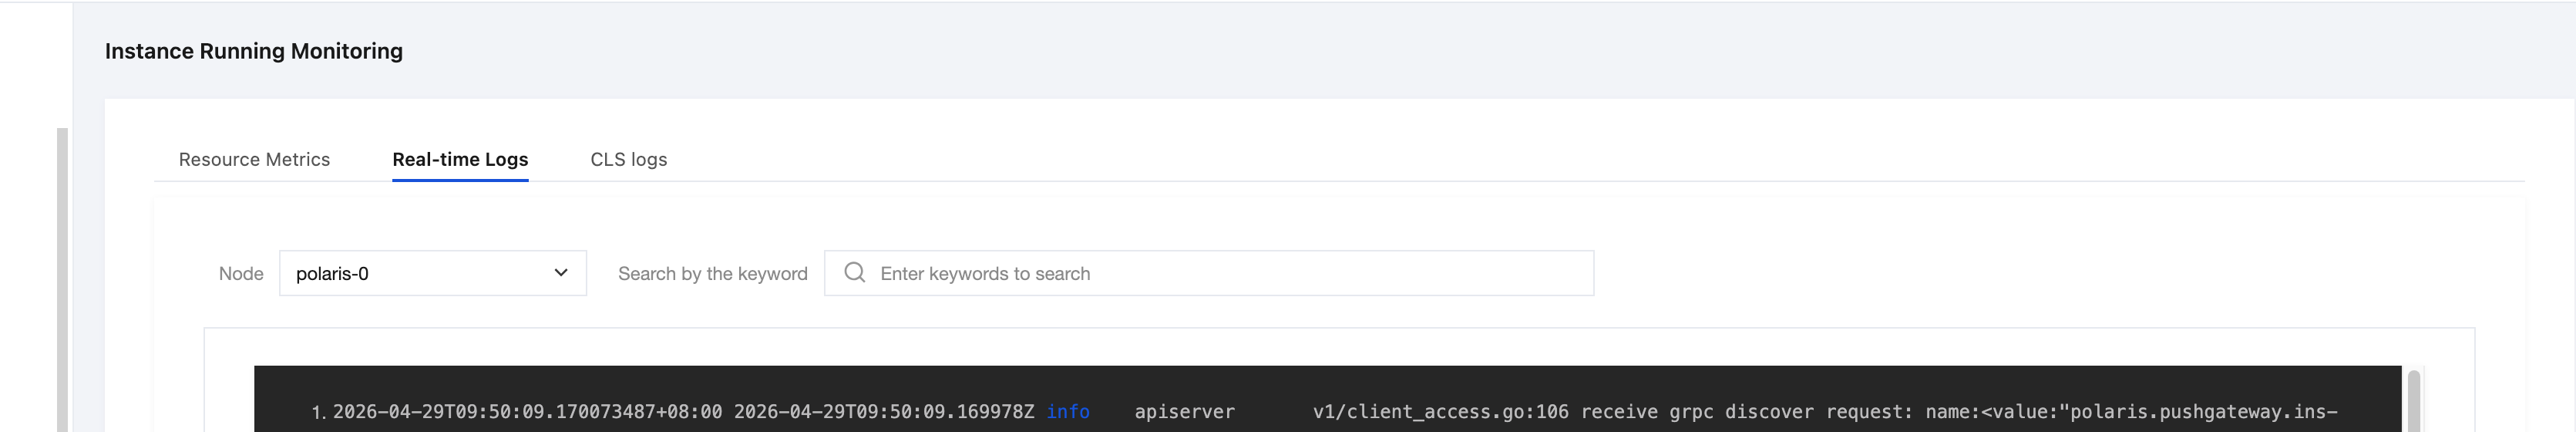
Real-Time Logs
Supports real-time display of Polaris instance logs and keyword search.

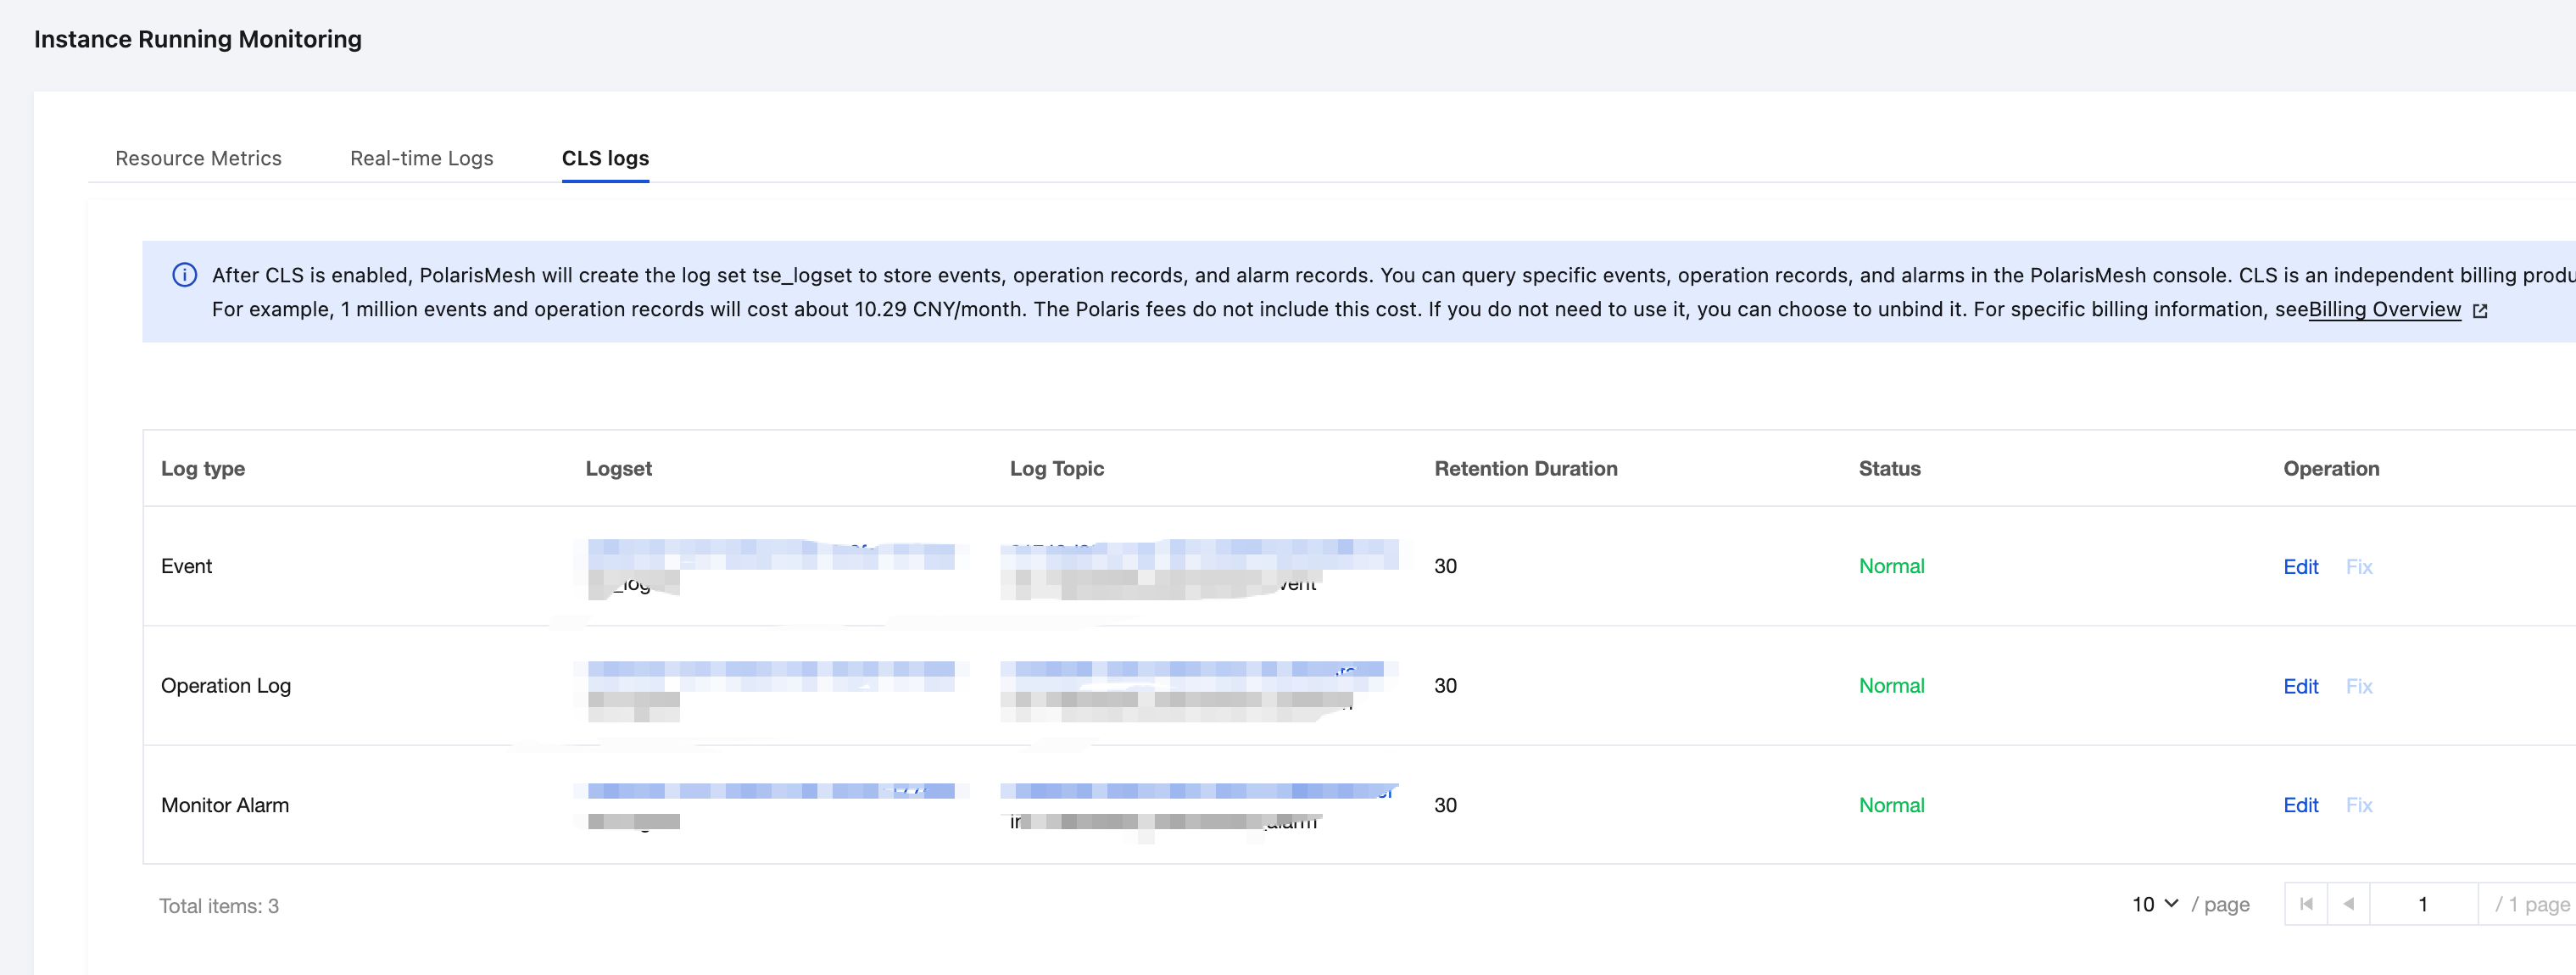
CLS Logs
After enabling CLS, create the logset tse_logset to store events, operation records, and alarms. You can query specific events, operation records, and alarms in the Polaris console.
Note:
CLS is an independently billed product. For example: 1 million events and operation records incur a cost of approximately CNY 10.29/month. This cost is not included in Polaris fees. If not needed, you may choose to unbind it. For specific billing details, see Billing Details.
Viewing the Monitoring Entrance
1. Log in to the TSF console, select Polaris (Polaris) in the left sidebar to go to the engine instance list page.
2. On the Polaris instance list page, click the "ID" of the target instance to go to the Basic Information page.
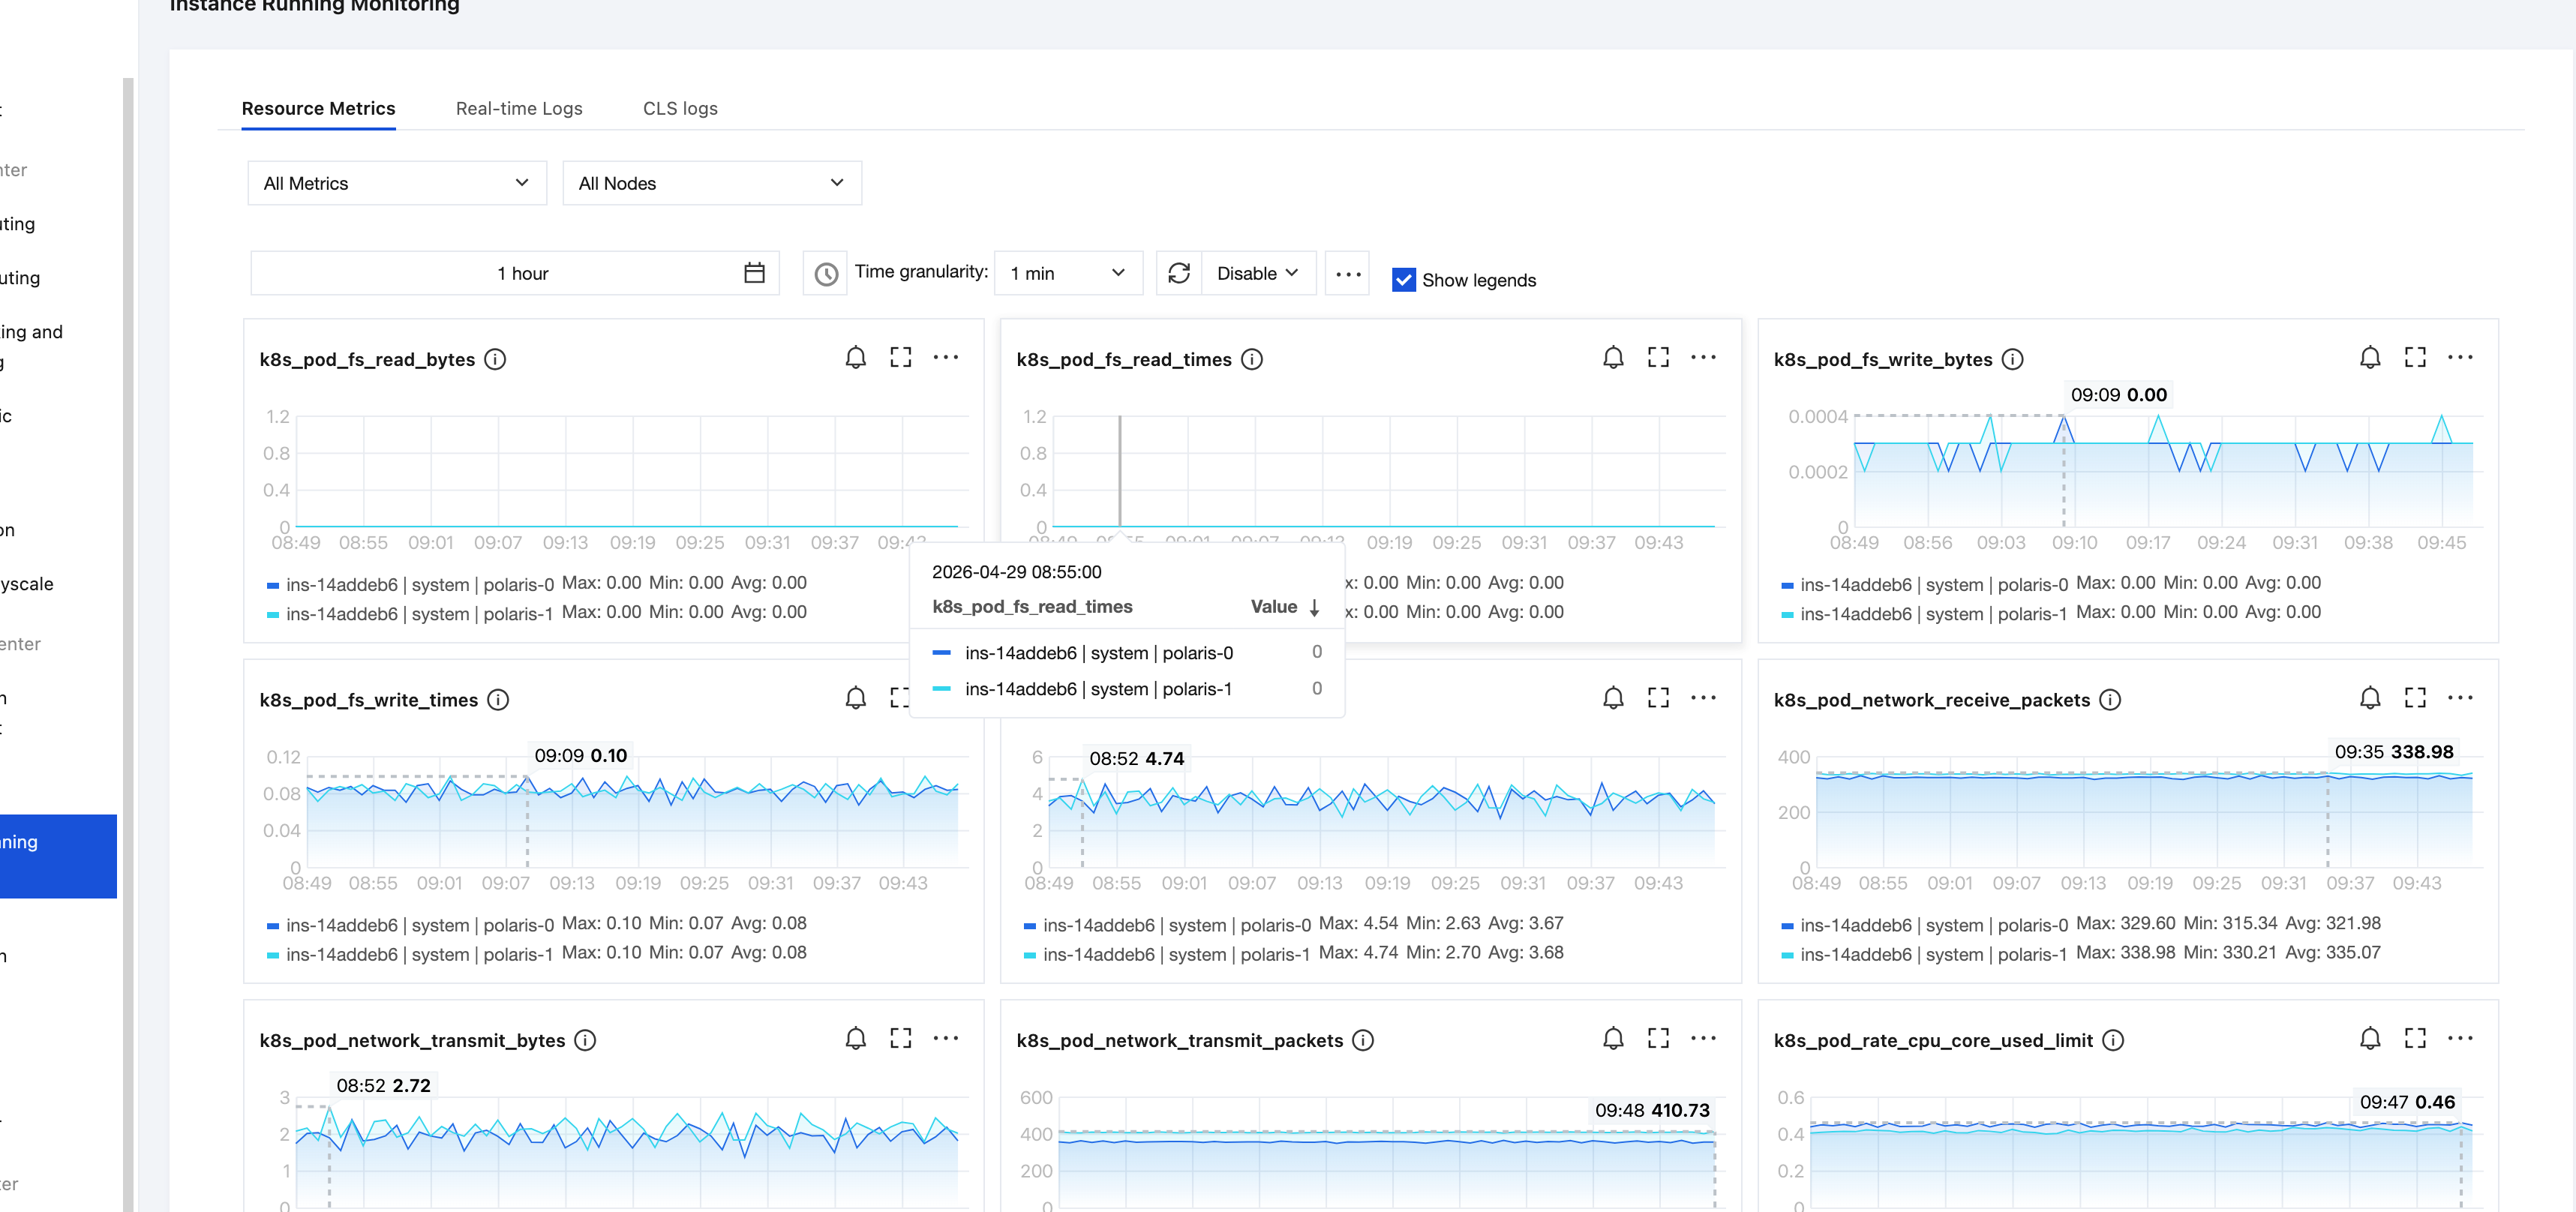
3. On the left tab, click Instance Operation Monitoring to view business metrics and system metrics.
After selecting the Metric, Node, and Namespace, and setting the time range (supports Last 1 hour, Last 12 hours, Last 1 day, Last 30 days, and Custom) and time granularity (1 minute, 5 minutes), you can view the corresponding monitoring data.
Icon | Description |
 | Click to view the year-over-year and month-over-month comparison of monitoring metrics. |
 | Click to refresh and obtain the latest monitoring data. |
 | You can click the icon to replicate a chart to the dashboard. For more information about the dashboard, see What Is a Dashboard. |
 | Select this box to display the legend information on the chart. |
 |
After selecting the Metric, Node, and Interface, and setting the time range (supports Last 1 hour, Last 12 hours, Last 1 day, Last 30 days, and Custom), you can view the corresponding monitoring data.
1. After a node is selected, you can view its runtime logs.
2. On the log page, you can enter keywords in the search box to query related logs. For example: enter "info" to search. Note that log search is case-sensitive.
Polaris persistent logs, Event Center data, operation records, and alarm data are stored in CLS. You can view them after enabling the CLS log service.

Ajuda e Suporte
Esta página foi útil?
Você também pode entrar em contato com a Equipe de vendas ou Enviar um tíquete em caso de ajuda.
comentários