tencent cloud

云数据库 PostgreSQL

动态与公告
产品动态
产品简介
产品概述
产品特性
产品优势
应用场景
信息安全说明
地域和可用区
产品功能列表
大版本生命周期说明
MSSQL 兼容版
产品计费
计费概述
实例类型与规格
购买方式
退费说明
欠费说明
备份空间收费说明
快速入门
创建 PostgreSQL 实例
连接 PostgreSQL 实例
管理 PostgreSQL 实例
数据导入
通过 DTS 迁移数据
内核能力介绍
内核版本概述
内核版本更新动态
查看内核版本
自研内核功能介绍
数据库审计
审计服务说明
开通审计服务
查看审计日志
修改审计服务
审计性能说明
用户指南
实例管理
升级实例
CPU 弹性扩容
只读实例
账号管理
数据库管理
参数管理
日志管理及分析
备份与恢复
数据迁移
插件管理
网络管理
访问管理
数据安全
租户及资源隔离
安全组
监控与告警
标签
AI 实践
使用 tencentdb_ai 插件调用大模型
使用 tencentdb_ai 插件构建 AI 应用
结合 Supabase 快速构建基于云数据库 PostgreSQL 的后端服务
实践教程
跨库访问
如何在 PostgreSQL 中自动创建分区
基于 pg_roaringbitmap 实现超大规模标签查找
一条 SQL 实现查询附近的人
如何配置云数据库 PostgreSQL 作为 GitLab 外部数据源
通过 cos_fdw 插件支持分级存储能力
通过 pgpool 实现读写分离
通过 auto_explain 插件实现慢 SQL 分析
使用 pglogical 进行逻辑复制
使用 Debezium 采集 PostgreSQL 数据
在 CVM 本地搭建 PostgreSQL 异地灾备环境
只读实例与只读组实践教程
如何使用云函数定时操作数据库
表膨胀处理
性能白皮书
测试方法
测试结果
API 文档
History
Introduction
API Category
Making API Requests
Instance APIs
Read-only Replica APIs
Backup and Recovery APIs
Parameter Management APIs
Security Group APIs
Performance Optimization APIs
Account APIs
Specification APIs
Network APIs
Data Types
Error Codes
常见问题
相关协议
Service Level Agreement
Terms of Service
词汇表
联系我们
文档云数据库 PostgreSQL实践教程通过 auto_explain 插件实现慢 SQL 分析

通过 auto_explain 插件实现慢 SQL 分析

PDF
聚焦模式
字号
最后更新时间: 2025-05-21 16:01:17
注意:
auto_explain 的开启需要重启数据库,请您提前规划运维时间窗。
auto_explain 开启后会有一定的性能损耗,与具体的业务有关,请先充分测试。
auto_explain 开启后可能会因为产生过多的日志而导致磁盘空间的上升,请知悉。
如您需要开启 auto_explain 并下载日志,请 提交工单 联系我们。

重点参数说明

auto_explain 插件提供一种自动记录 SQL 执行计划的功能。当您在实例中开启该插件之后,可以通过在 控制台 的参数设置中,进行详细能力的配置。下面将针对重点的几个参数进行说明,详细说明请参考 官方文档
auto_explain.log_min_duration
该参数主要用于决定执行耗时超过多长时间的 SQL 语句会被记录执行计划。默认为 -1,代表不记录。自定义范围500-60000 ,单位为毫秒。
auto_explain.log_analyze
加此参数可以打印执行计划的实际执行时间。默认 off ,关闭状态。
auto_explain.log_timing
加此参数可以打印语句执行时间。默认 off ,关闭状态。
auto_explain.log_verbose
加此参数可以增加 explain 中 verbose 信息输出,获得更详细的执行计划信息。默认 off ,关闭状态。

示例说明

假如实例中有 database a_all,该 database 的 public 模式下有10张表格,分别为:student_info_b0、student_info_b1、student_info_b2、student_info_b3、student_info_b4、student_info_b5、student_info_b6、student_info_b7、student_info_b8、student_info_b9
当前云数据库 PostgreSQL 实例已经开启了 auto_explain 插件。其参数值如下:
a_all=> show auto_explain.log_min_duration;
auto_explain.log_min_duration
-------------------------------
800ms
(1 row)

a_all=> show auto_explain.log_analyze;
auto_explain.log_analyze
--------------------------
on
(1 row)

a_all=> show auto_explain.log_verbose;
auto_explain.log_verbose
--------------------------
on
(1 row)

a_all=> show auto_explain.log_timing;
auto_explain.log_timing
-------------------------
on
(1 row)
执行如下语句:
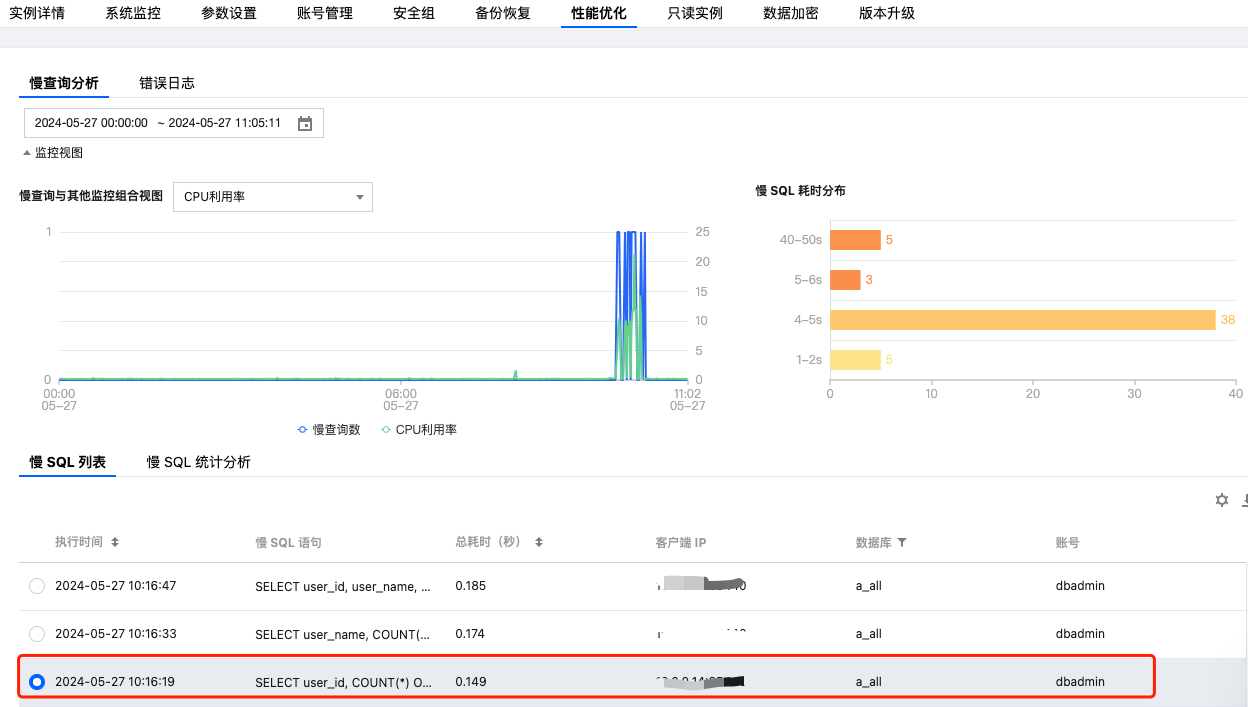
SELECT user_id, COUNT(*) OVER (PARTITION BY user_id) as countFROM ( SELECT user_id FROM student_info_b0 UNION ALL SELECT user_id FROM student_info_b1 UNION ALL SELECT user_id FROM student_info_b2 UNION ALL SELECT user_id FROM student_info_b3 UNION ALL SELECT user_id FROM student_info_b4 UNION ALL SELECT user_id FROM student_info_b5 UNION ALL SELECT user_id FROM student_info_b6 UNION ALL SELECT user_id FROM student_info_b7 UNION ALL SELECT user_id FROM student_info_b8 UNION ALL SELECT user_id FROM student_info_b9) AS all_students;
云数据库 PostgreSQL 的控制台 看到的慢日志记录如图所示:


下载的 auto_explain 日志中执行计划如下:
duration: 147.603 ms plan:
Query Text: SELECT user_id, COUNT(*) OVER (PARTITION BY user_id) as count
FROM (
SELECT user_id FROM student_info_b0
UNION ALL
SELECT user_id FROM student_info_b1
UNION ALL
SELECT user_id FROM student_info_b2
UNION ALL
SELECT user_id FROM student_info_b3
UNION ALL
SELECT user_id FROM student_info_b4
UNION ALL
SELECT user_id FROM student_info_b5
UNION ALL
SELECT user_id FROM student_info_b6
UNION ALL
SELECT user_id FROM student_info_b7
UNION ALL
SELECT user_id FROM student_info_b8
UNION ALL
SELECT user_id FROM student_info_b9
) AS all_students;
WindowAgg (cost=19181.71..21924.66 rows=156740 width=14) (actual time=56.009..116.522 rows=157000 loops=1)
Output: student_info_b0.user_id, count(*) OVER (?)
-> Sort (cost=19181.71..19573.56 rows=156740 width=6) (actual time=55.956..72.756 rows=157000 loops=1)
Output: student_info_b0.user_id
Sort Key: student_info_b0.user_id
Sort Method: external merge Disk: 2448kB
-> Append (cost=0.00..3511.10 rows=156740 width=6) (actual time=0.010..20.861 rows=157000 loops=1)
-> Seq Scan on public.student_info_b0 (cost=0.00..272.74 rows=15674 width=4) (actual time=0.009..1.367 rows=15700 loops=1)
Output: student_info_b0.user_id
-> Seq Scan on public.student_info_b1 (cost=0.00..272.74 rows=15674 width=6) (actual time=0.005..1.302 rows=15700 loops=1)
Output: student_info_b1.user_id
-> Seq Scan on public.student_info_b2 (cost=0.00..272.74 rows=15674 width=6) (actual time=0.004..1.316 rows=15700 loops=1)
Output: student_info_b2.user_id
-> Seq Scan on public.student_info_b3 (cost=0.00..272.74 rows=15674 width=6) (actual time=0.005..1.318 rows=15700 loops=1)
Output: student_info_b3.user_id
-> Seq Scan on public.student_info_b4 (cost=0.00..272.74 rows=15674 width=6) (actual time=0.006..1.320 rows=15700 loops=1)
Output: student_info_b4.user_id
-> Seq Scan on public.student_info_b5 (cost=0.00..272.74 rows=15674 width=6) (actual time=0.005..1.294 rows=15700 loops=1)
Output: student_info_b5.user_id
-> Seq Scan on public.student_info_b6 (cost=0.00..272.74 rows=15674 width=6) (actual time=0.004..1.377 rows=15700 loops=1)
Output: student_info_b6.user_id
-> Seq Scan on public.student_info_b7 (cost=0.00..272.74 rows=15674 width=6) (actual time=0.005..1.327 rows=15700 loops=1)
Output: student_info_b7.user_id
-> Seq Scan on public.student_info_b8 (cost=0.00..272.74 rows=15674 width=6) (actual time=0.006..1.285 rows=15700 loops=1)
Output: student_info_b8.user_id
-> Seq Scan on public.student_info_b9 (cost=0.00..272.74 rows=15674 width=6) (actual time=0.004..1.293 rows=15700 loops=1)
Output: student_info_b9.user_id

如此,我们能清晰的查看该慢 SQL 的详细执行计划,并进行后续的业务分析。

帮助和支持

本页内容是否解决了您的问题?

填写满意度调查问卷,共创更好文档体验。

文档反馈