Data annotation (also known as conditional styling) provides special annotations for elements in a chart to help quickly identify annotated information.
Data annotation settings consist of 2 parts, that is, "annotation conditions" and "annotation styles". The "annotation conditions" define the range of objects to be annotated, while "annotation styles" specify the display style of the objects to be annotated.
Currently, annotation is supported for table and crosstab components. Support for other components is being added iteratively.
This document introduces the following operations:
Table Component Data Annotation
Annotation Description
Table Component Data Annotation
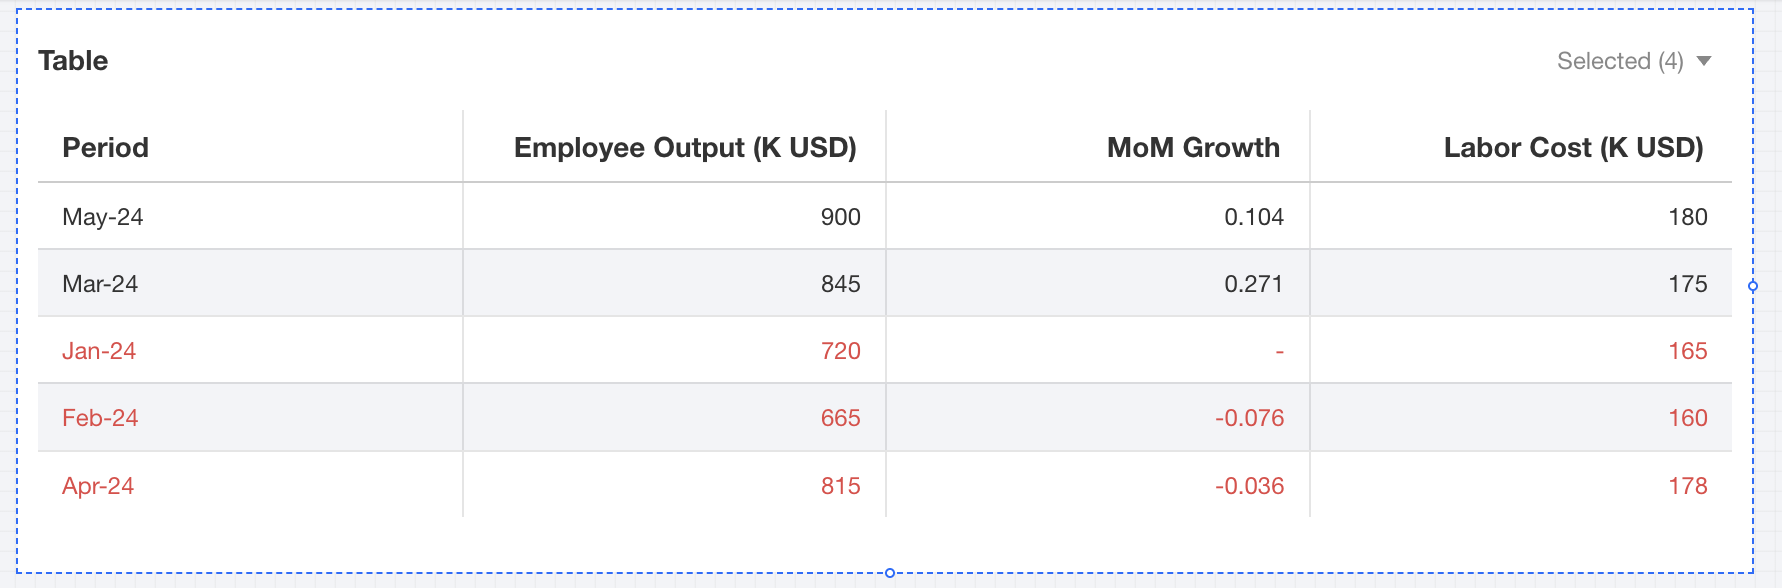
Data annotation enables special style settings for target cells to help easily identify abnormal data in tables.
If we need to mark in red the data where the month-over-previous month ratio of "employee output value" is less than 0 in a table, perform the following operations:
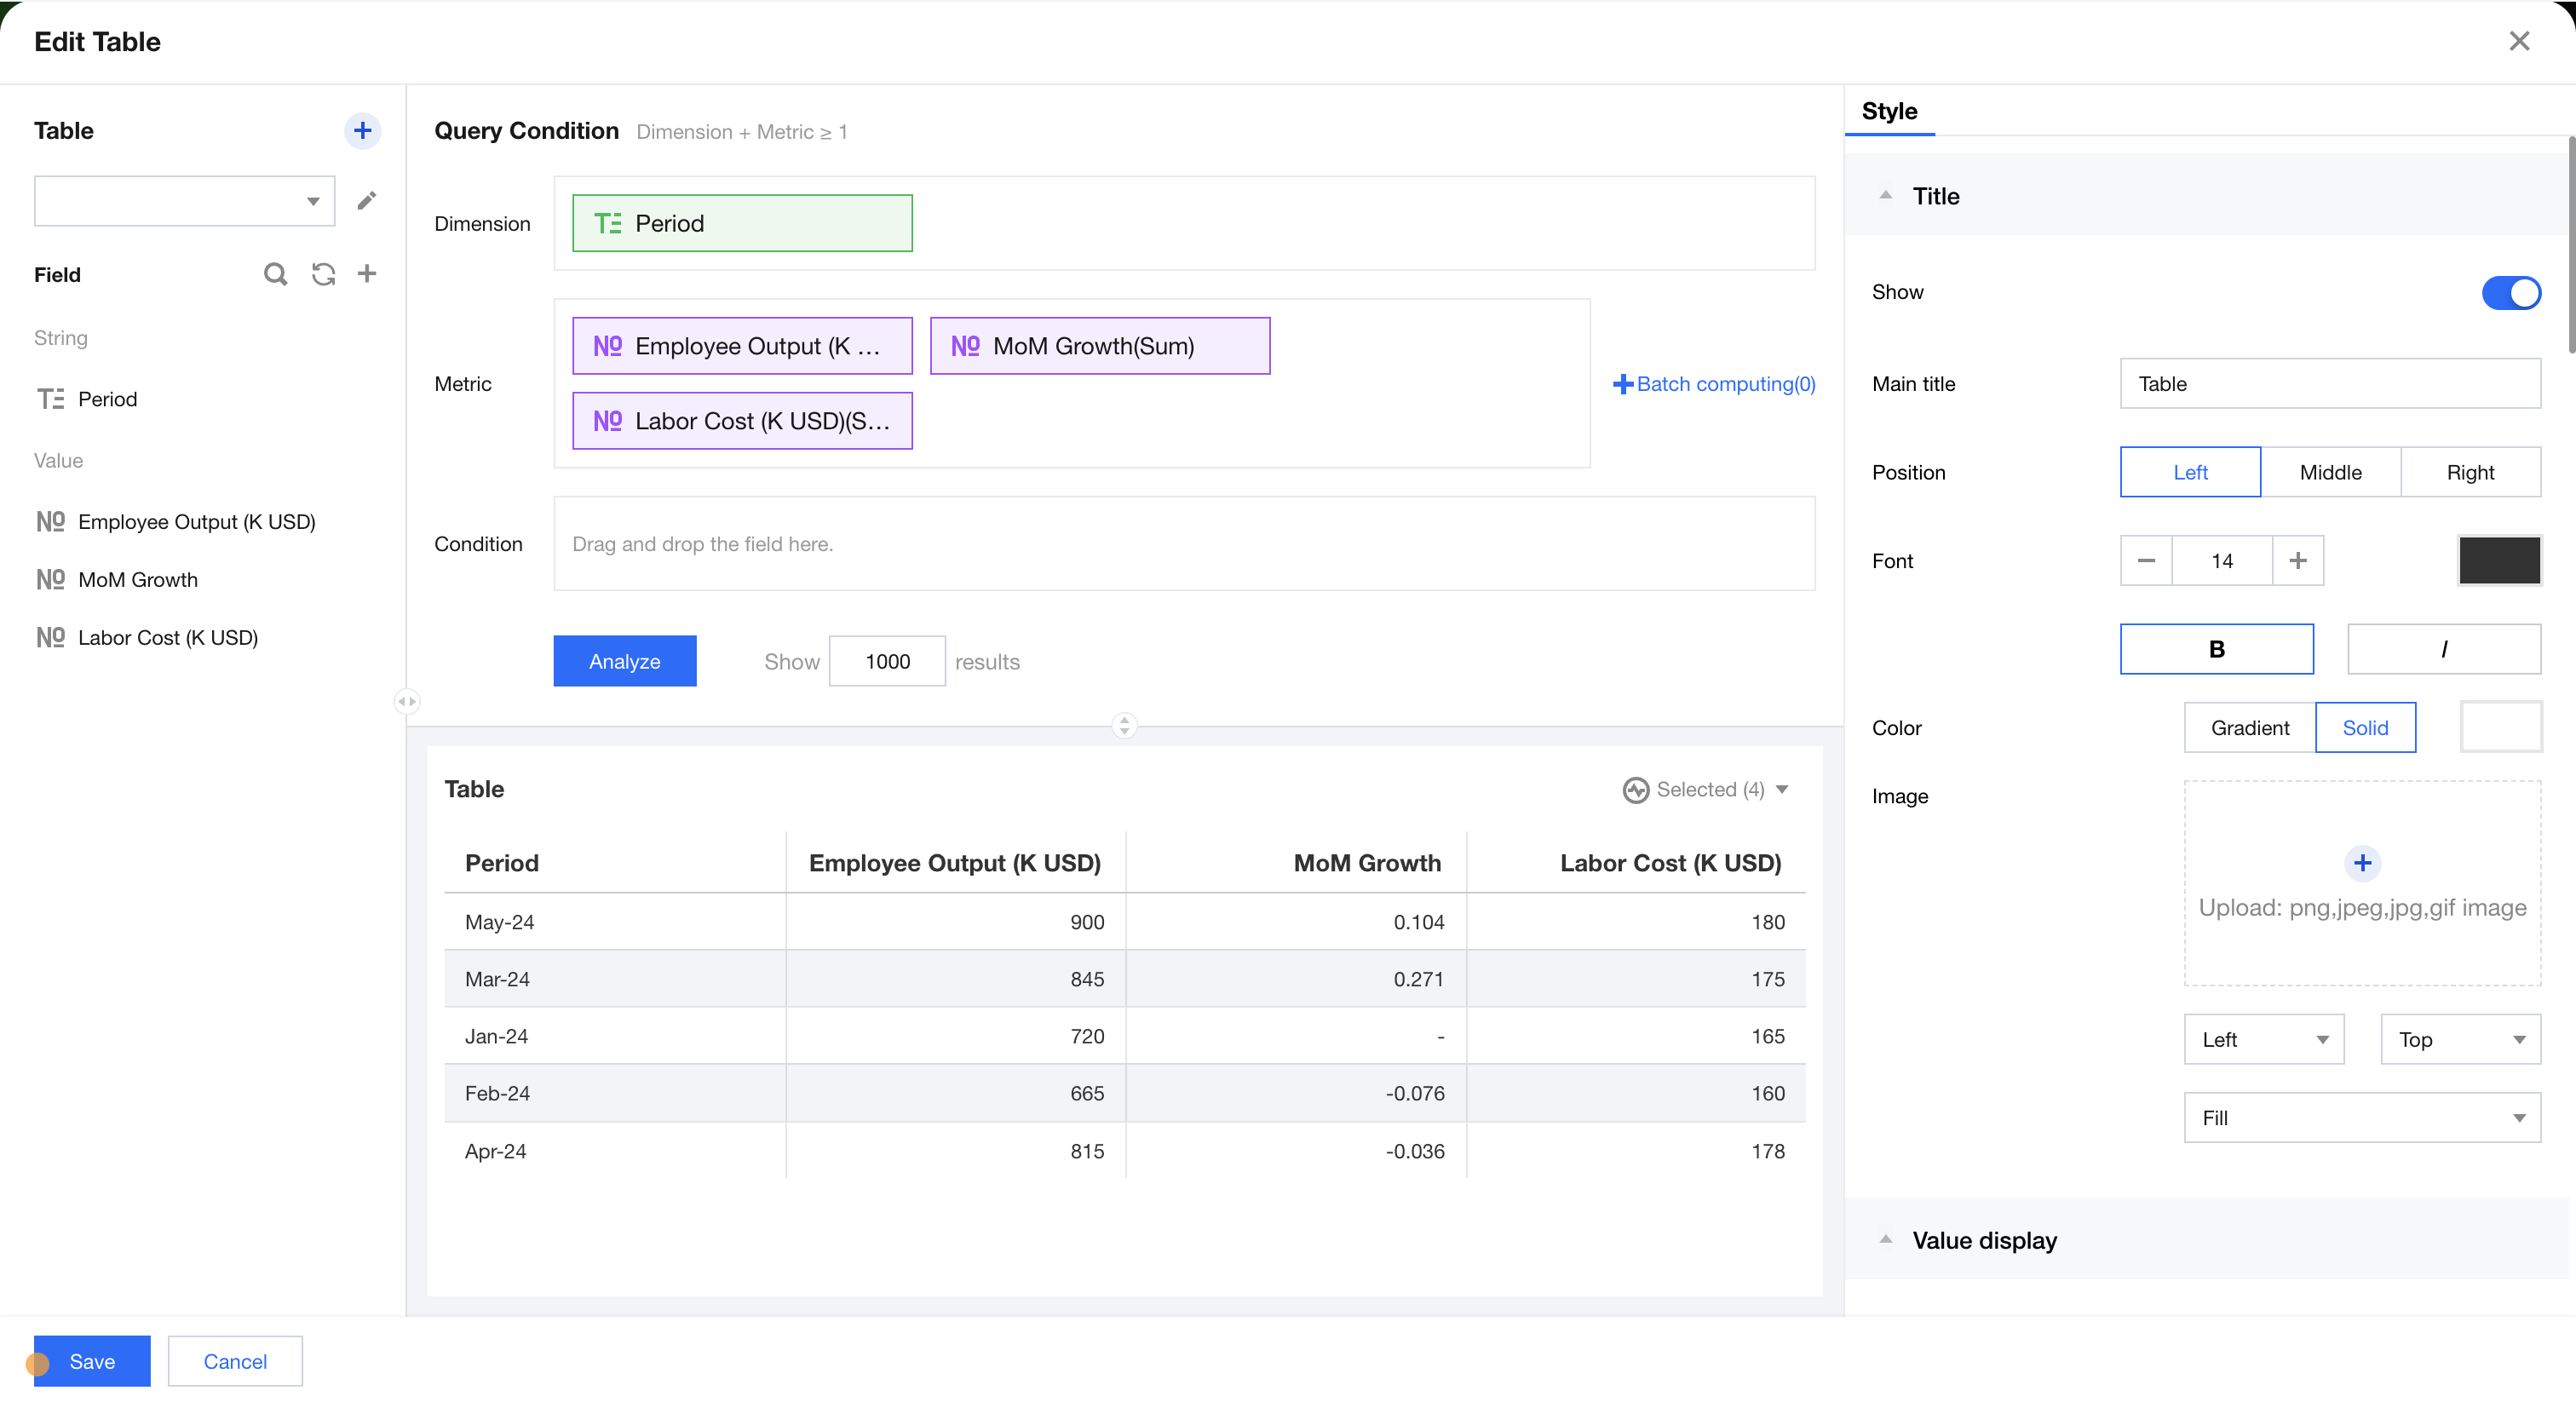
1. Adding a Component and Setting Analytical Metrics
Drag and drop the table component into the canvas, set the dimension to "statistical time" and the metric to "employee output value" and "month-on-month".
The "month-on-month" value is obtained by dragging in "employee output value" for quick calculation (interval-valued comparison and periodically-valued comparison - period-over-previous period ratio - month-over-previous month ratio - growth rate) and modifying the display name.
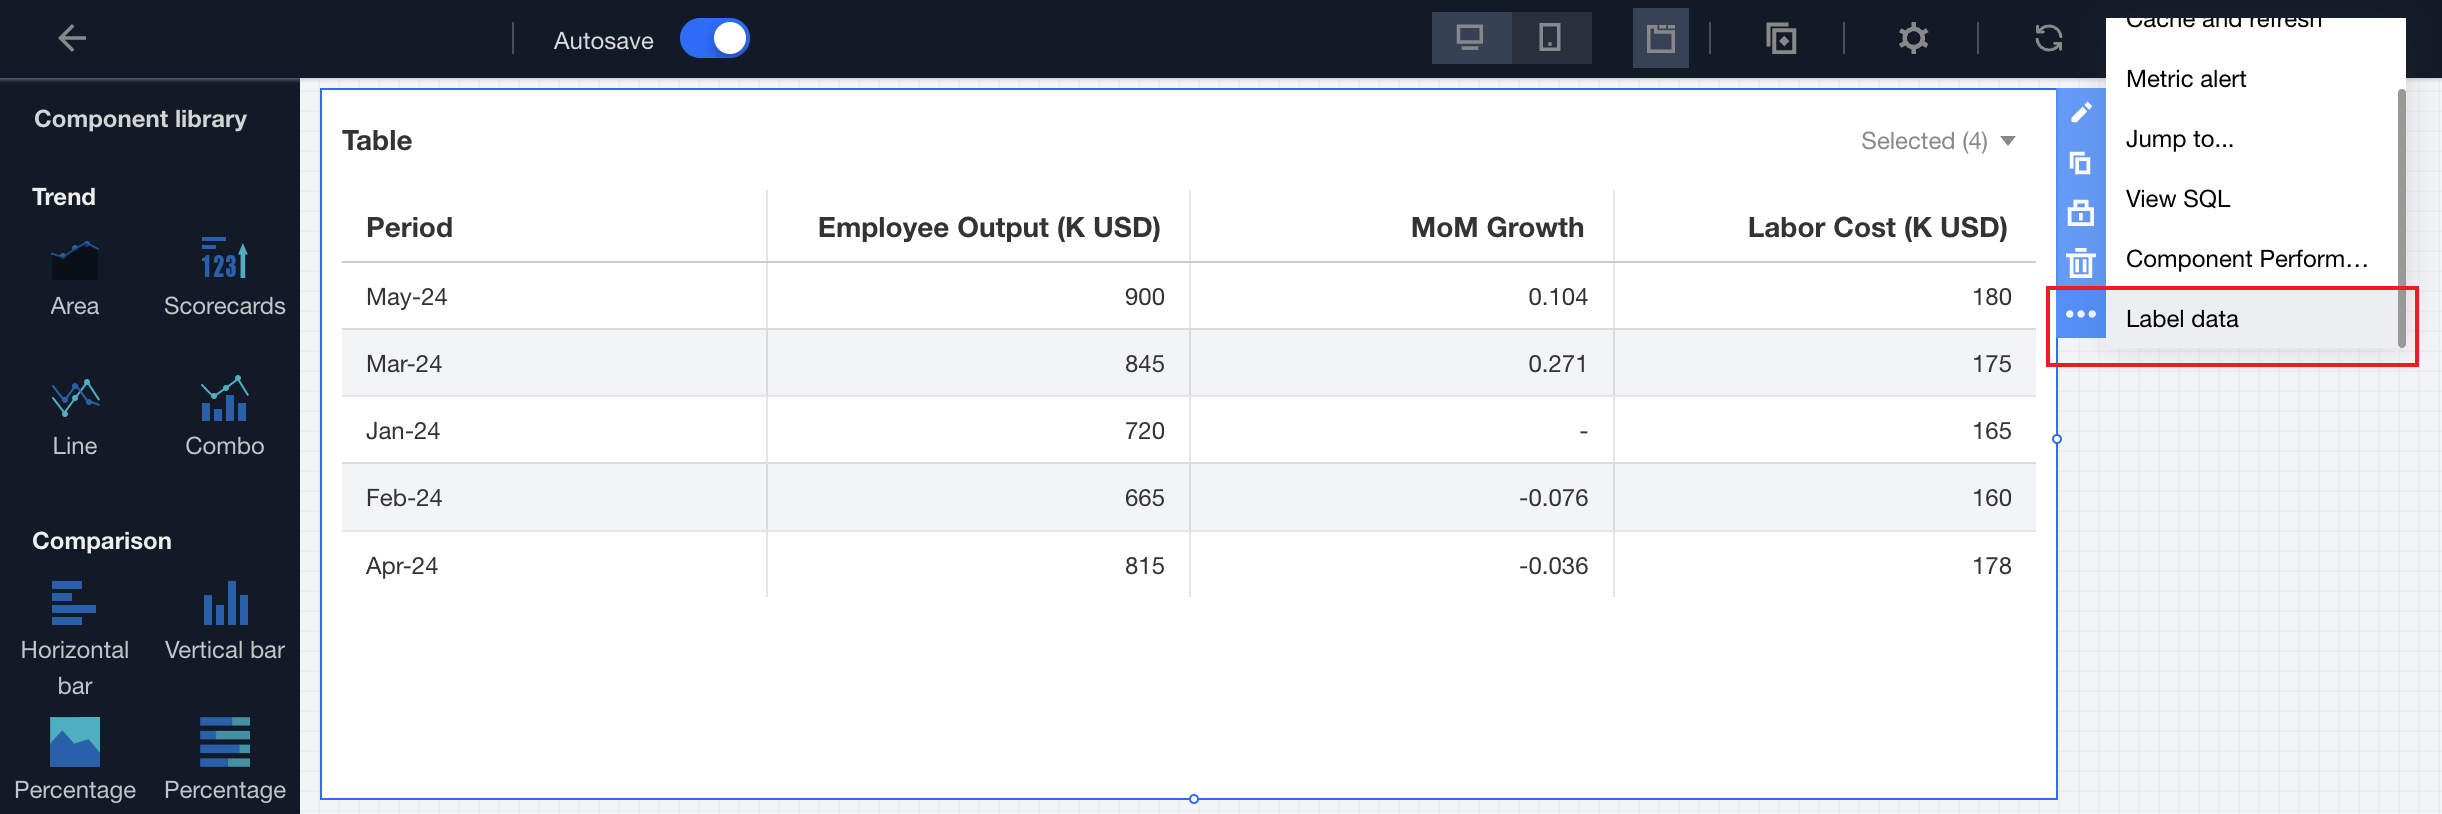
2. Enabling Data Annotation
Click the component, then select Data Labeling from the toolbar.
Clickthe data label, then the settings pop-up layer will appear.
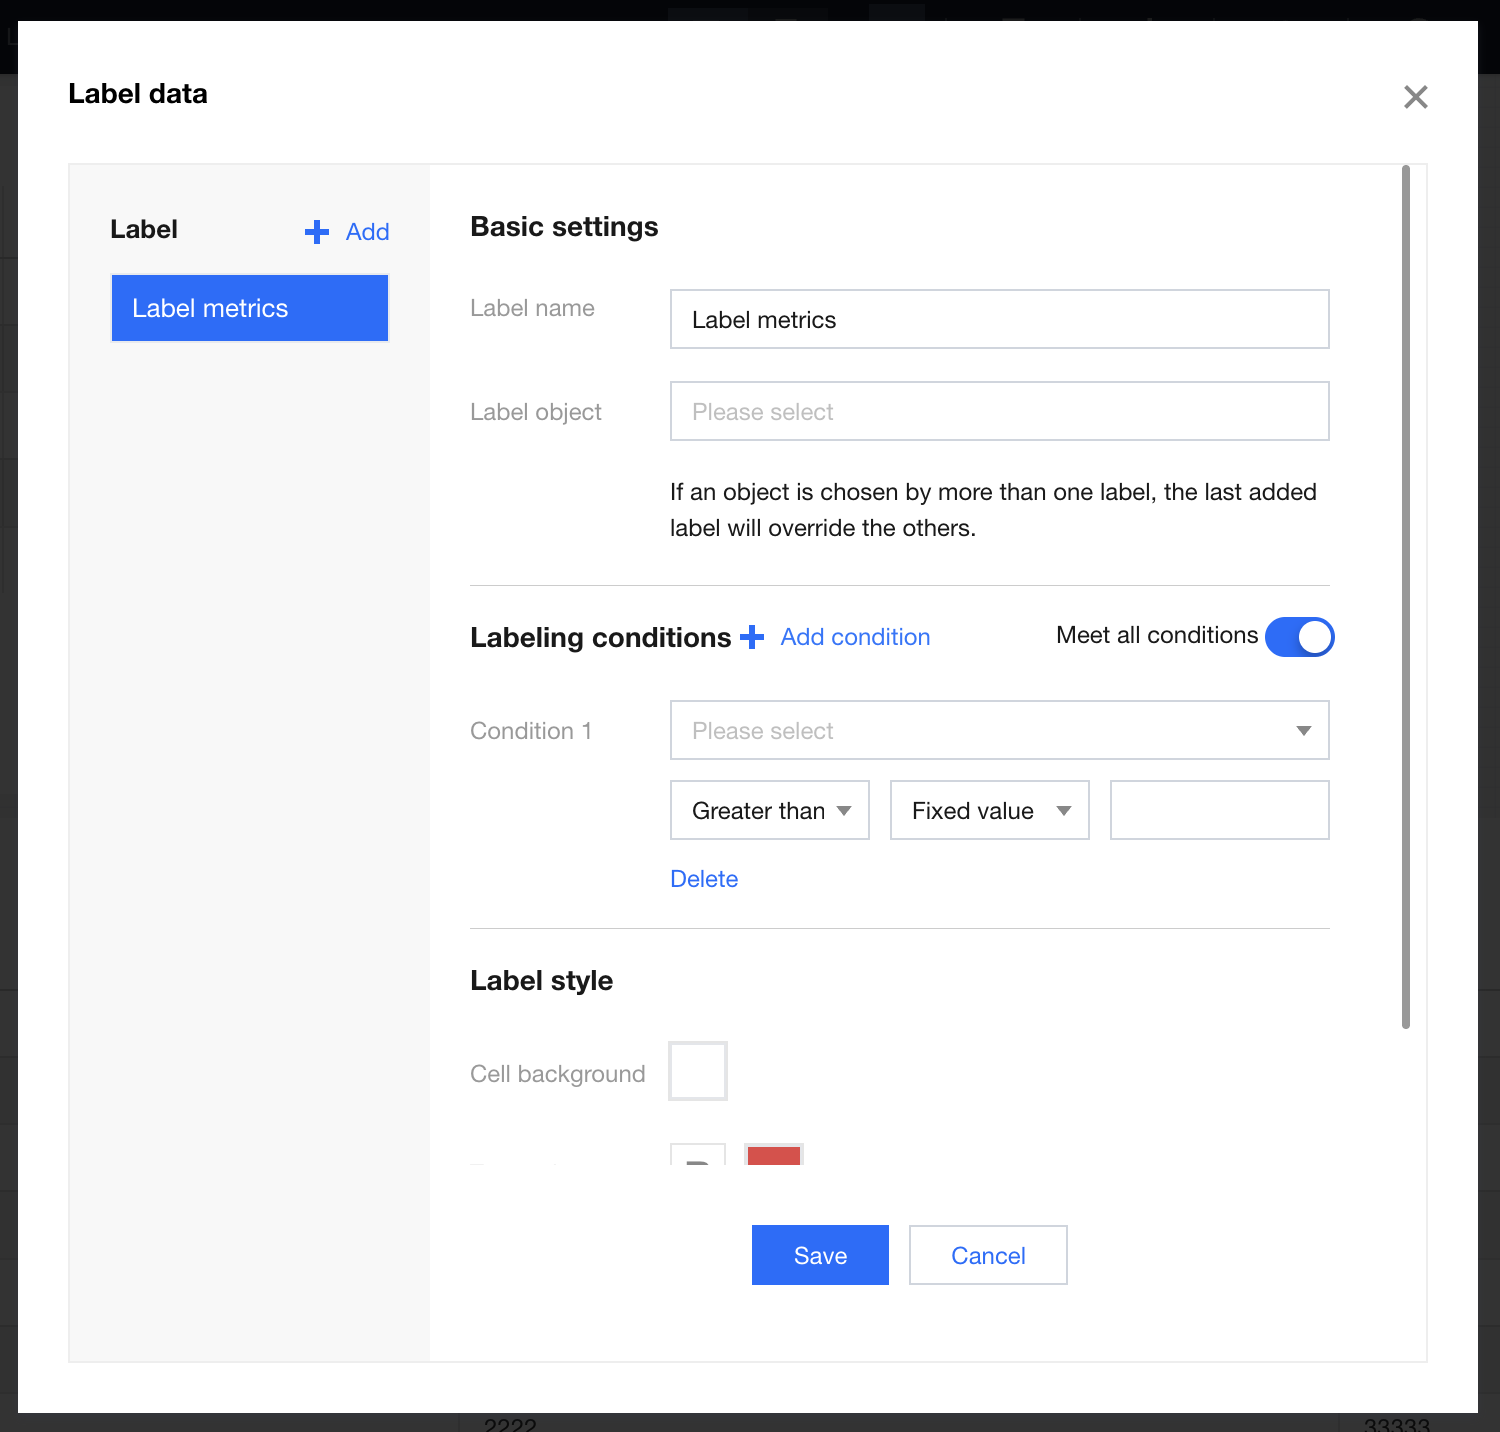
3. Setting Basic Information for Data Annotation
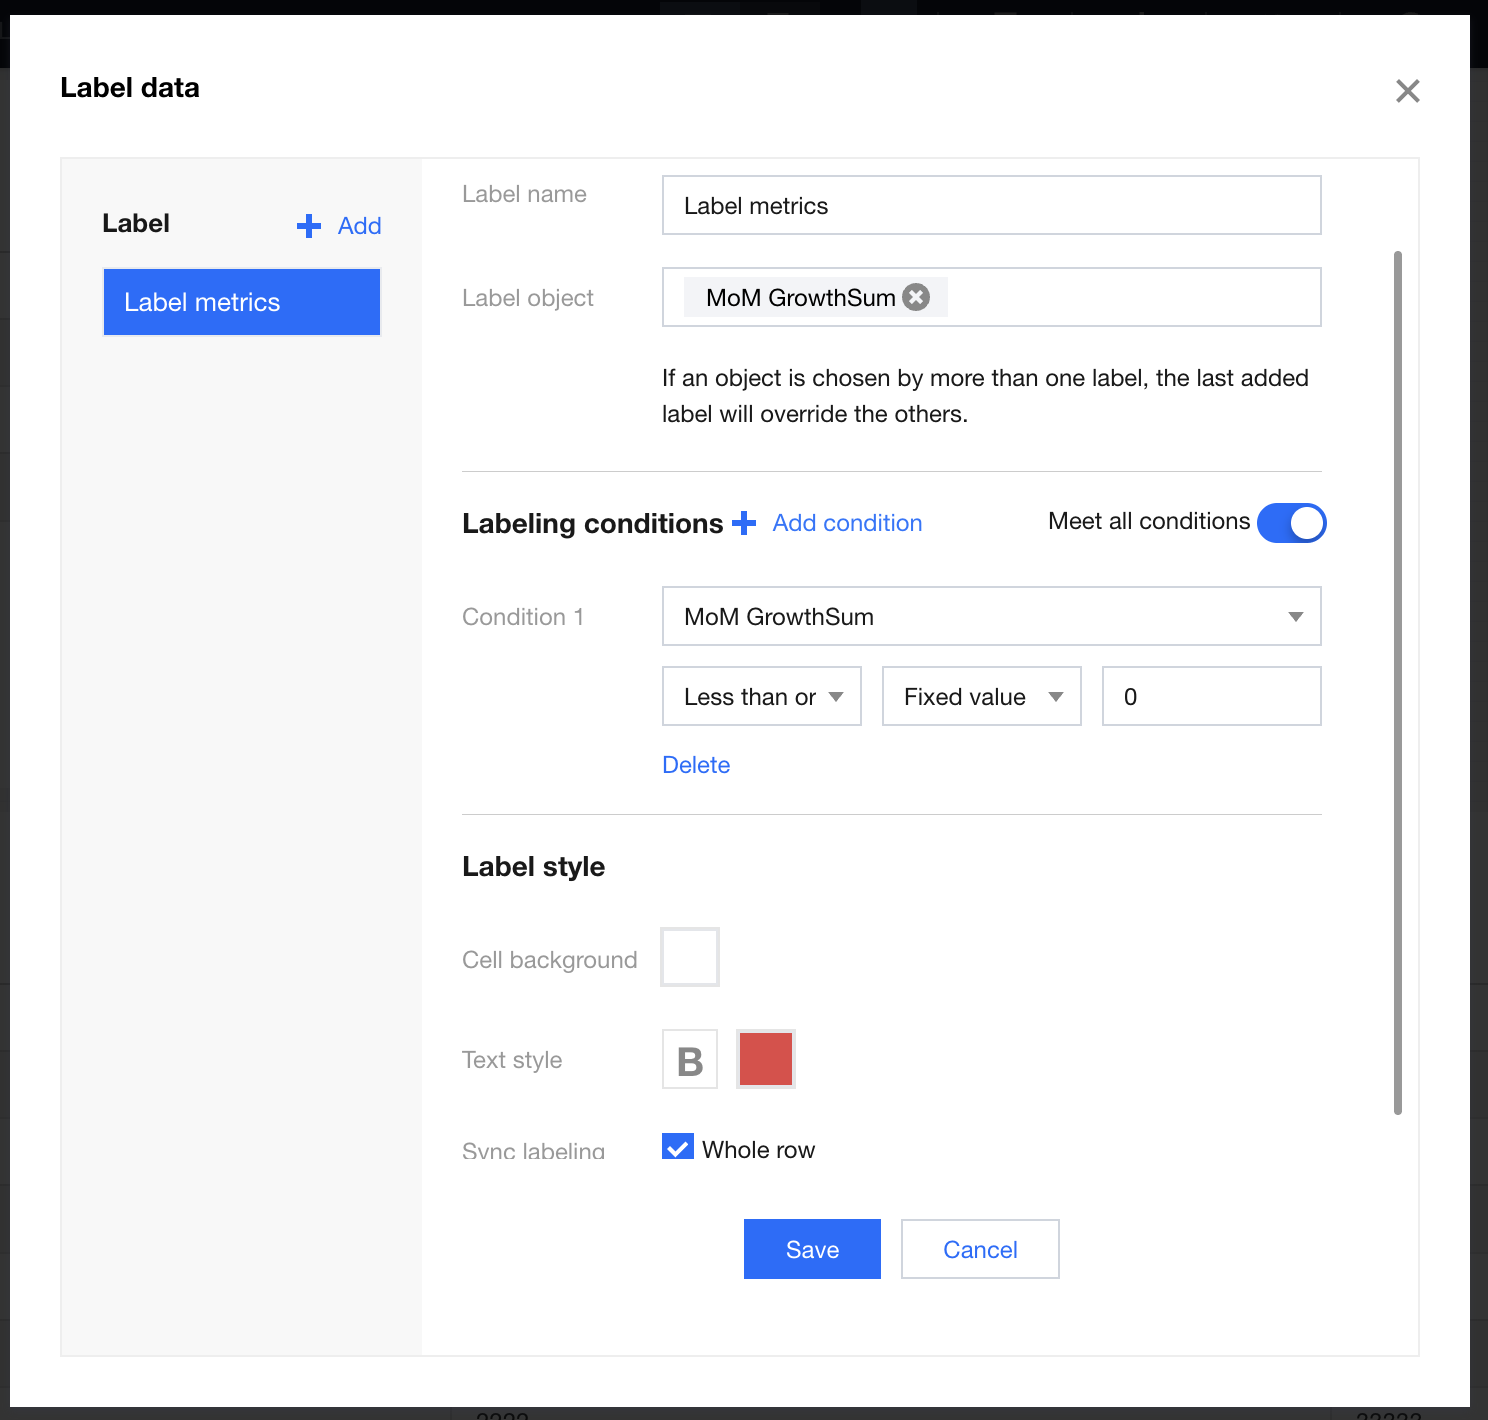
Configure the basic information for the annotation, including the annotation name and annotation object. The annotation object specifies the elements that will be displayed with special styles once the annotation conditions are met. We recommend that you select the corresponding metric fields of the conditions, but you can also select other fields.
4. Setting Data Annotation Conditions
Select the "Month-over-month" metric.
Set the computing logic to "less than or equal to fixed value 0".
5. Setting Data Annotation styles
Set the text format to bold and red.
Unselect the entire row option for "synchronous annotation" (Selecting this option will apply the above styles to the current row. Otherwise, the above styles only apply to a cell).
6. Final Effect
Annotation Description
When using the data annotation feature, pay attention to the following issues:
A component supports creating a maximum of 5 annotations.
After annotation settings, if the metric or dimension field changes, the annotation may become invalid.
When multiple annotations are applied to a field (cell), the latest created annotation has the highest priority. For example, consider 2 annotations that are simultaneously applied to the "Month-over-Month" field. The first annotation is defined as marking the "Month-over-Month" field in red when "Month-over-Month > 0", while the second annotation is defined as marking the "Month-over-Month" field in blue when "Month-over-Month > average". In this case, cells that meet both conditions will be marked in blue.