Model Monitoring
Download
Focus Mode
Font Size
Feature Overview
Model Monitoring provides a real-time model inference performance monitoring dashboard, helping you track core metrics such as request concurrency, Token throughput, and response latency for each model, enabling prompt identification of performance bottlenecks.
Category Filters
Category | Monitoring Content |
Language Models | Metrics for text generation models, such as RPM (Requests Per Minute), TTFT (Time To First Token), TPOT (Time Per Output Token), and other metrics. |
Filter Conditions
Filter Options | Description |
Filter Dimension | Supports filtering by service/model and switching to different aggregation views. |
Service Selection | Dropdown to select specific inference services (default displays All Services). |
Time Range | 1 hour/Today/Last 3 days/Last 7 days/Last 30 days, or Custom time range. |
Metric Details
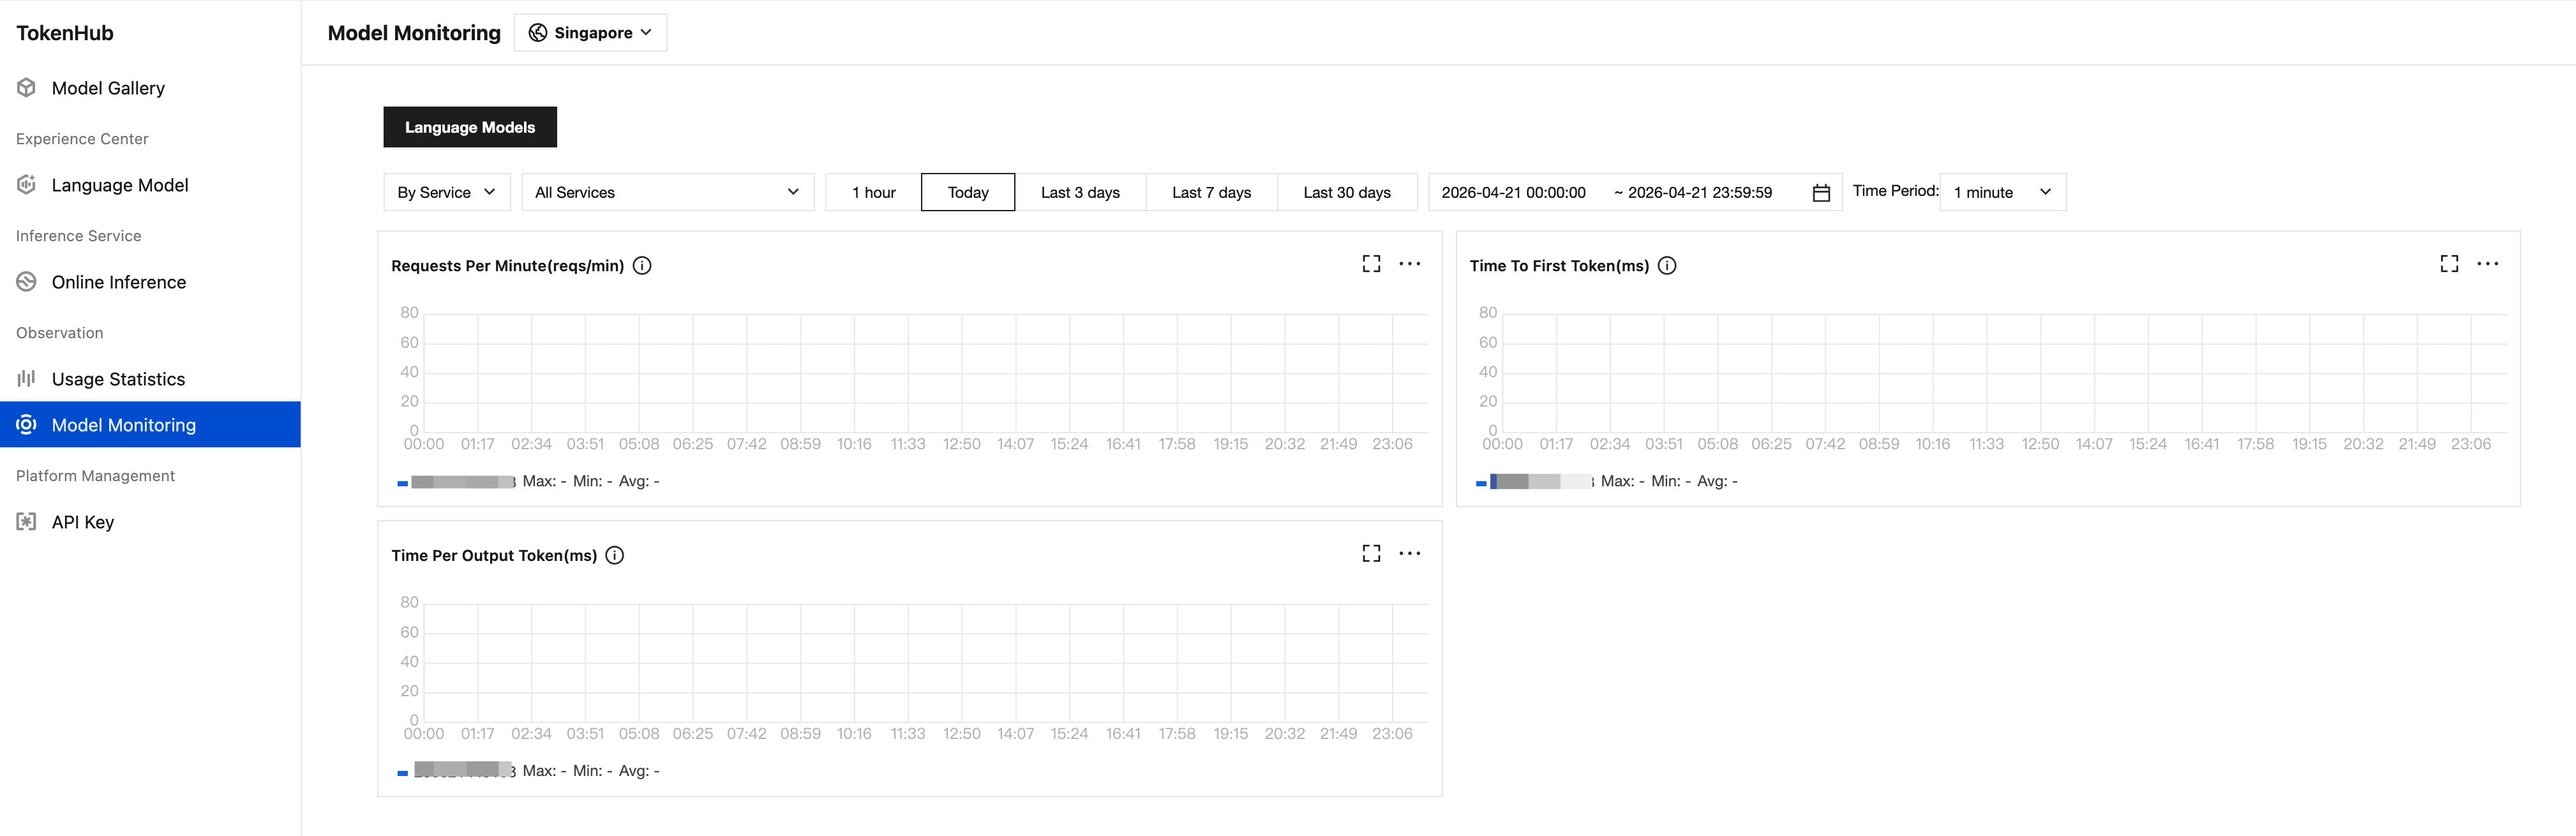
Text Generation
Displayed as time-series charts for three core performance metrics:
Metric | Full Name | Unit | Description |
Requests Per Minute (RPM) | Requests Per Minute | reqs/min | Number of requests per minute, reflecting request throughput. |
Time To First Token (TTFT) | Time To First Token | ms | The response time from sending the request to receiving the first Token. |
Time Per Output Token (TPOT) | Time Per Output Token | ms | Average time to generate each output token. |
Each metric provides maximum, minimum, average three statistical summaries to help users quickly locate performance abnormalities.
Example:
Help and Support
Was this page helpful?
You can also Contact sales or Submit a Ticket for help.
Help us improve! Rate your documentation experience in 5 mins.
Feedback