Dynamic Release Record (2026)
Adding a Rule under Monitoring Task
Preliminary Description
Type | Description |
Supported Data Source Type | Currently, WeData supports the following data source types: EMR:EMR-Hive,EMR-StarRocks,EMR-iceberg, DLC TCHouse-P TCHouse-X TCHouse-D Doris |
Ways to Add Monitoring Rules | Currently, WeData supports the following three methods: Create a monitoring task - Add Rule: Create a quality rule under monitoring. Add rules under a single table (a monitoring task can only monitor one table). Add multiple rules at once. Add Rules to Multiple Tables: Batch create monitoring rules for multiple fields of multiple tables in the same data source. Select multiple tables and fields at once. Select only one monitoring rule at a time. Batch upload: Upload an Excel template and import in batches. Only one type of data source can be targeted at a time. Supports only custom SQL (no support for built-in templates or custom templates). Only 100 entries can be uploaded at a time. |
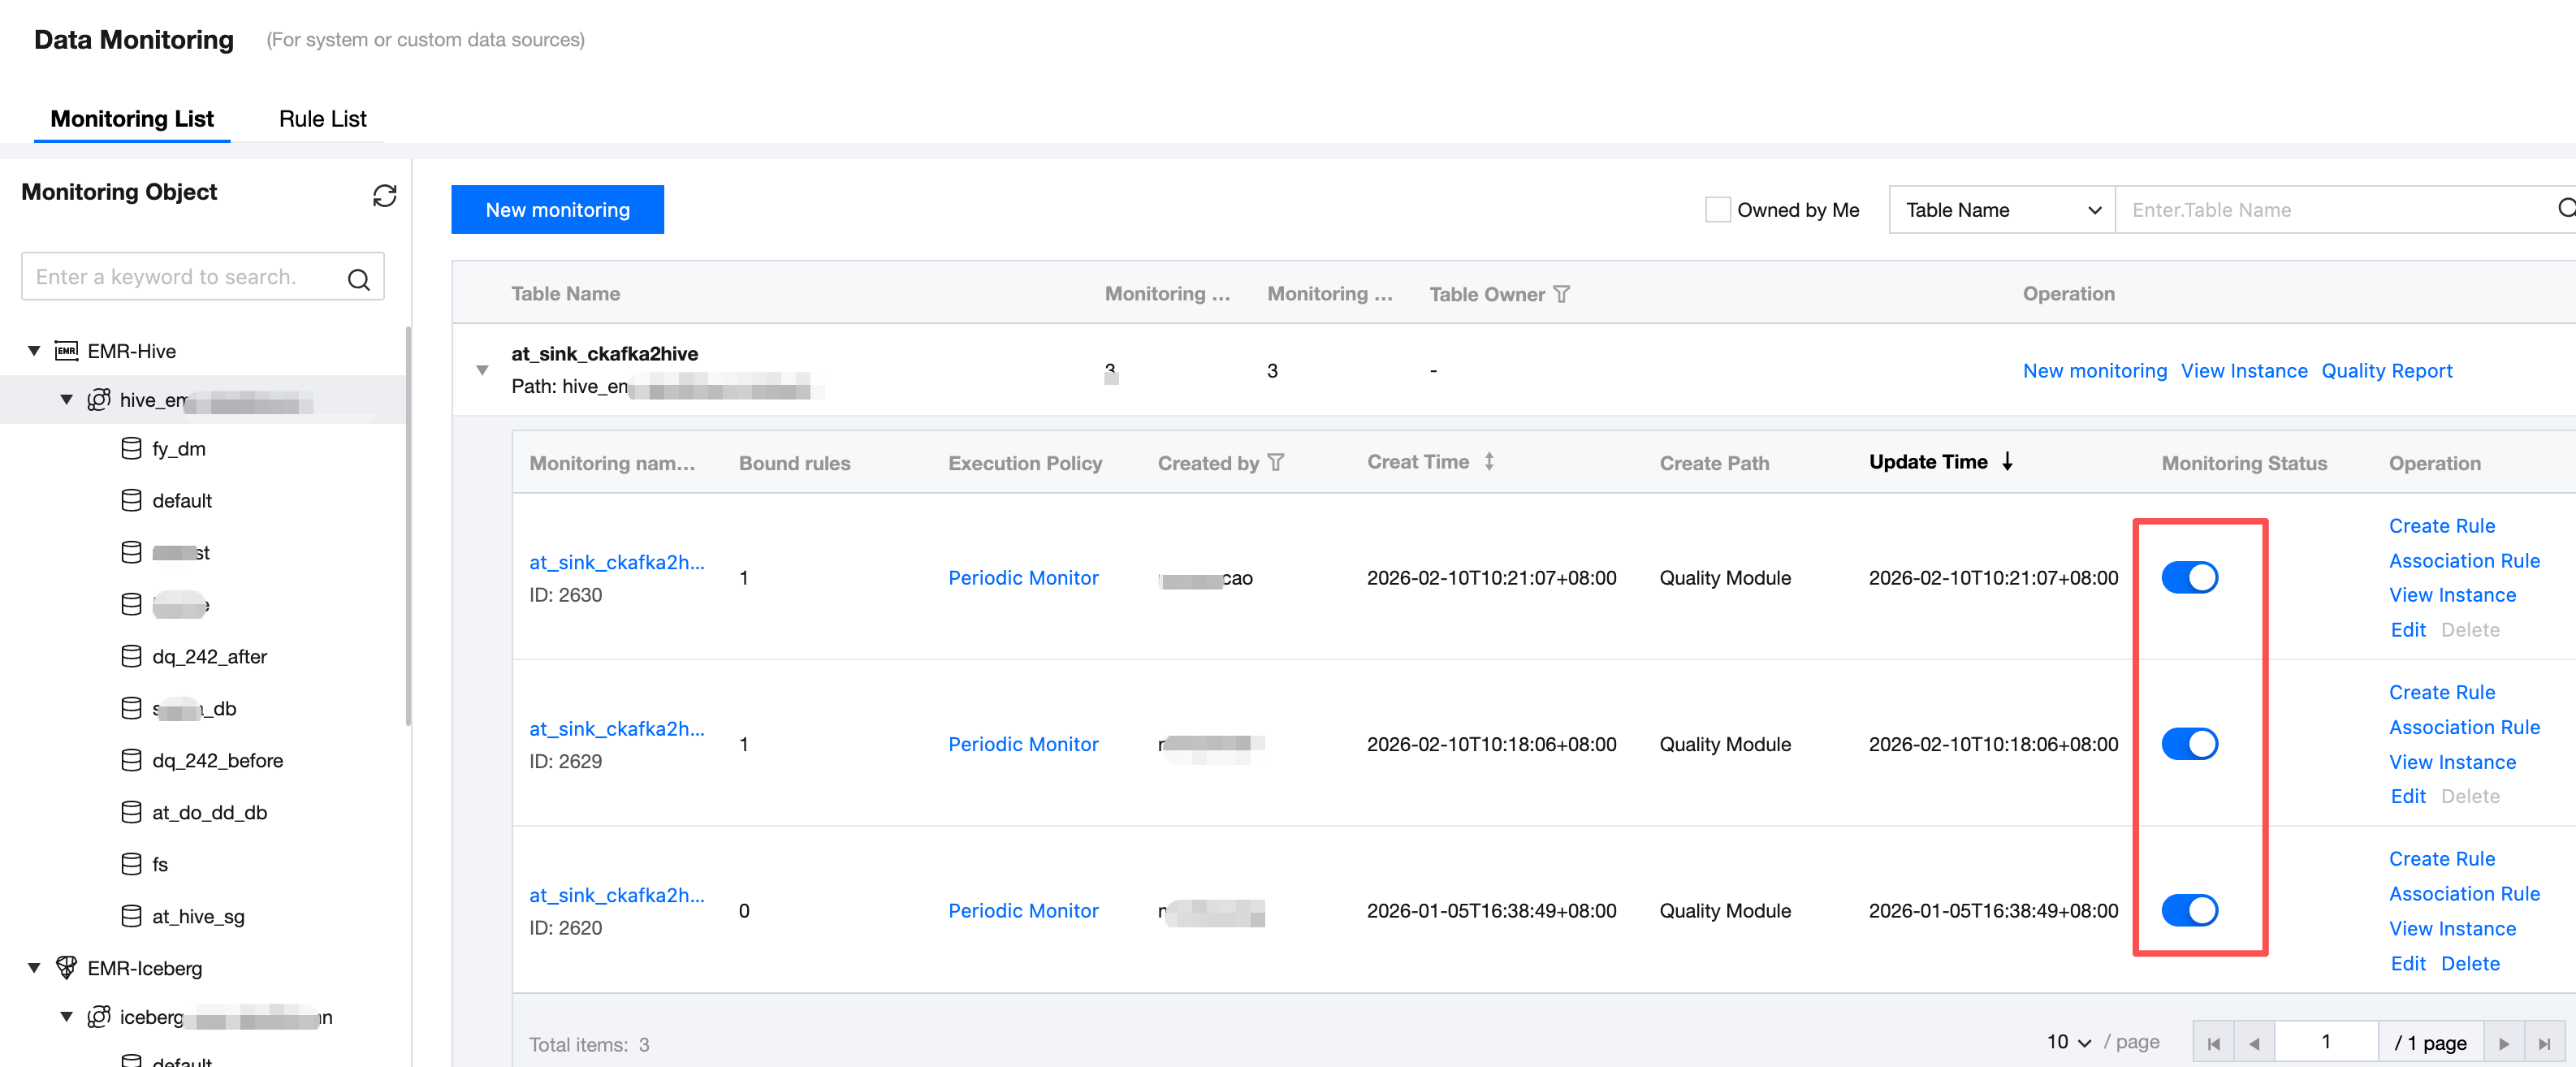
Creating a Quality Monitoring Task
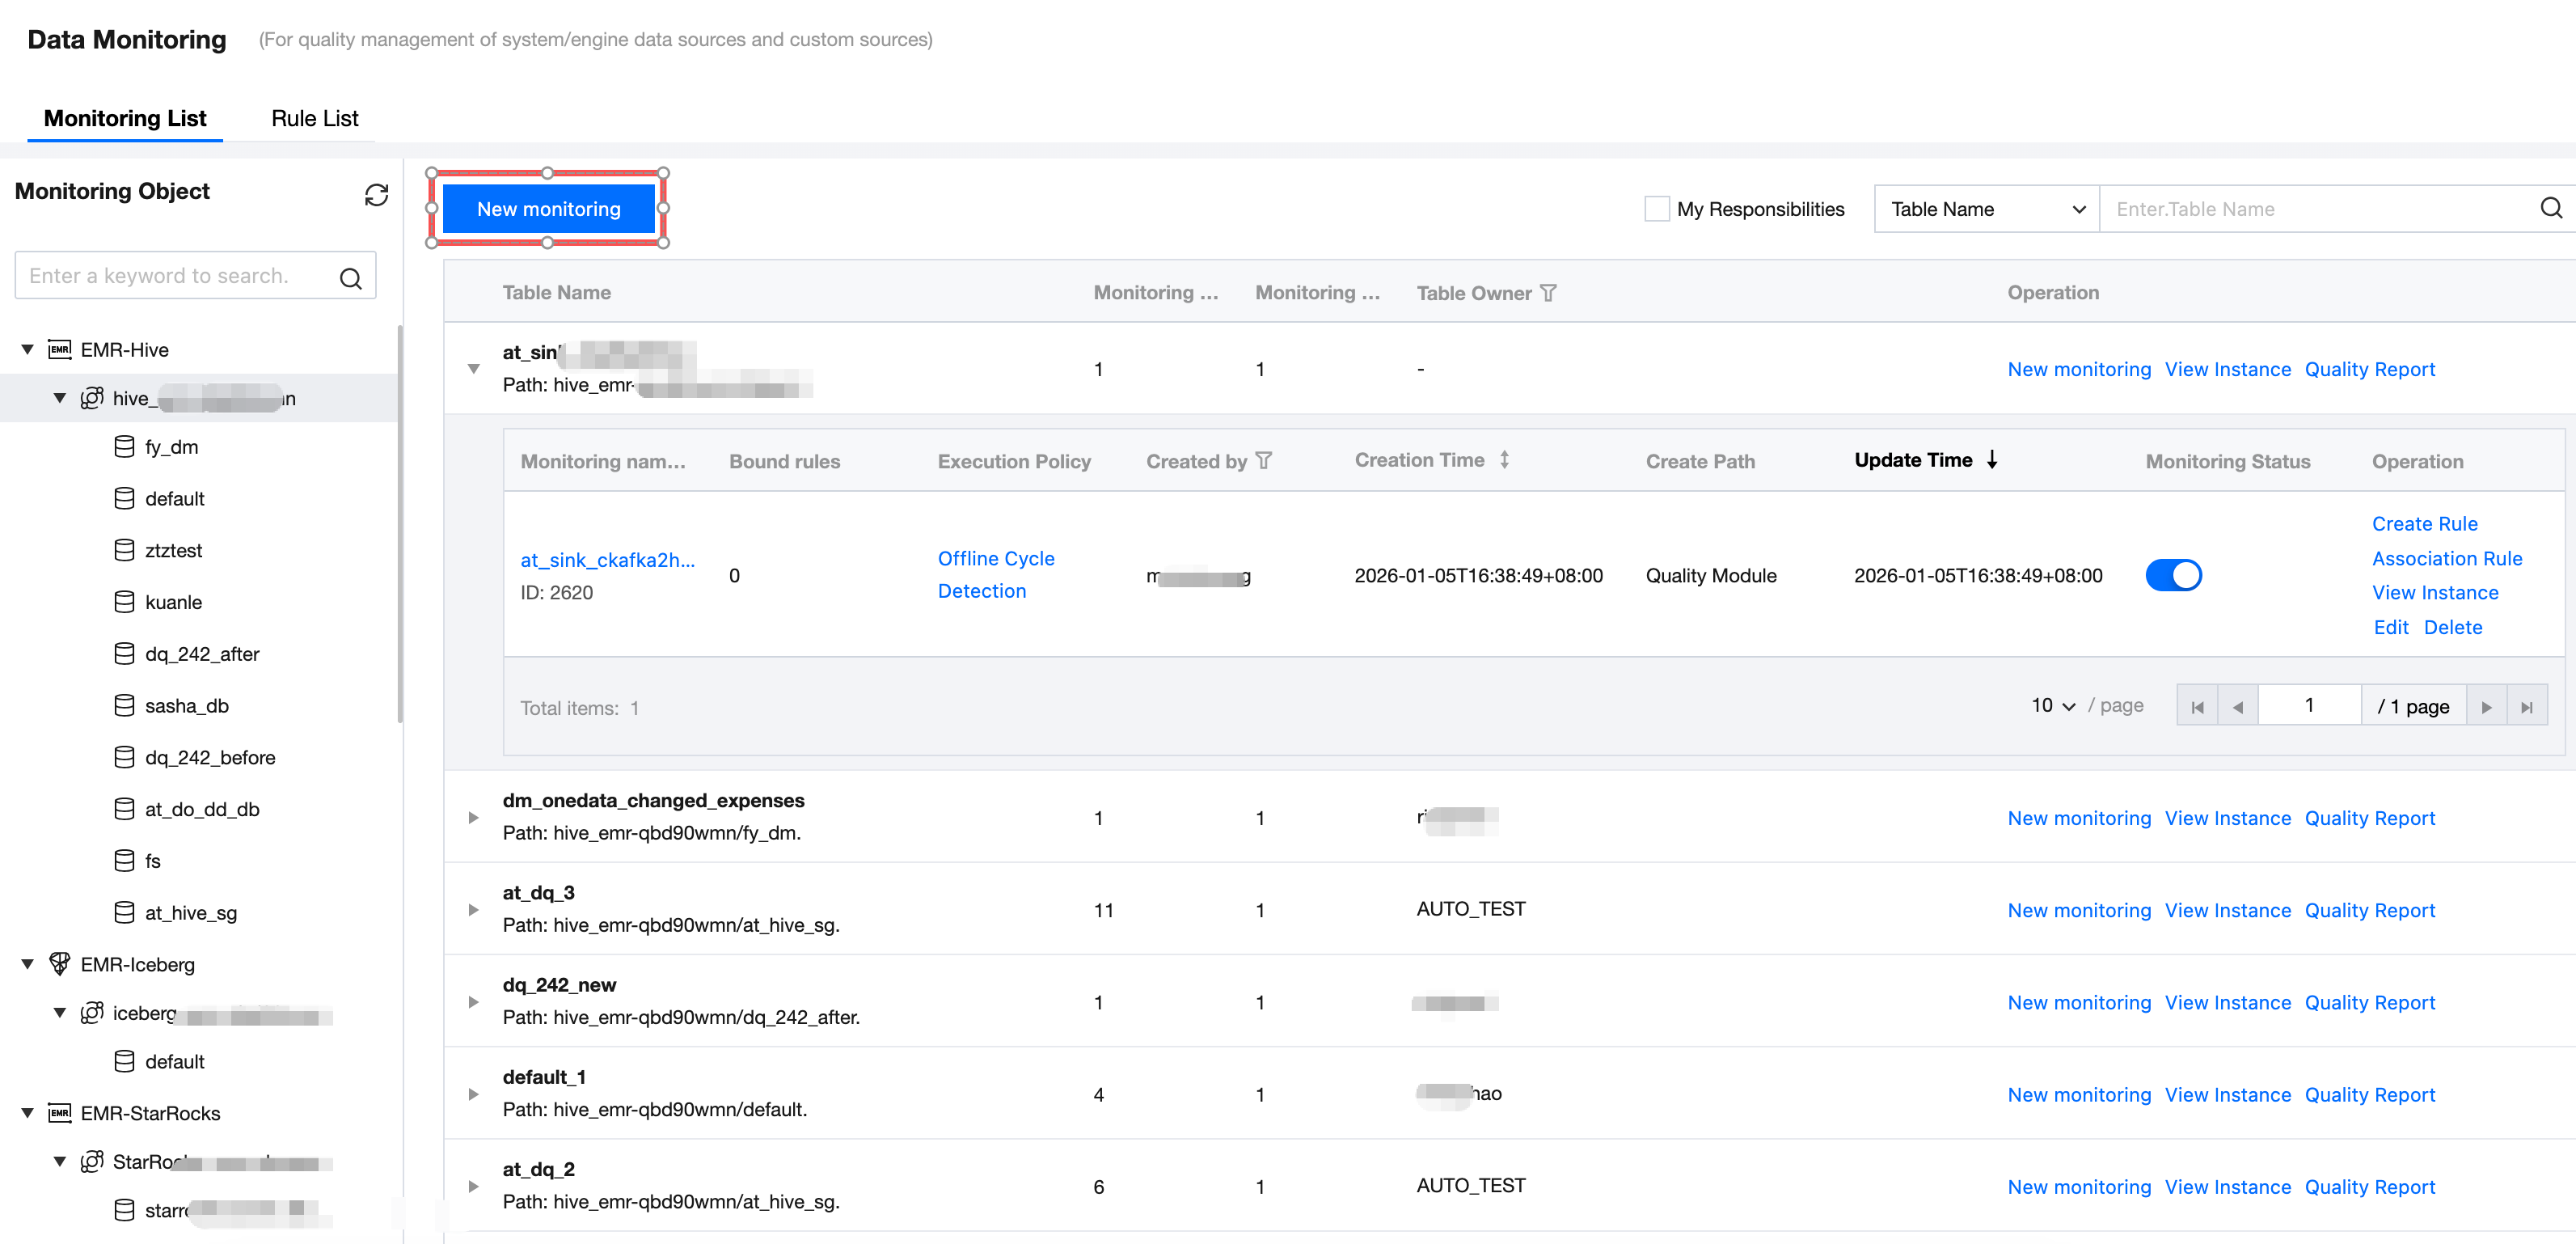
Enter the Governance Center > Data Monitoring > EMR interface, click Add New Monitoring, and start creating a quality monitoring.
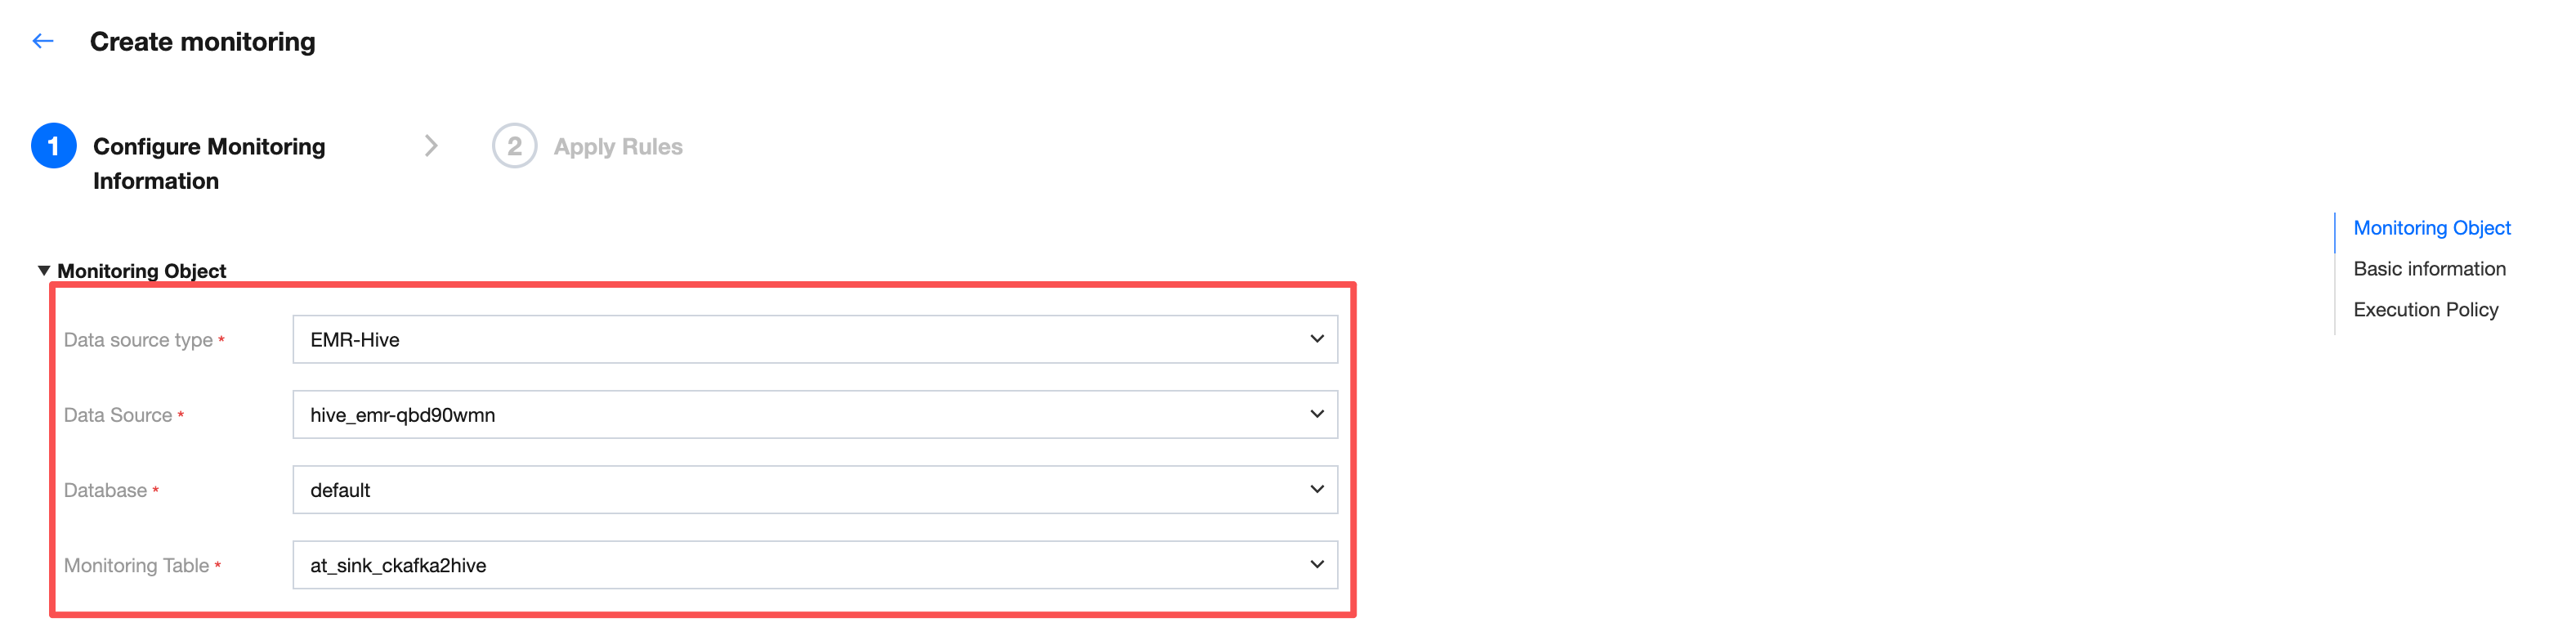
Step 1: Configure Monitoring Info
Monitoring Object
Enter the Create Monitoring interface, sequentially select the data source type, data source, database, and monitoring table for the monitoring object.
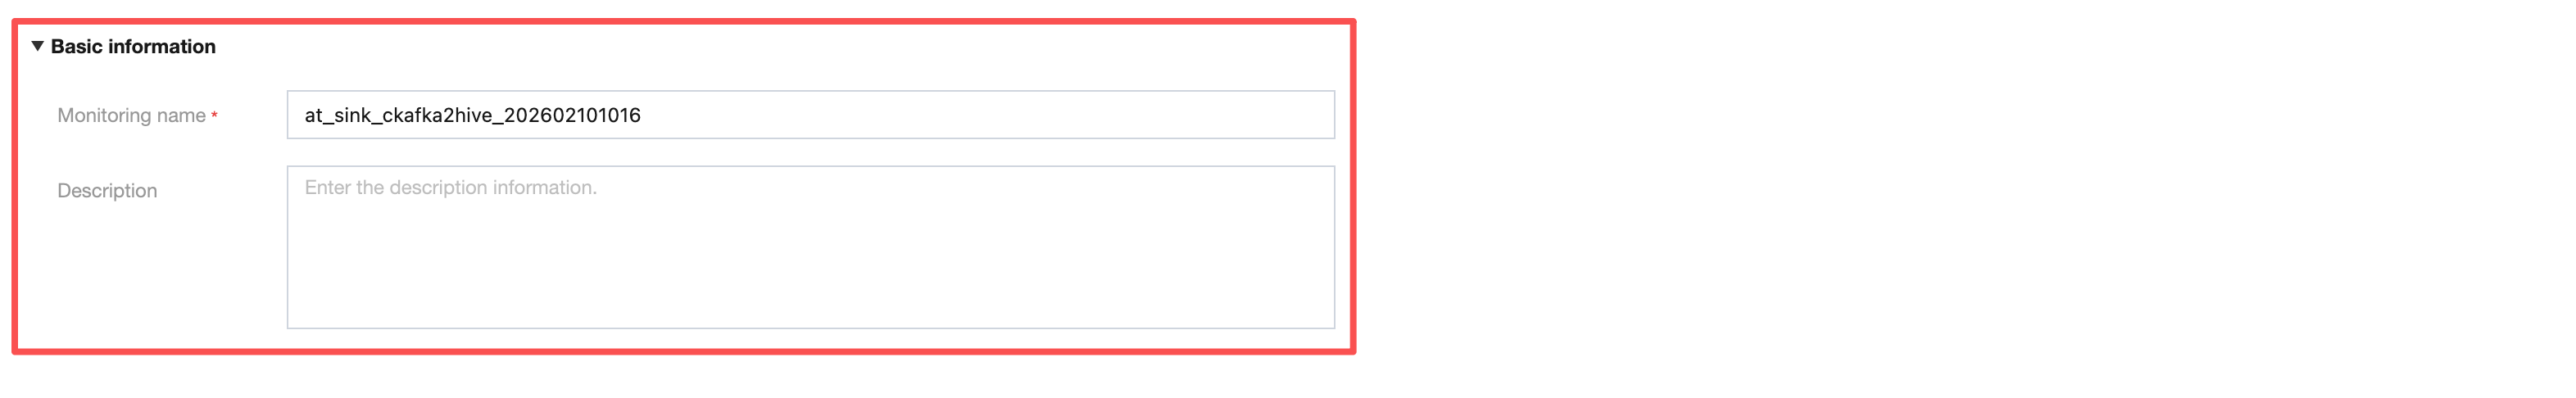
Basic Information
Fill in the monitoring name. The default monitoring name is monitoring table name_create monitoring timestamp.
Note:
It is advisable to fill in an easy-to-identify monitoring name for better understanding of the business significance of detection results in monitoring task instances.
For example, when the monitoring name is "North China sales table routine monthly detection", Ops management will show whether "North China sales table routine monthly detection" succeeded or failed each time it runs.
Meanwhile, for convenience, you can also join the business description.
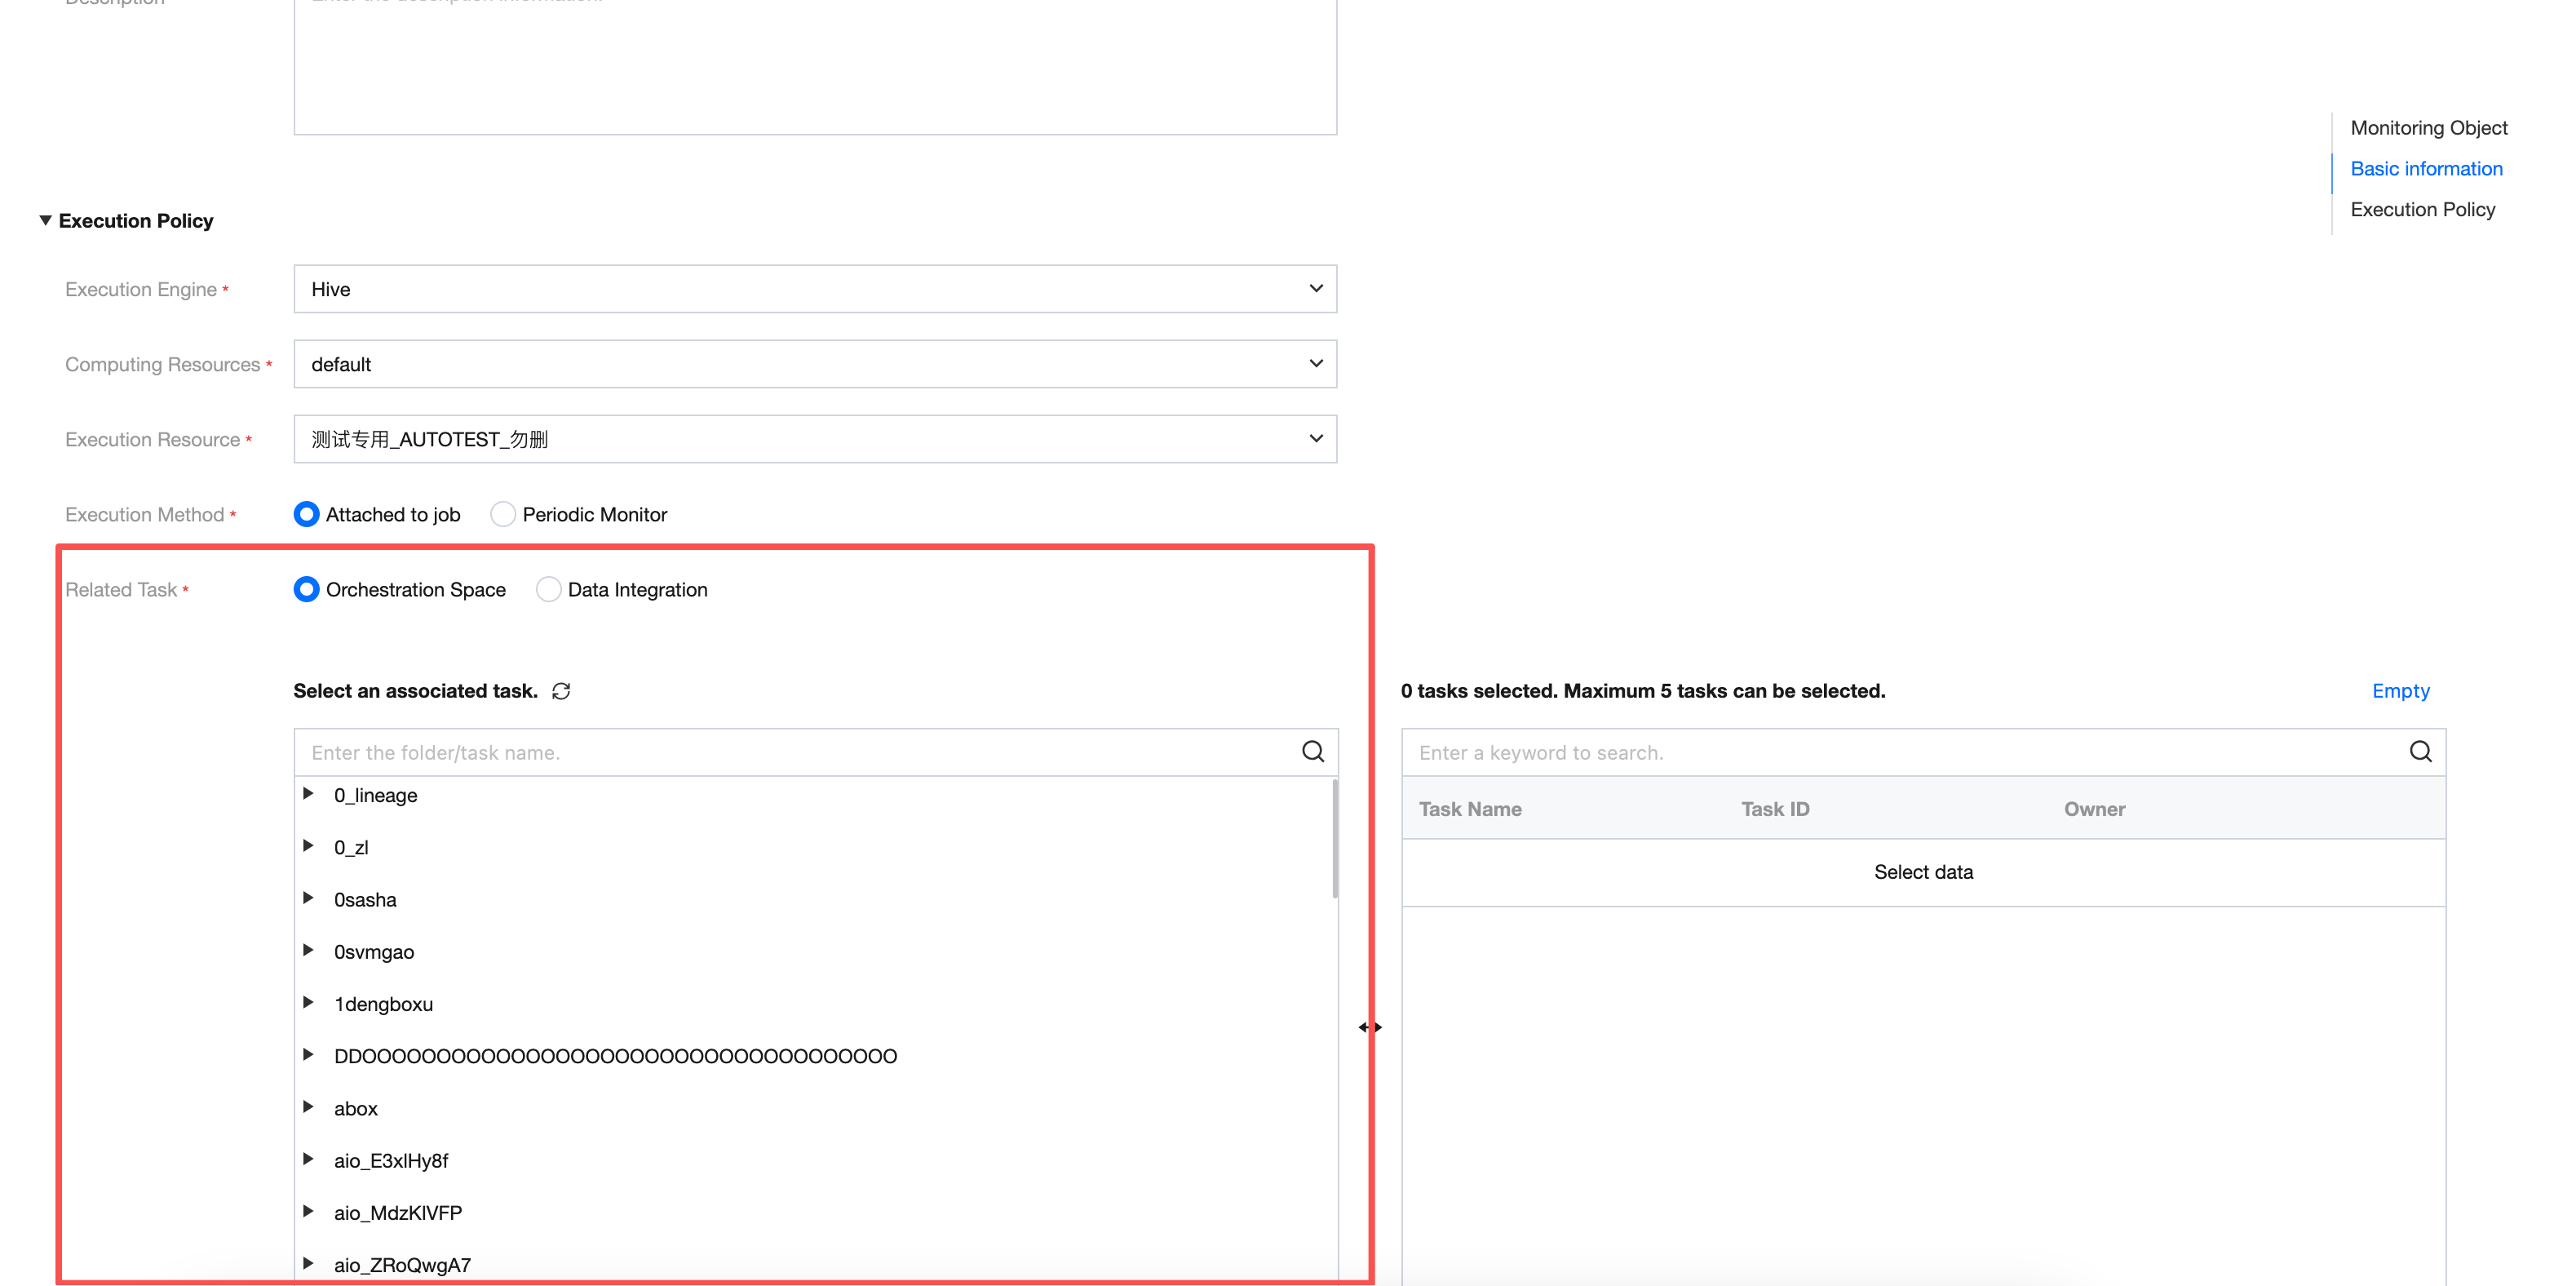
Execution Policy
Element | Description |
Execution Engine | Here you can select Hive and Spark, related to the purchased EMR resource. Generally, Hive tables can directly select Hive engine. |
Computing Resource | Select default Here you can select the resource group in the EMR cluster. Generally, you can directly select default. |
Execution resource | The execution resource here is the scheduling resource group already bound to the project. |
application parameter | Support setting application parameters for the Spark engine. For example: --executor-cores 2 --executor-memory 4G --num-executors 10 --driver-cores 1 --driver-memory 1G --conf spark_task_maxFailures=3 Note: 1. If [Project Management - Storage and Computing Engine Configuration - EMR - Queue Information] selects project configuration first, the --queue parameter input in the application parameter will not take effect, and the task uses the resource queue selected in the task configuration. 2. This feature is not supported in the Guangzhou region temporarily. |
Execution Method | Here you can select Associated Production Scheduling and Offline Cycle Detection: Associated Production Scheduling: Associate the quality task with production tasks (data sync tasks or data development tasks). When the production task execution is complete, insert a quality monitoring task. If an exception is detected, the handler will be notified immediately for processing, and downstream task execution will be blocked based on the rule level in monitoring to avoid problem data expansion. Note: The same quality inspection task can associate multiple production tasks; the same production task can also associate multiple quality inspection tasks. Offline Cycle Detection: Independent scheduling. Set periodic quality inspection for selected database tables and core business fields with self-defined frequency such as daily, hourly, or per minute. The quality task will execute on schedule based on the set period. If an anomaly is detected, subscribers will be notified immediately. |
Associated Task | Here you can select the module to which the production task must be associated, development space or Data Integration, and can only be associated with up to 5 tasks: Development space: Shows the directory tree structure in the development space and supports searching folders or task names. Data Integration: Shows the task list in data integration. |
Click Next to complete monitoring creation and enter the association rule interface.
Step Two: Association Rule
Association rules are displayed in one table, with no association to other monitoring tasks. Support edit or associate quality rules (Option).
Note:
Quality rules unassociated with monitoring will not execute.
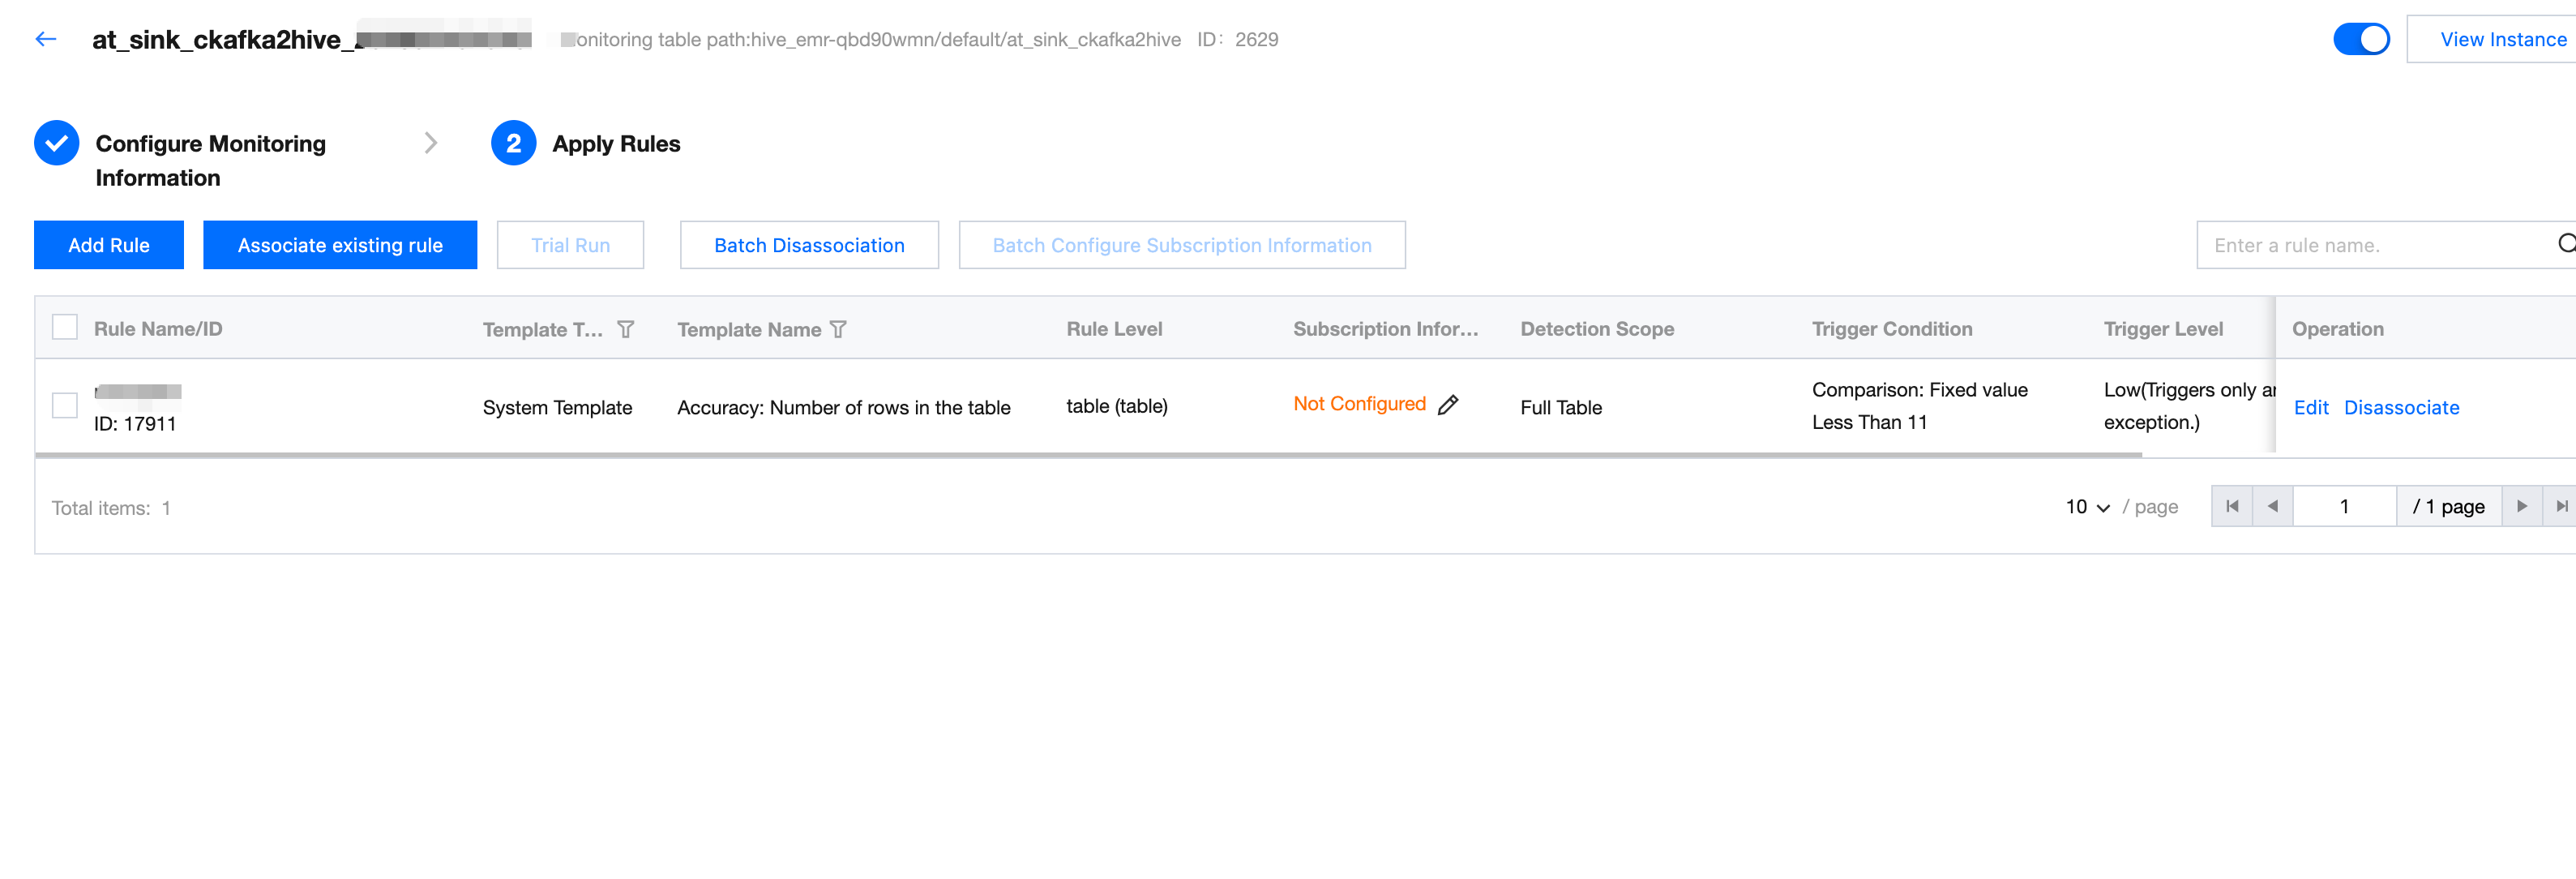
If existing rules cannot meet business needs, click Associate Existing Rules
Show all rules associated with this monitor. All quality rules associated earlier will be displayed here.
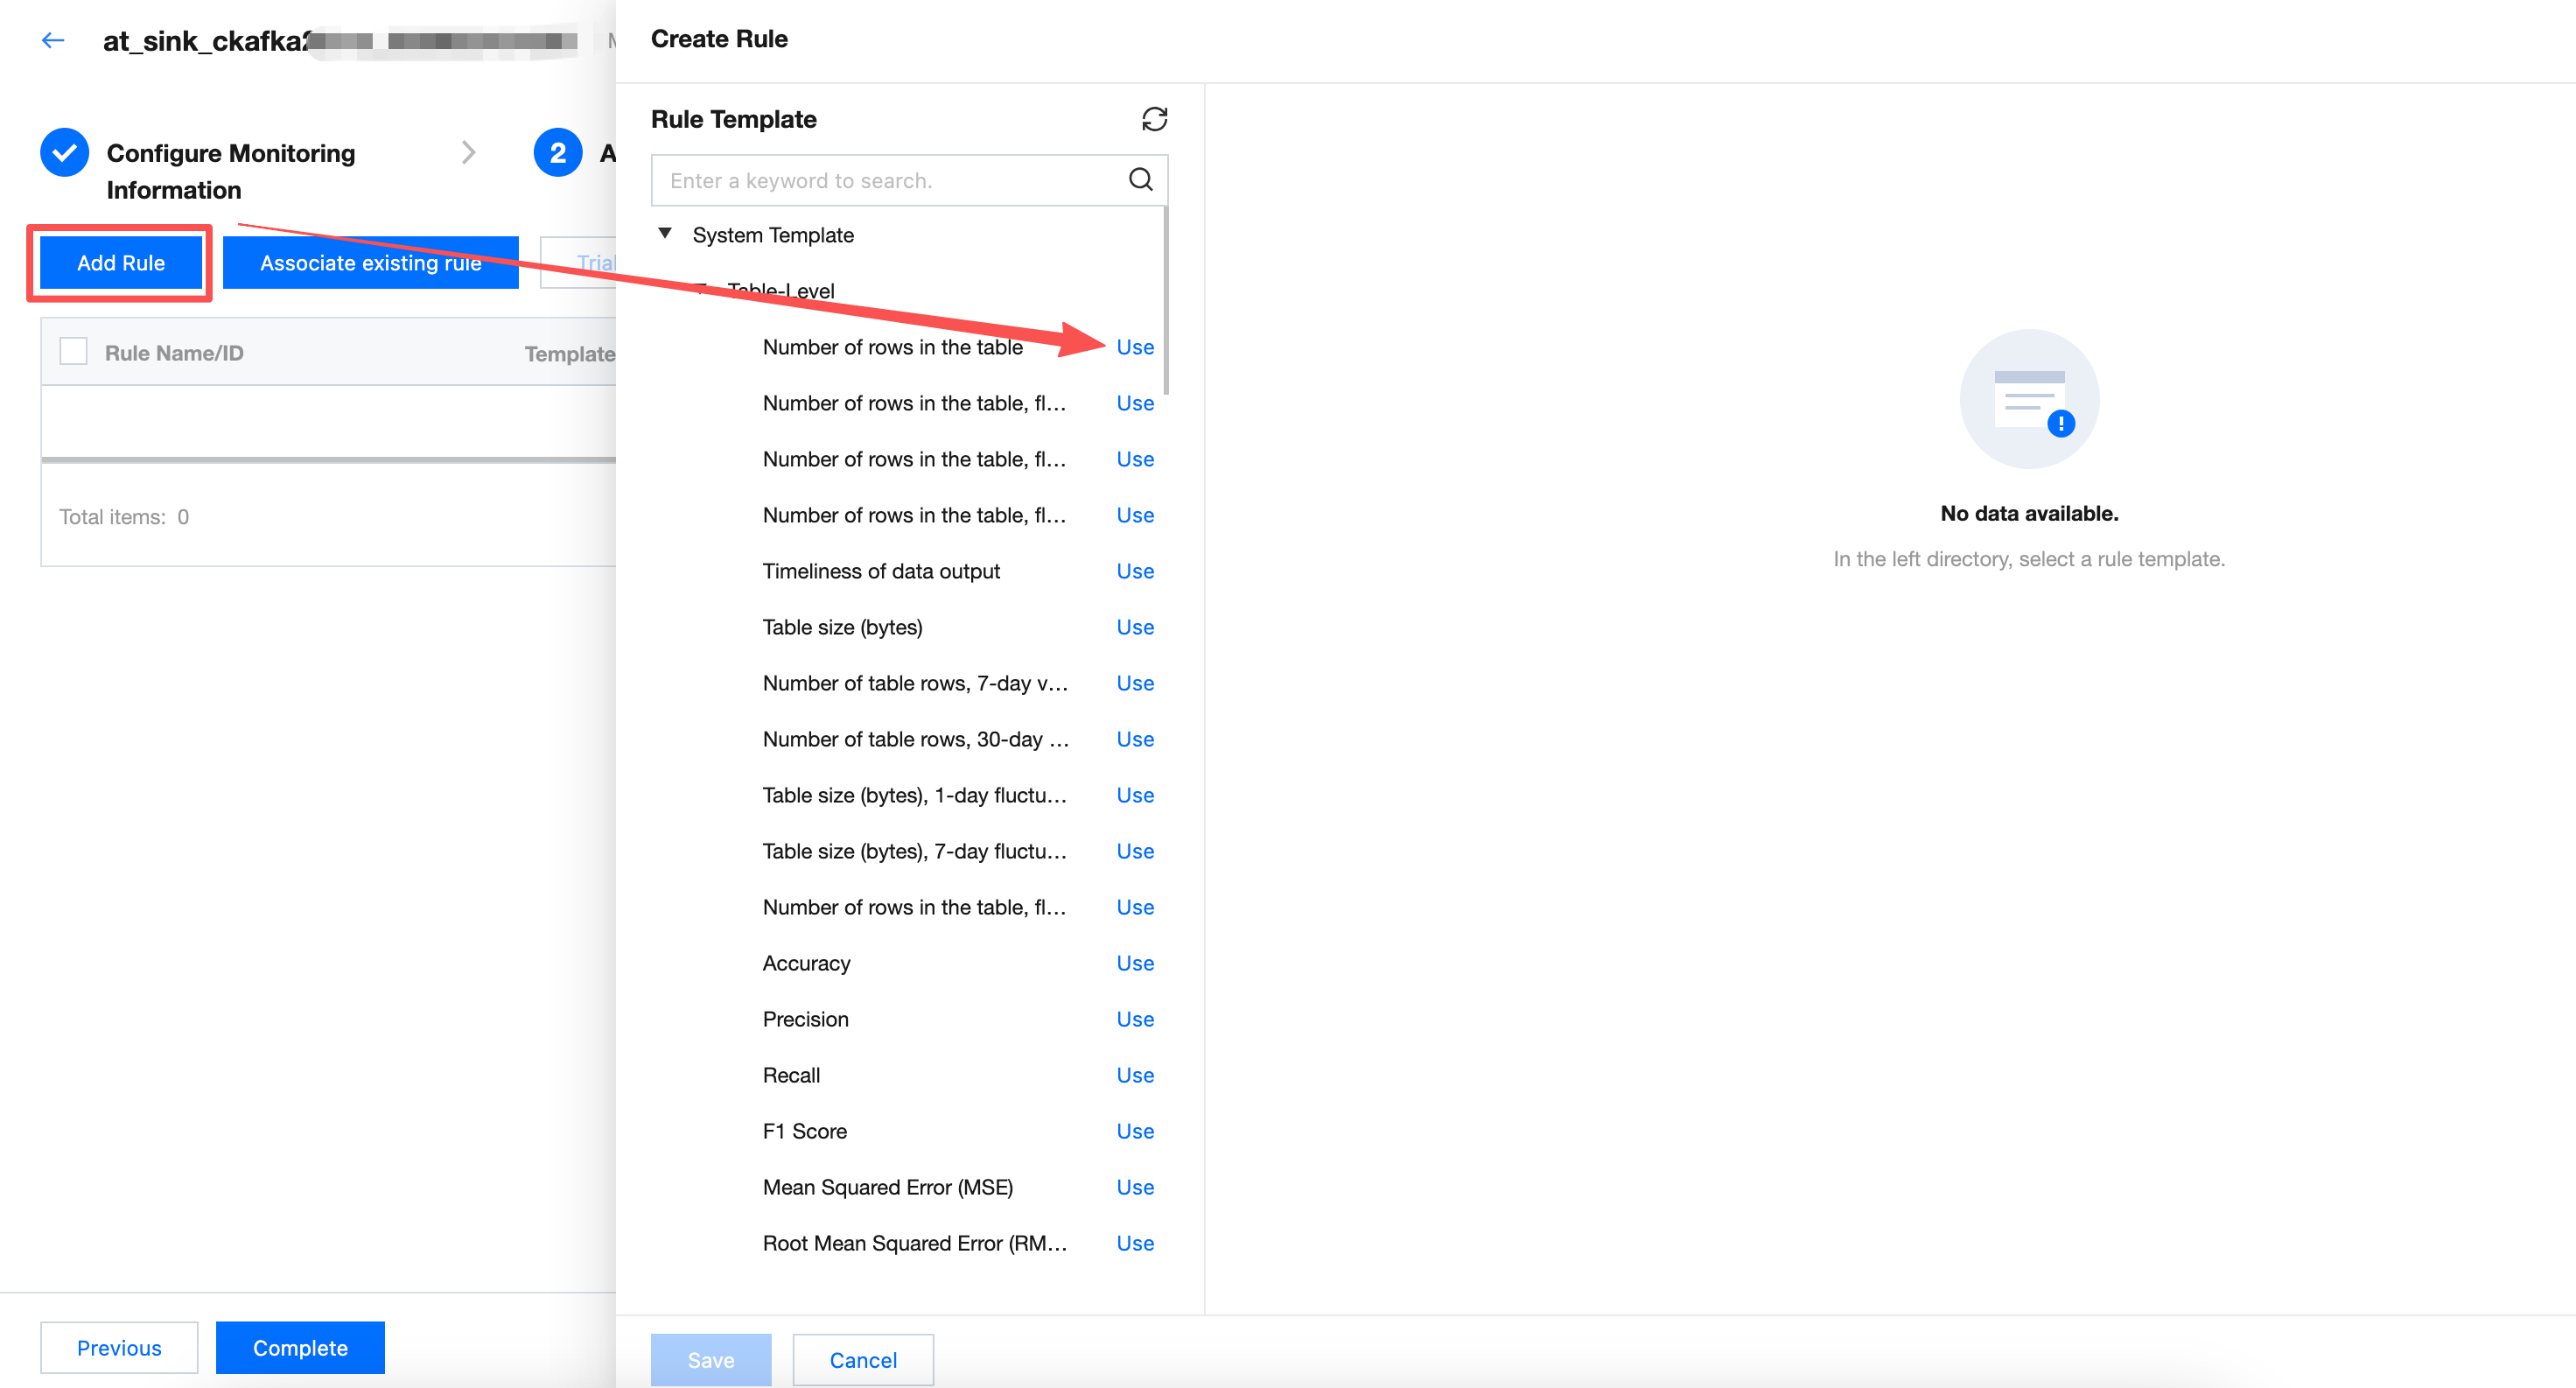
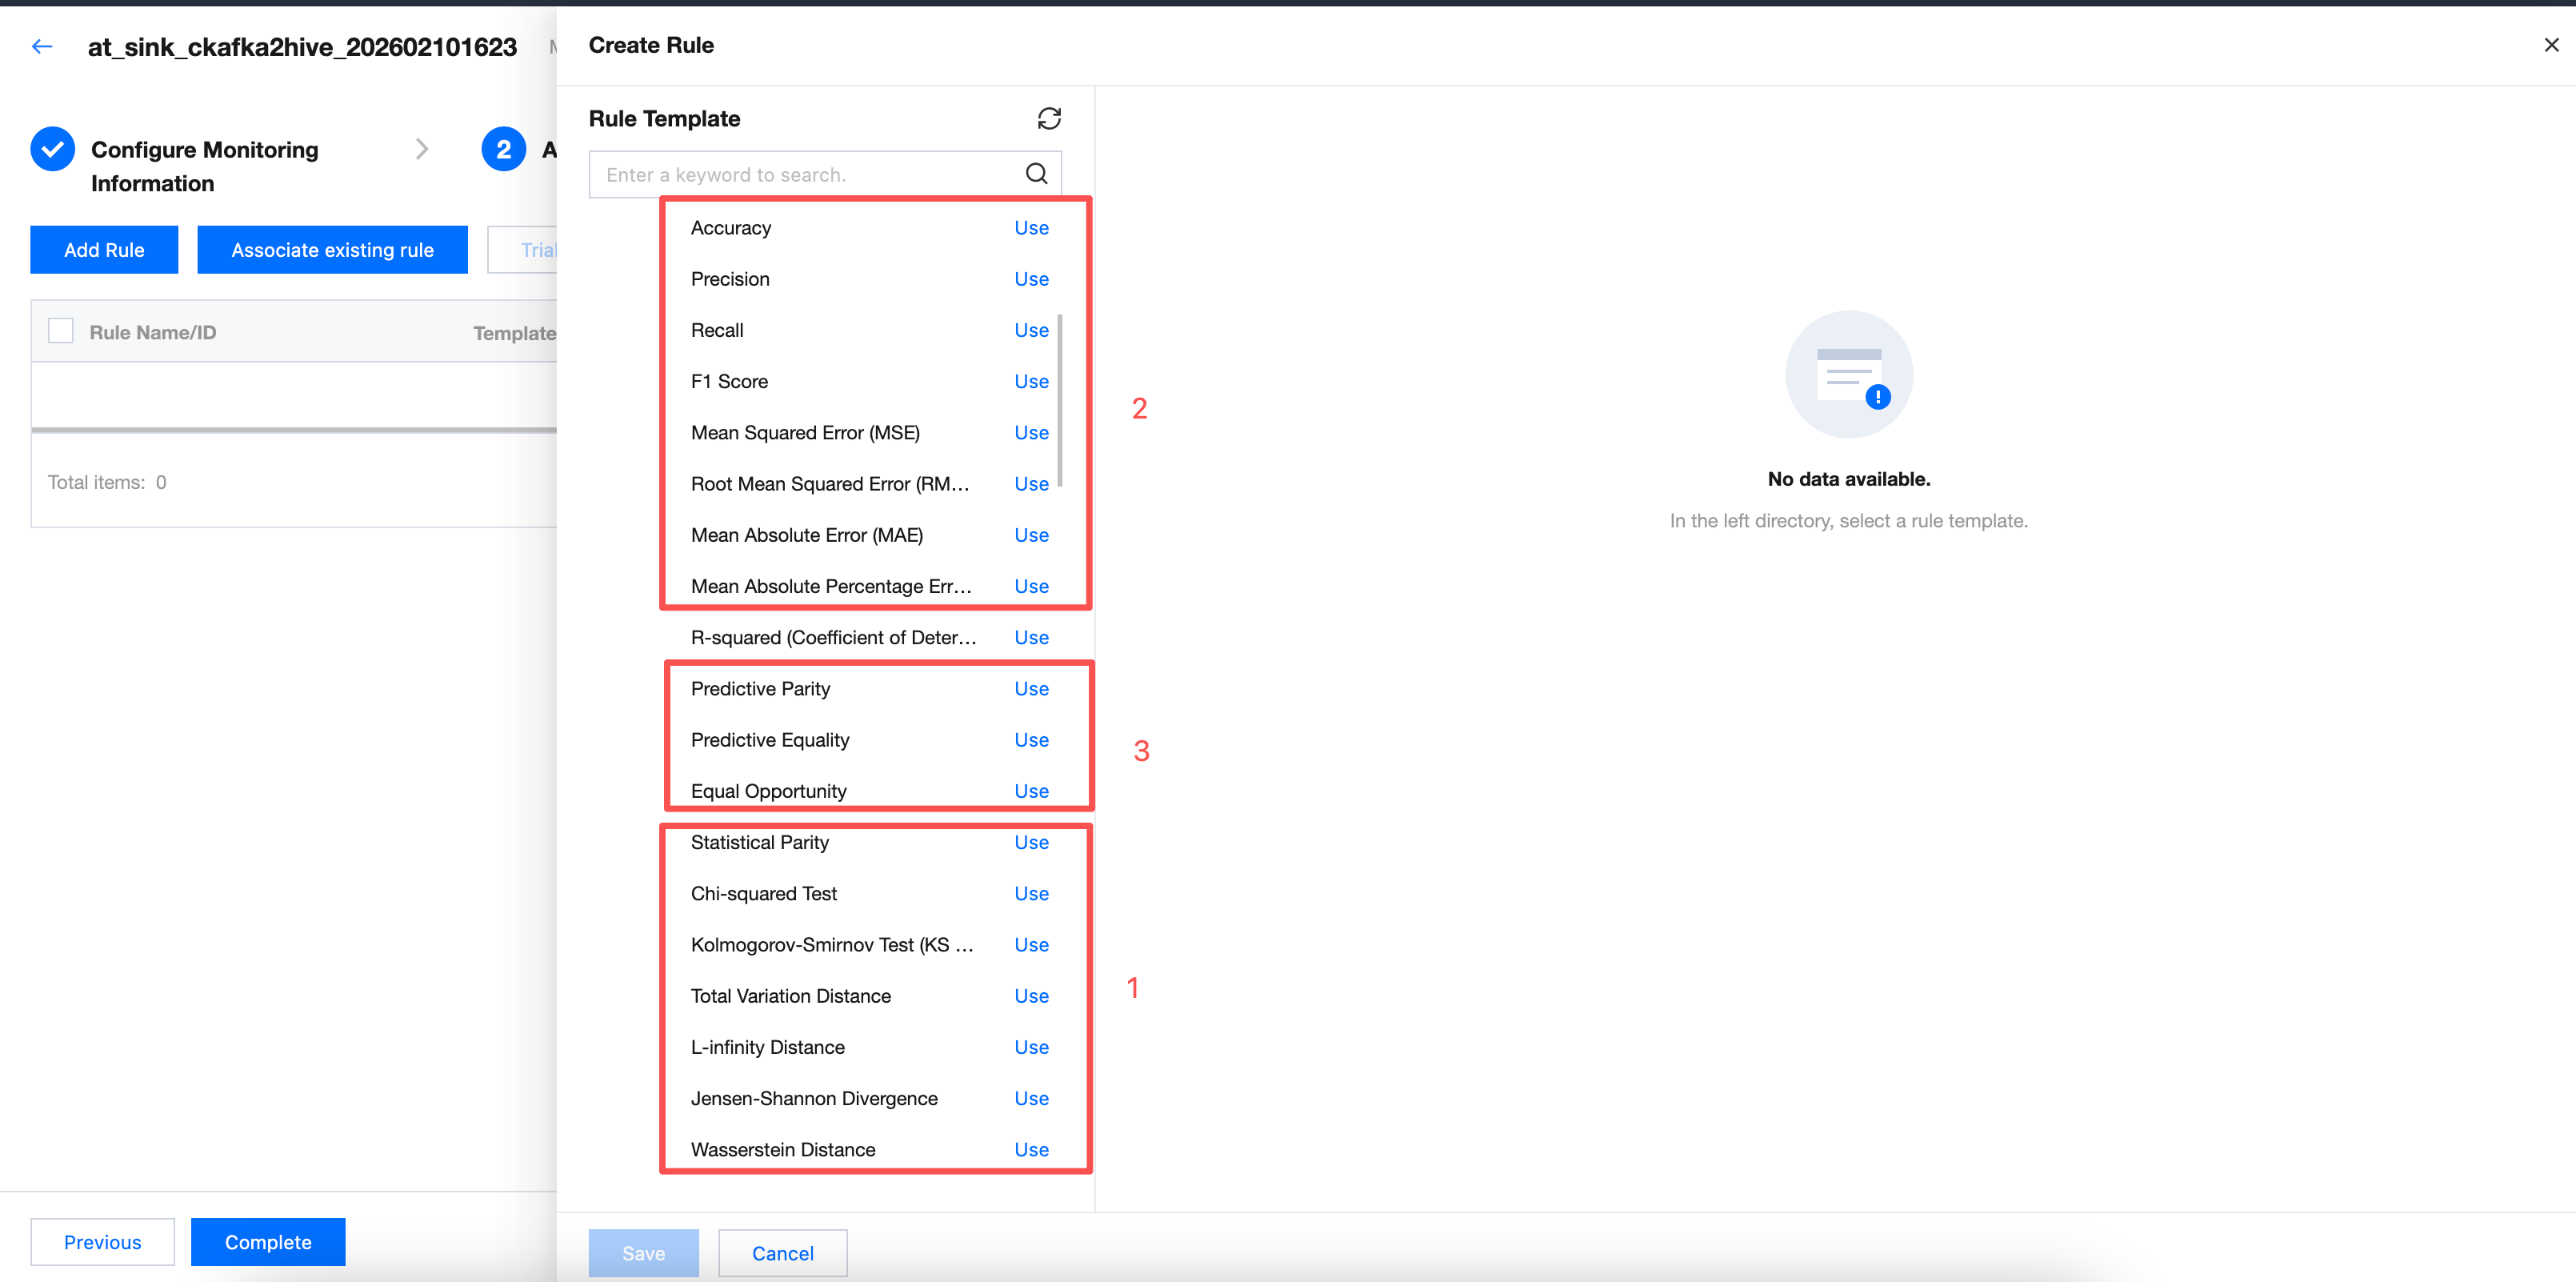
Creating New Rule
Click Create Rule on the rule list to pop up the create rule popup, supporting selection to perform quality validation.
Support adding multiple rules at once. The newly added rules will be directly associated with the monitor.
Note:
Element | Note: |
Rule Type | Select from system template, custom template, or Custom SQL (if you select a rule template from the Left Tree, the selected template parameter will be displayed here by default). System template: WeData has built-in 76 rule templates that can be used for free. 20 of them are applicable to reasoning tables. More details about each template can be found in system template description. Custom template: You can add rules applicable to your own business in the rule template menu for easy reuse. For detailed operation guidance, refer to custom template description. Custom SQL: Directly fill in SQL statement as detection rule. For detailed operation guidance, see add quality rules. |
Monitoring Object | Monitoring Object can be divided into table-level and field-level (if you select a rule template from the Left Tree, the selected template parameter will be displayed here by default). Table level: Monitor the number of rows and table size (only supported for Hive tables). Field level: Monitor whether the field is empty, whether to repeat, mean, maximum value, and minimum value. |
Select Template | WeData has built-in 56 rule templates that can be used for free. For more details on each template, see System Template Description. (if you select a rule template from the Left Tree, the selected template parameter will be displayed here by default). |
Detection Range | Choose full table or conditional scan. Full table: The quality rule will verify the full data in the table. Conditional scan: The quality rule will only verify the detection range filled here. For example:
Note: Here, fill in the partition field to avoid a full table scan every time a quality task runs, preventing wastage of computational resources. In SQL, ${yyyy-MM-dd-1d} is a date variable that represents one day before the execution date. It will be replaced with a specific date during Quality Task Execution. For example: When the quality task runs at 2024-05-02 00:00:00, ${yyyy-MM-dd-1d} will be replaced with 2024-05-01. |
Trigger Condition | Comparison operator: Select less than. Comparison value: Fill in 1. Number of table rows is less than 1, time variable filled in combination with the detection range, indicate: when no new data added yesterday, trigger alarm. Note: The trigger condition filled in here is abnormal value, i.e., the conditions for triggering alarms. |
Trigger Level | Select Medium. Trigger Level can be divided into: High, Medium, Low. High: When an alarm is triggered, immediately block downstream task execution (valid only when associated with production tasks). Medium: Trigger alarm only. Low: Do not trigger alarm, only abnormal result display. |
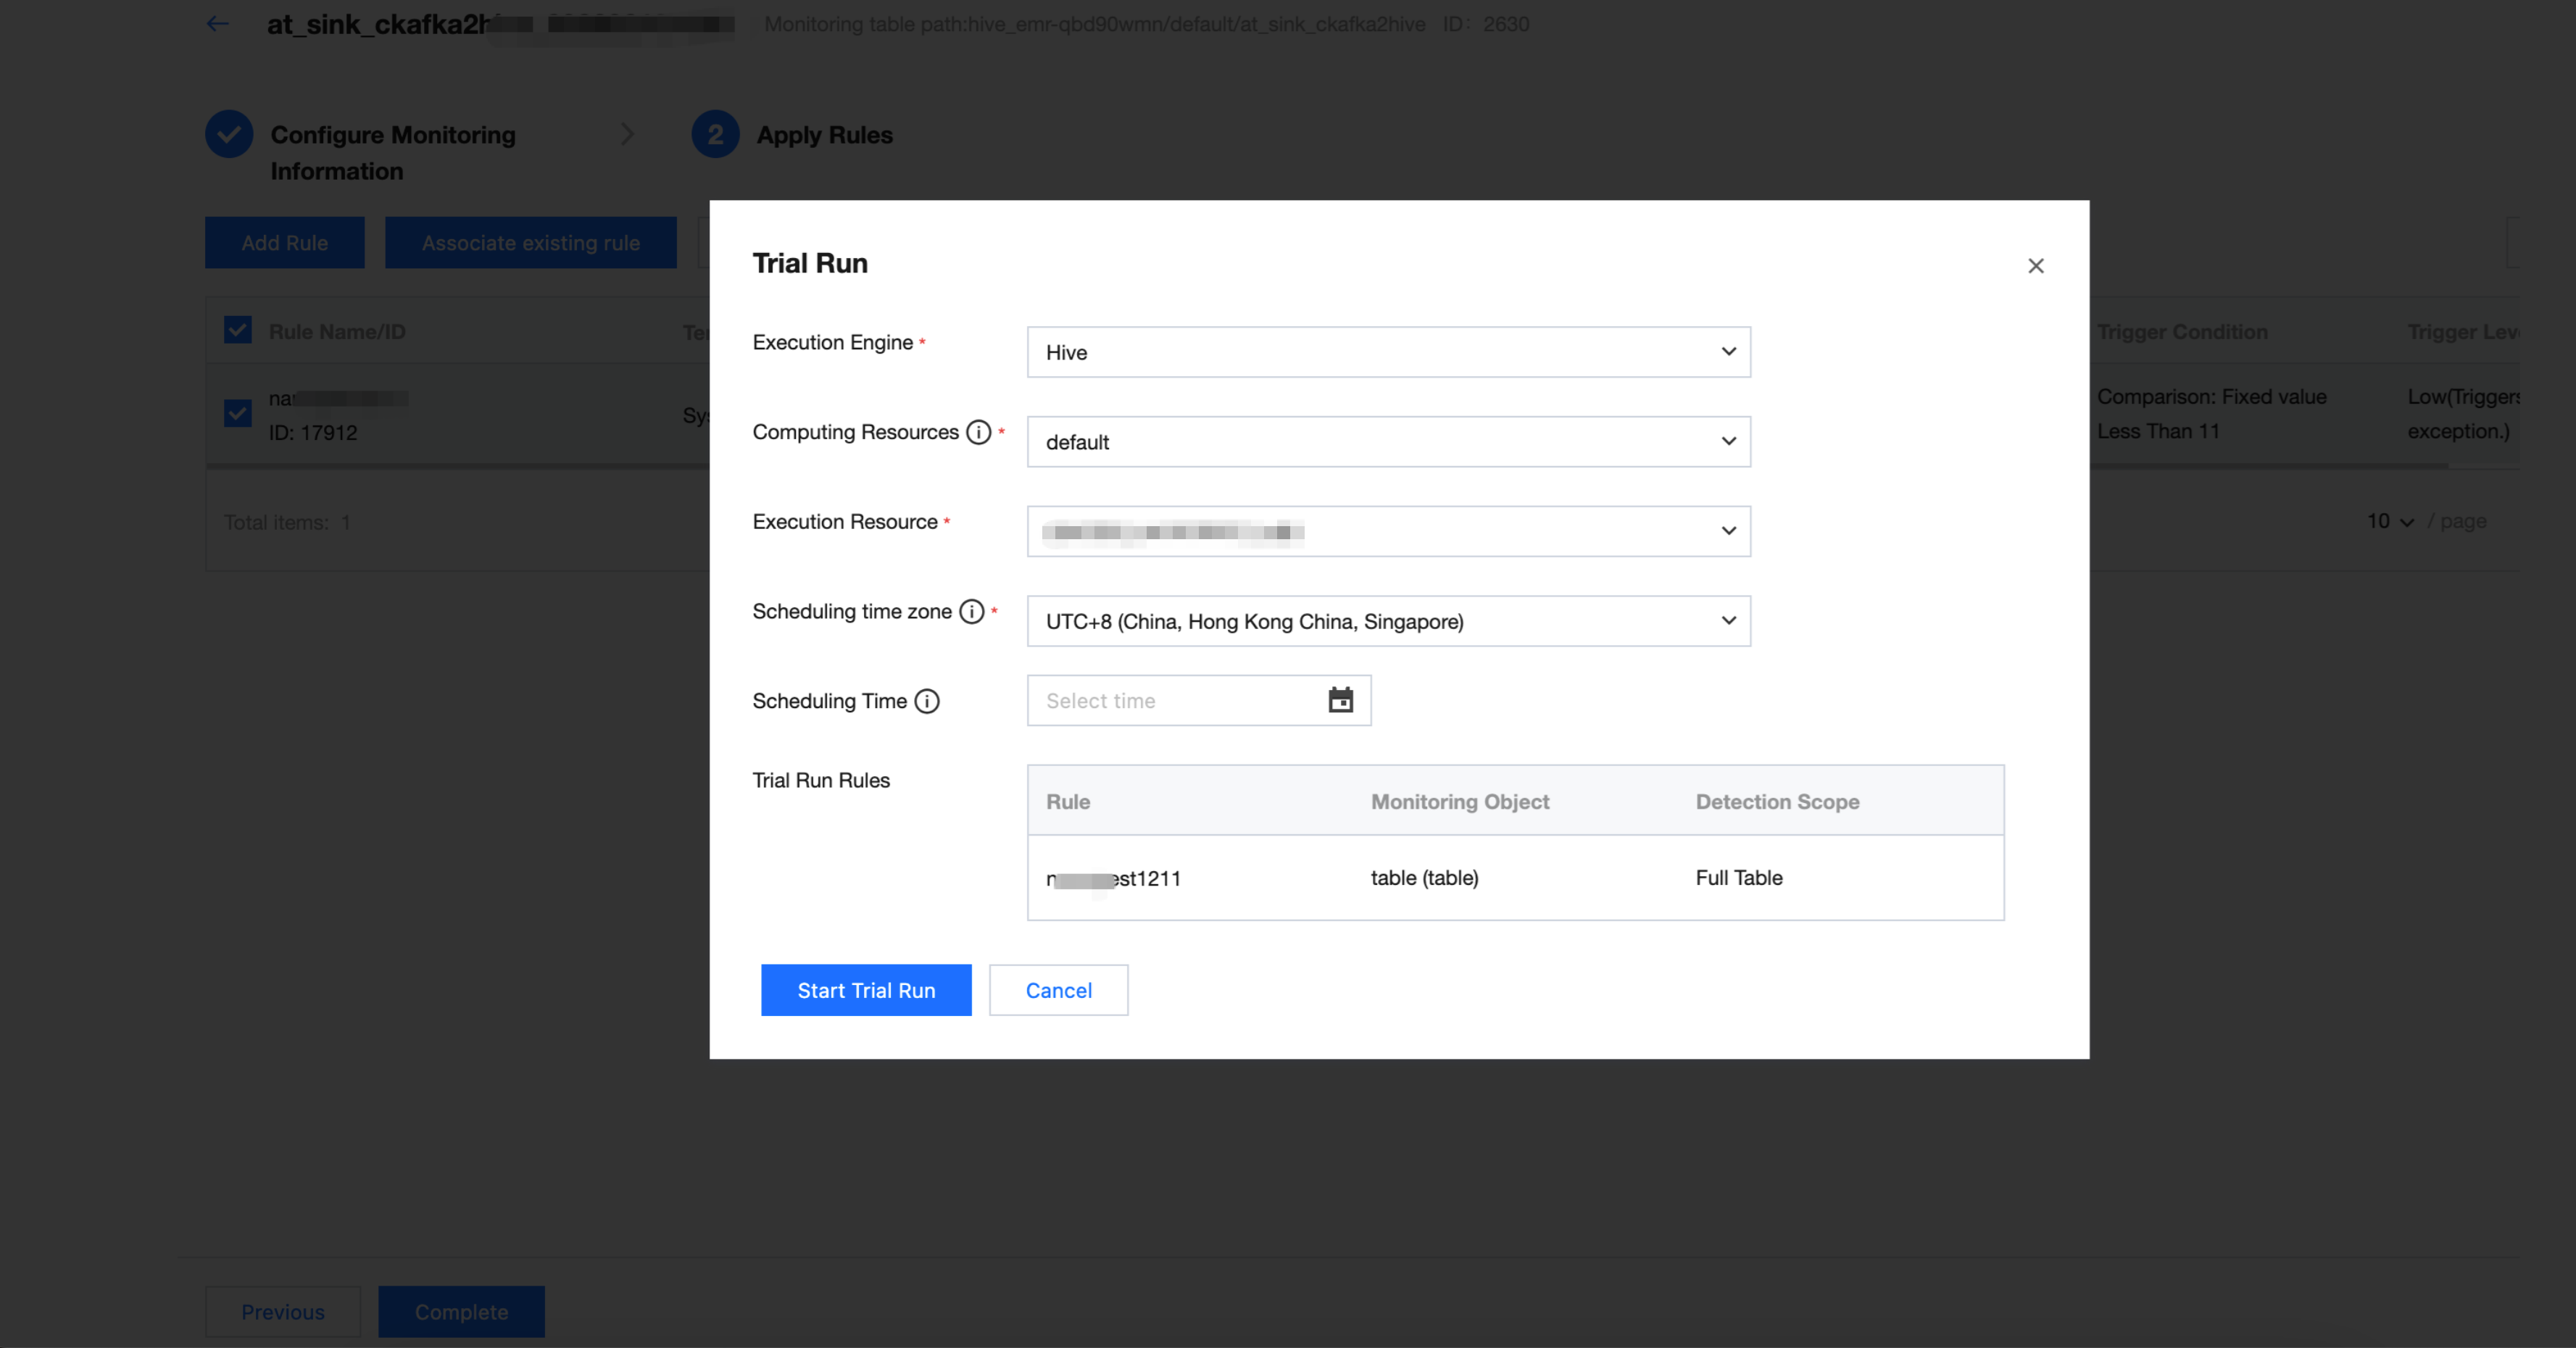
Trial Run
1. Select the rule for the trial run and click Trial Run.
2. Modify the scheduling time and click Start Trial Run. After the trial run ends, you can click Click to view operation results.
Note:
Since the data partition when inserting data is 2024-05-01, you can fill in 2024-05-02 here.
Viewing Trial Run Results
1. After entering the execution instance and result page, you can click on the left dropdown triangle to expand rule details.
2. Click the execution history of a monitor to view historical run results.
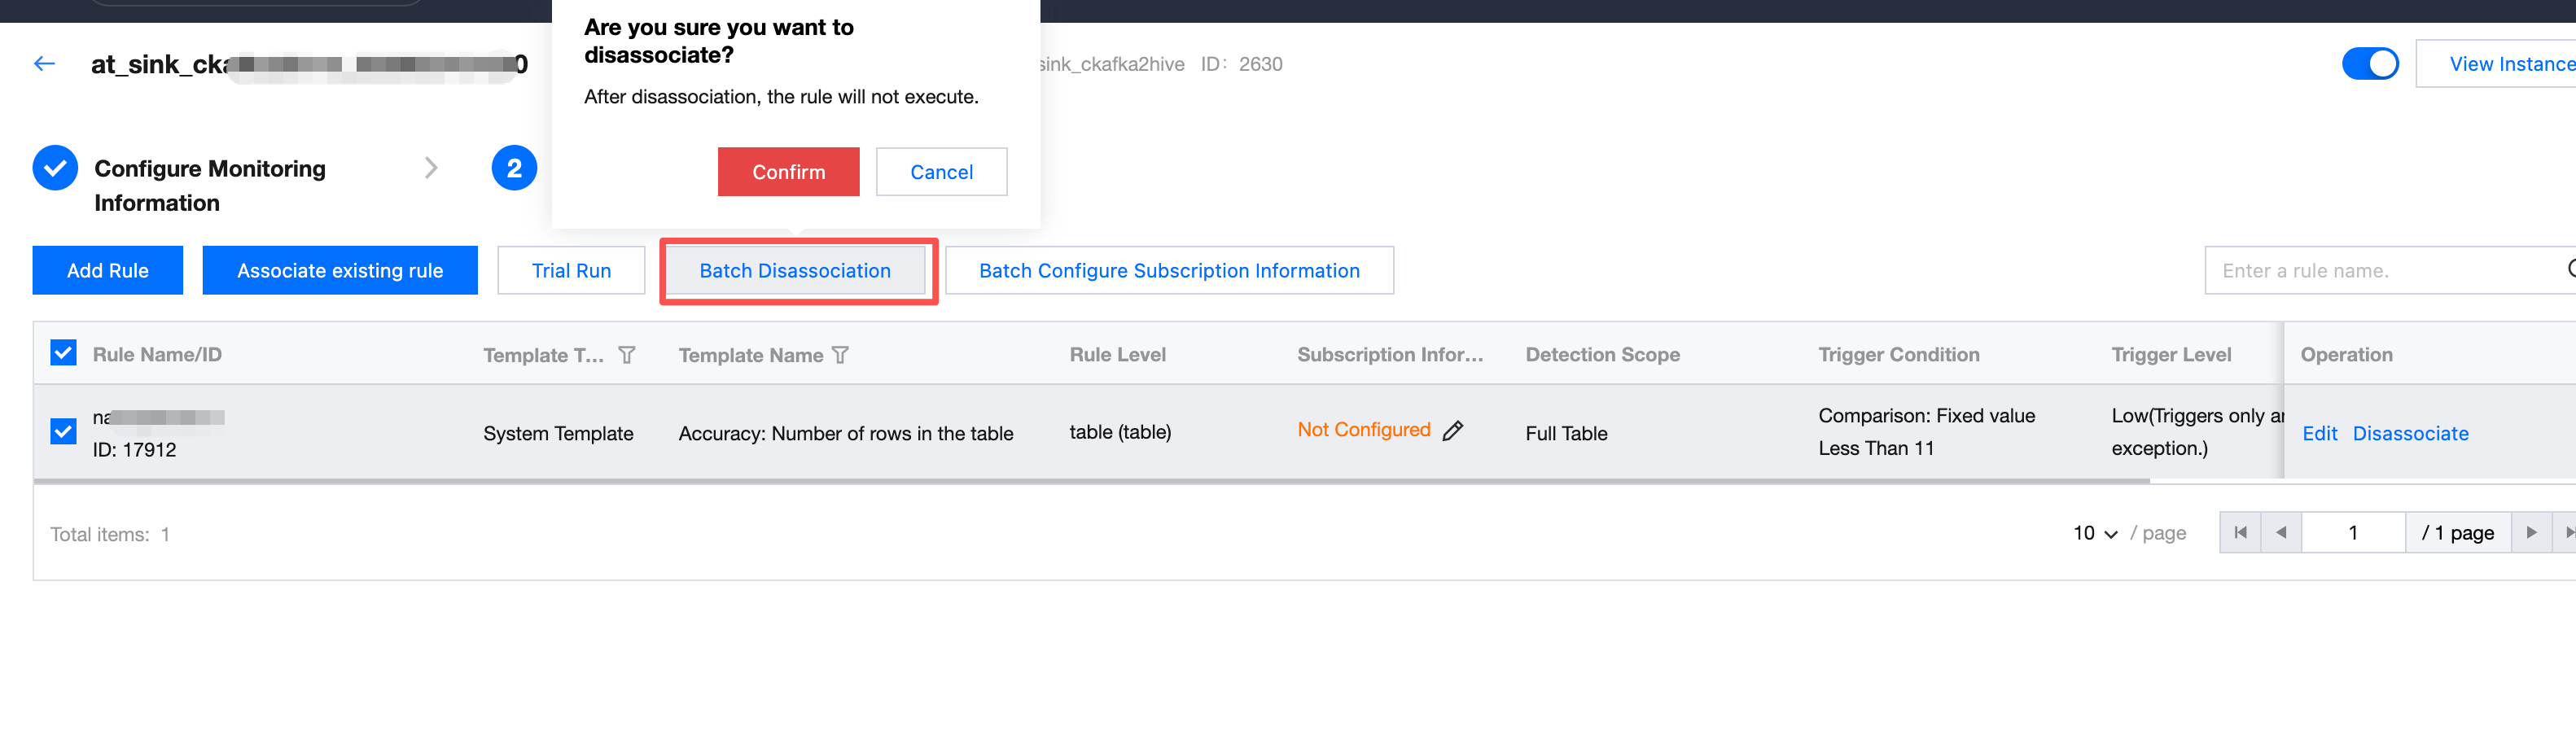
Batch Unbinding
Unselect the correlation between the batch of rules and the monitor.
Note:
Unassociated quality rules will not execute.
To reassociate this rule, you can operate on the Association Rule page.
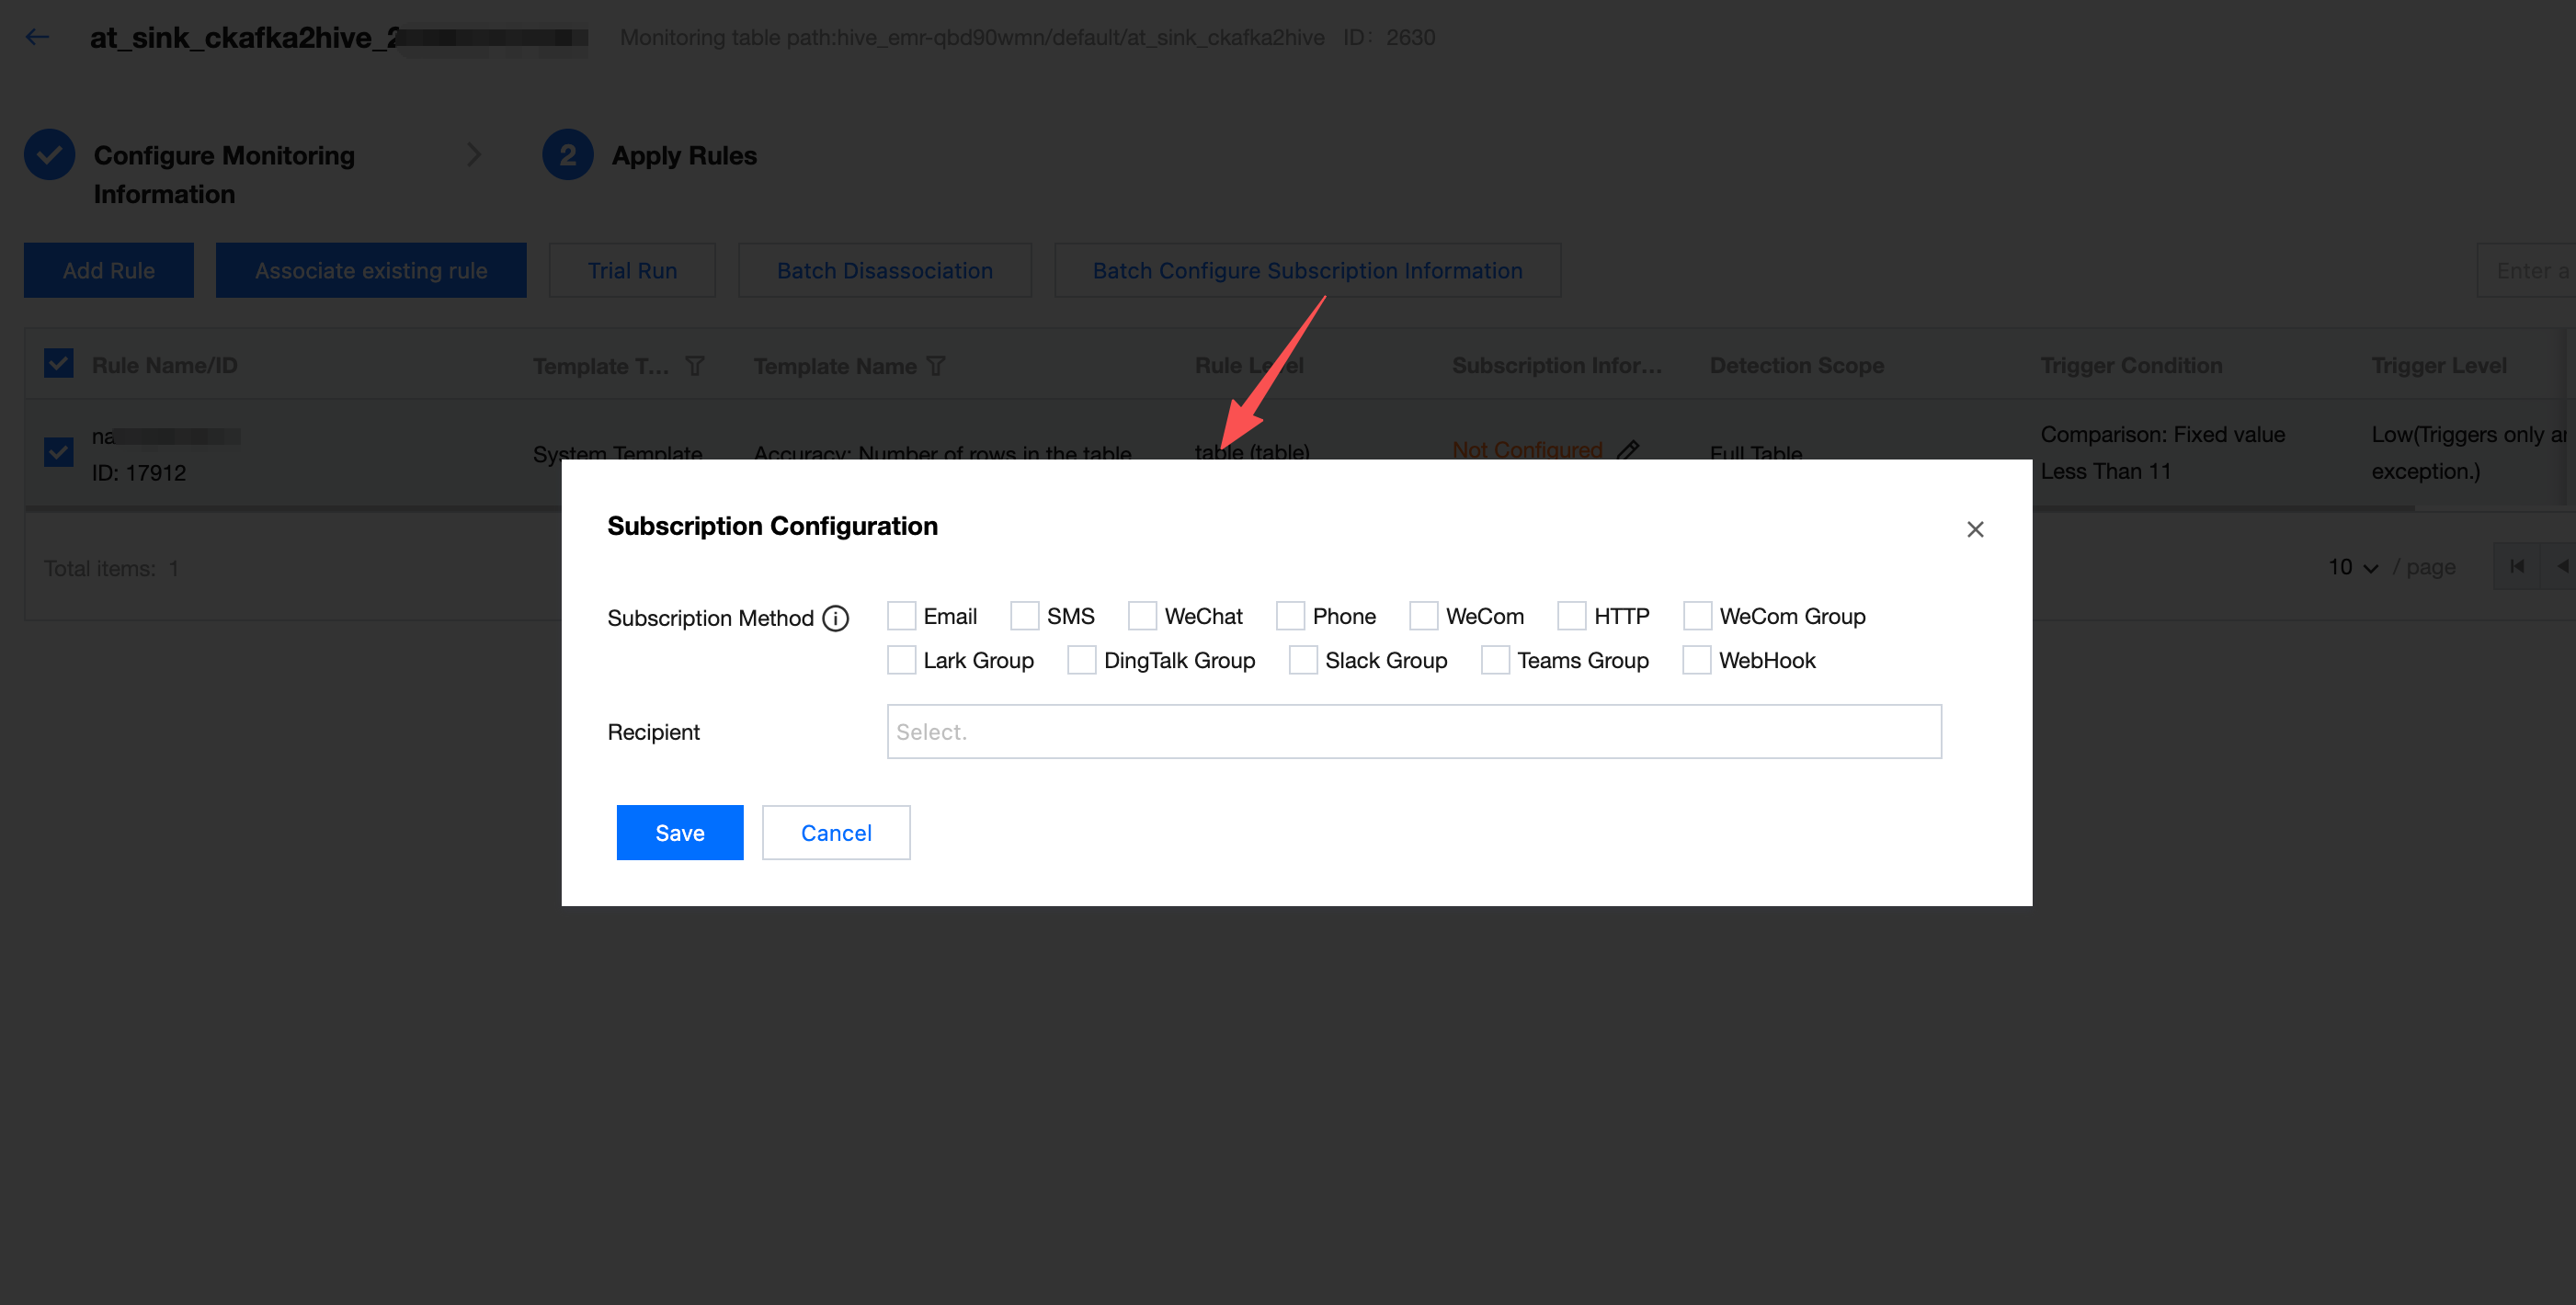
Configuring Subscription
When the task running result of quality inspection meets trigger conditions (result not as expected, detection result failed), what method to send notifications and notify whom.
Enter the Subscription Configuration interface, check the Subscription Method, set up the Recipient, and click Save.
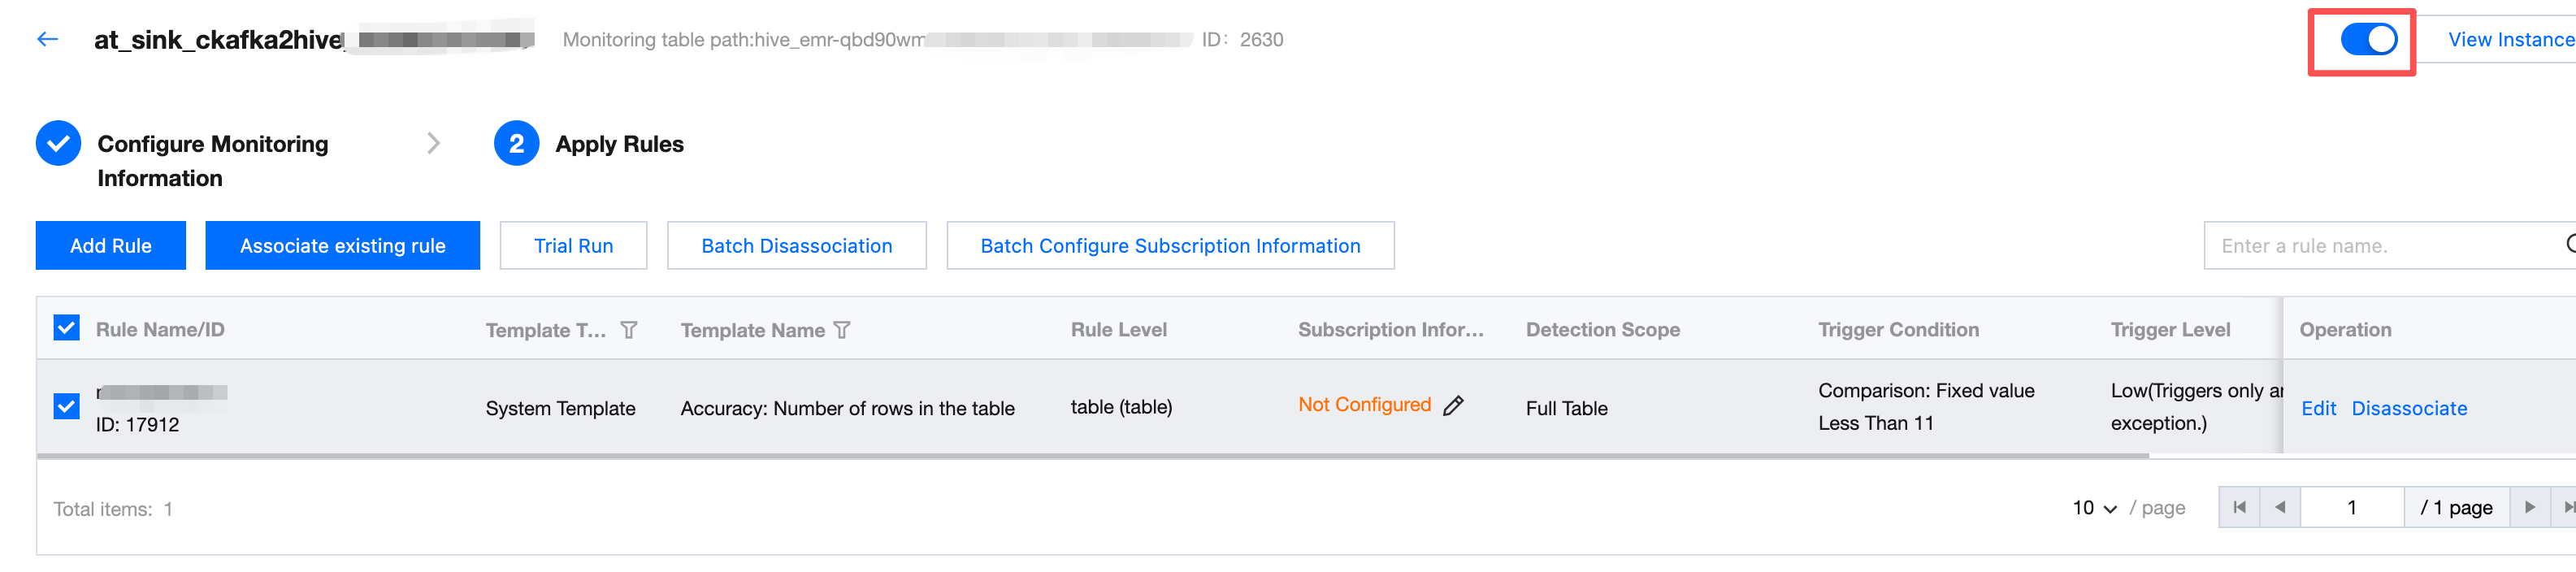
Enabling Monitoring
Based on the trial run result of monitoring, you can enable or disable monitoring in the monitoring status column (monitoring is enabled by default after creation).
Note:
Only monitoring tasks in the enabled state automatically run.
Appendix: Template Usage Guide for Reasoning Tables
Targeting the reasoning table, it supports 20 built-in templates with parameter differences across different templates. Based on parameter differences, templates are categorized into 3 types. This document selects one template from each category as a sample description.
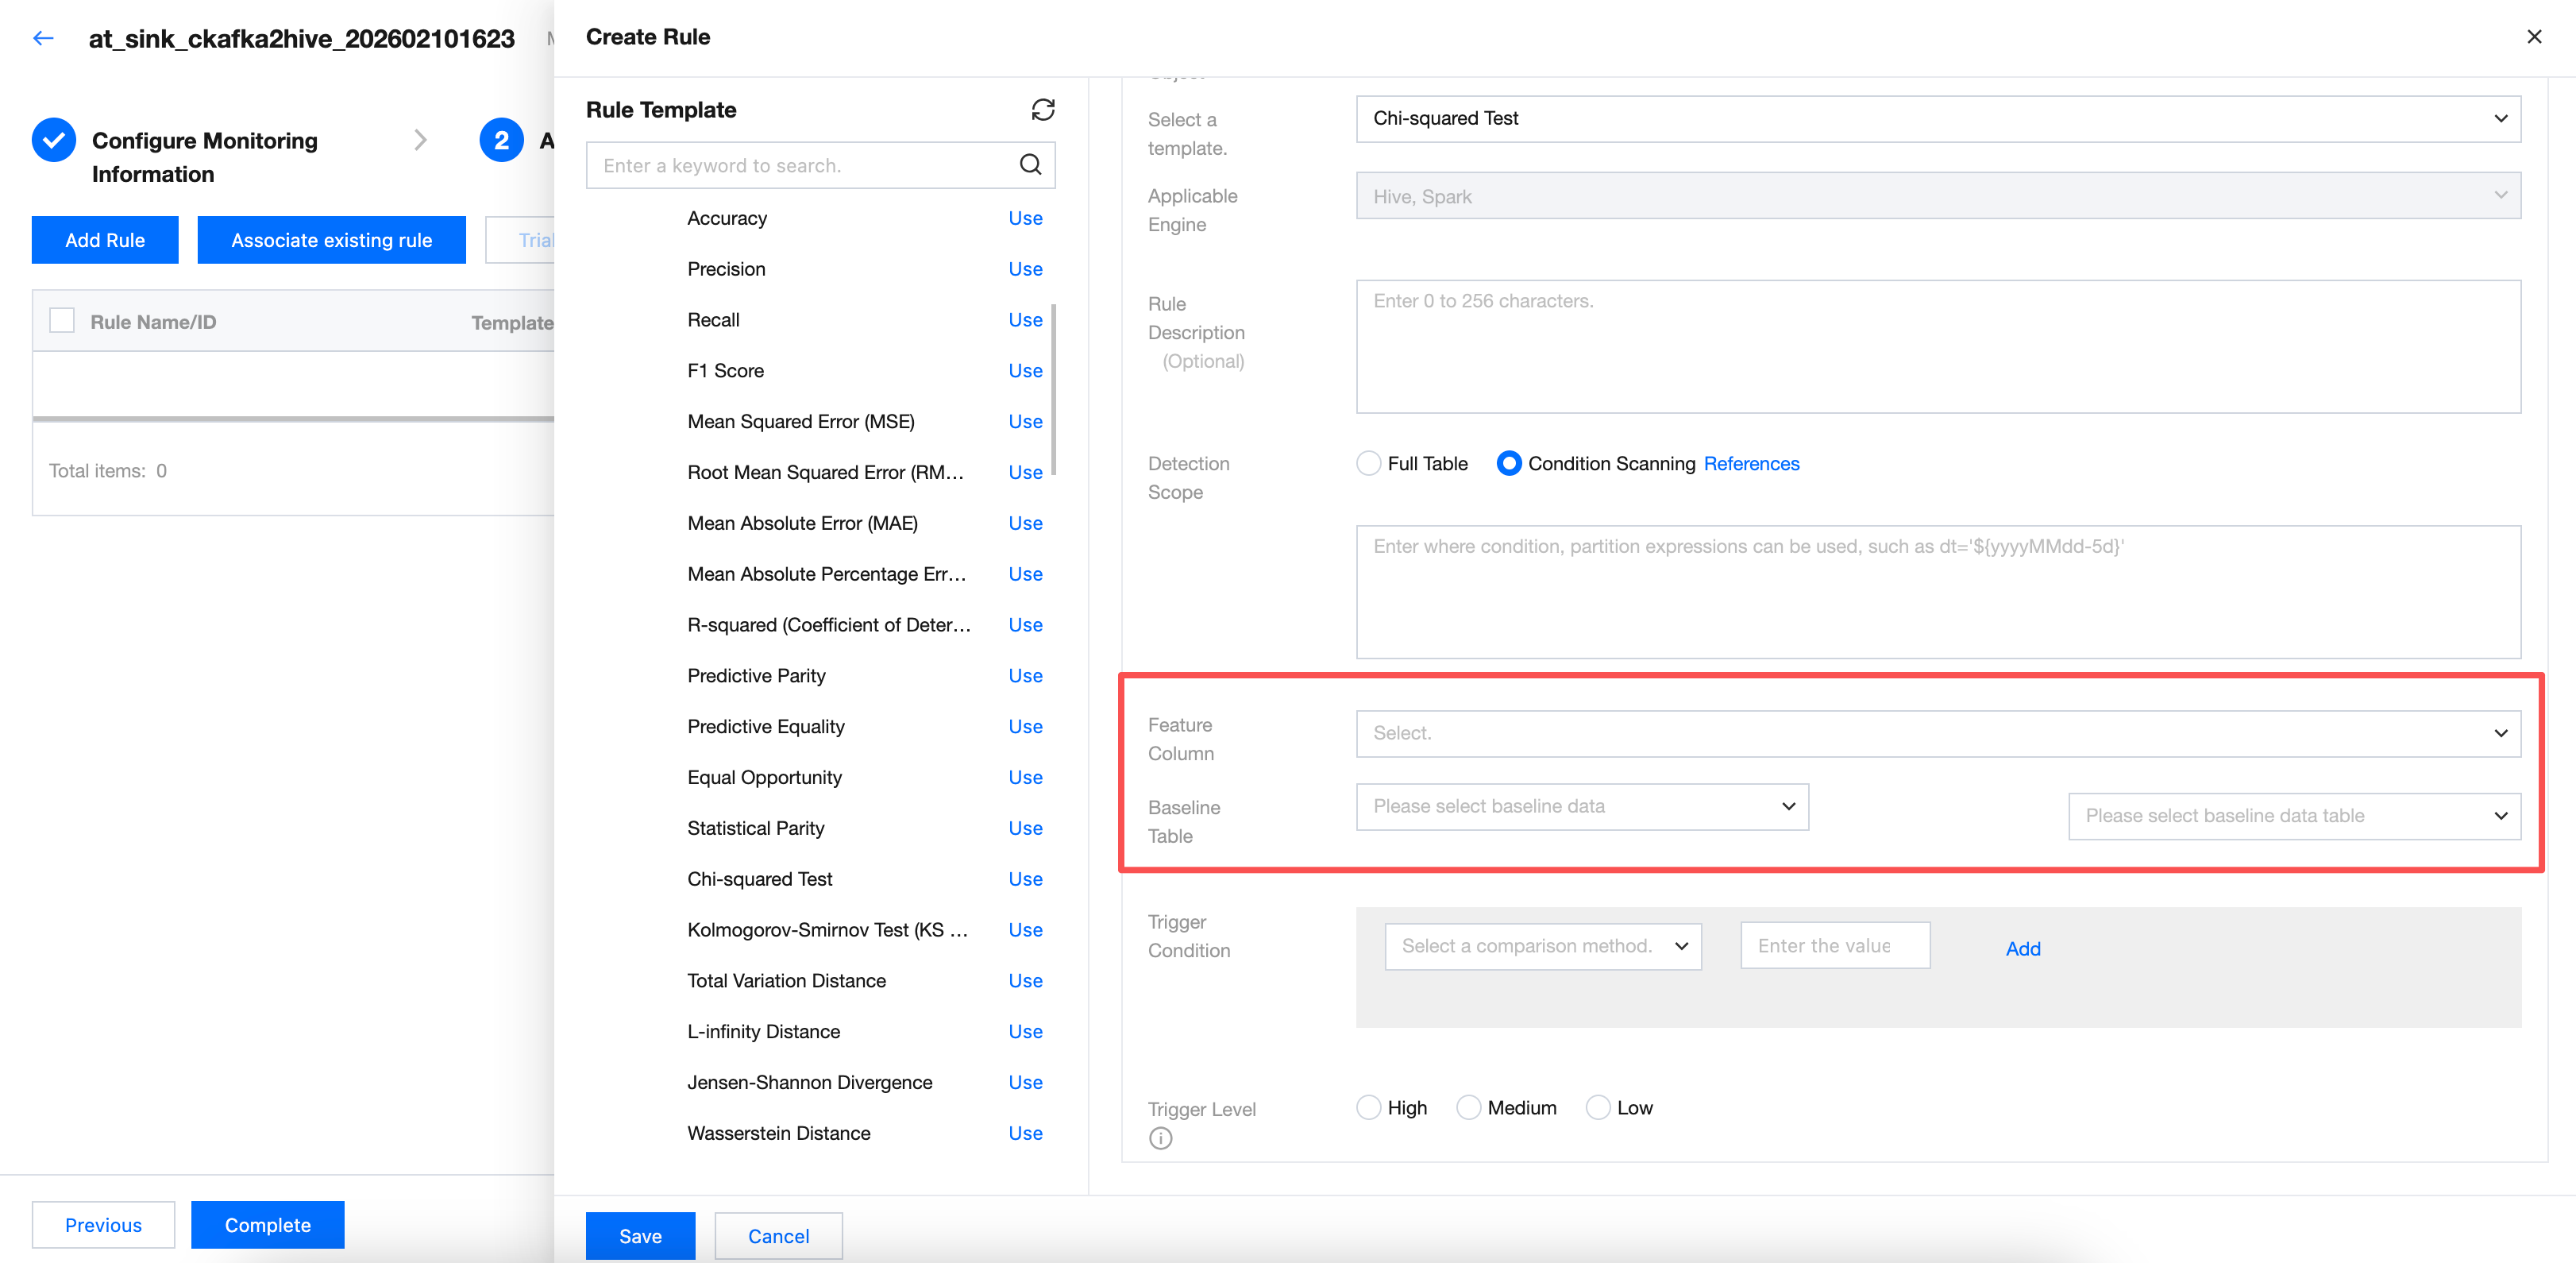
Chi-Squared Test
New configuration parameters include feature column and baseline data table. Required.
Note:
Select the field of the tag column in the table for the feature column. Choose the baseline table for the baseline data table. If the selected field is incorrect, there will be three possible results:
1. The task fails directly with an error.
2. The calculation result is empty, with no data (displayed as "-" on the webpage).
3. There is data, but it has little actual reference significance for model training.
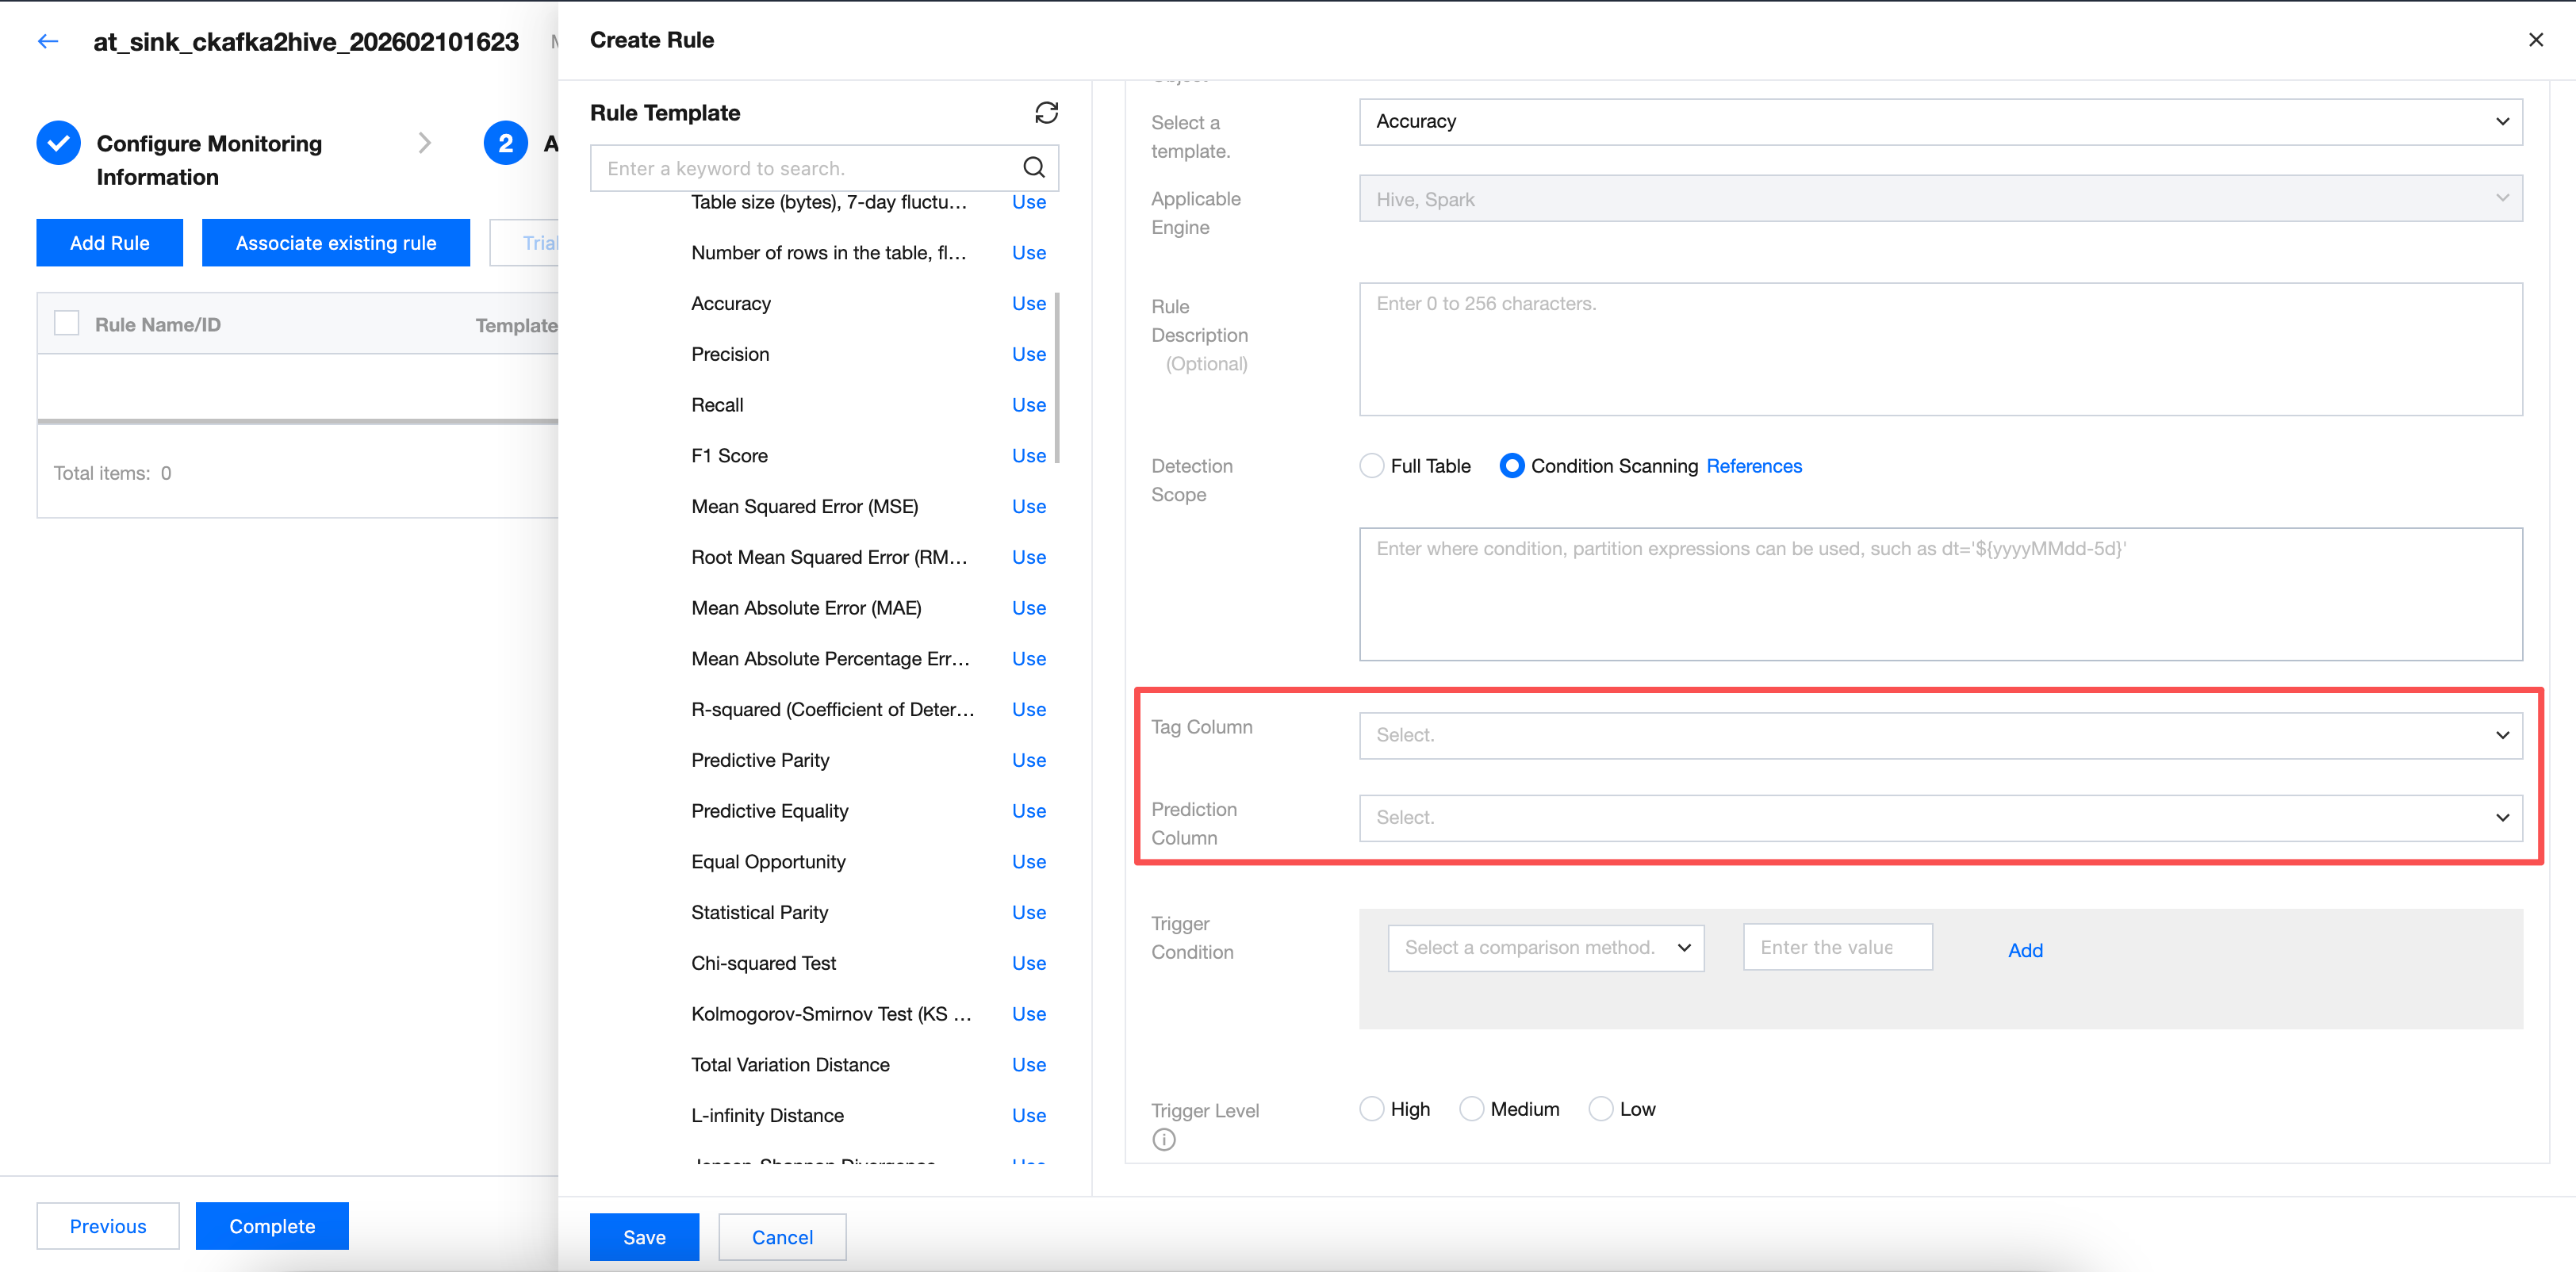
Category 2: Take "accuracy" as a sample.
New configuration parameters include tag column and prediction column. Required.
Note:
Select the field of the tag column and prediction column in the table for the tag column and prediction column. If the selected field is incorrect, there will be three possible results:
1. The task fails directly with an error.
2. The calculation result is empty, with no data (displayed as "-" on the webpage).
3. There is data, but it has little actual reference significance for model training.
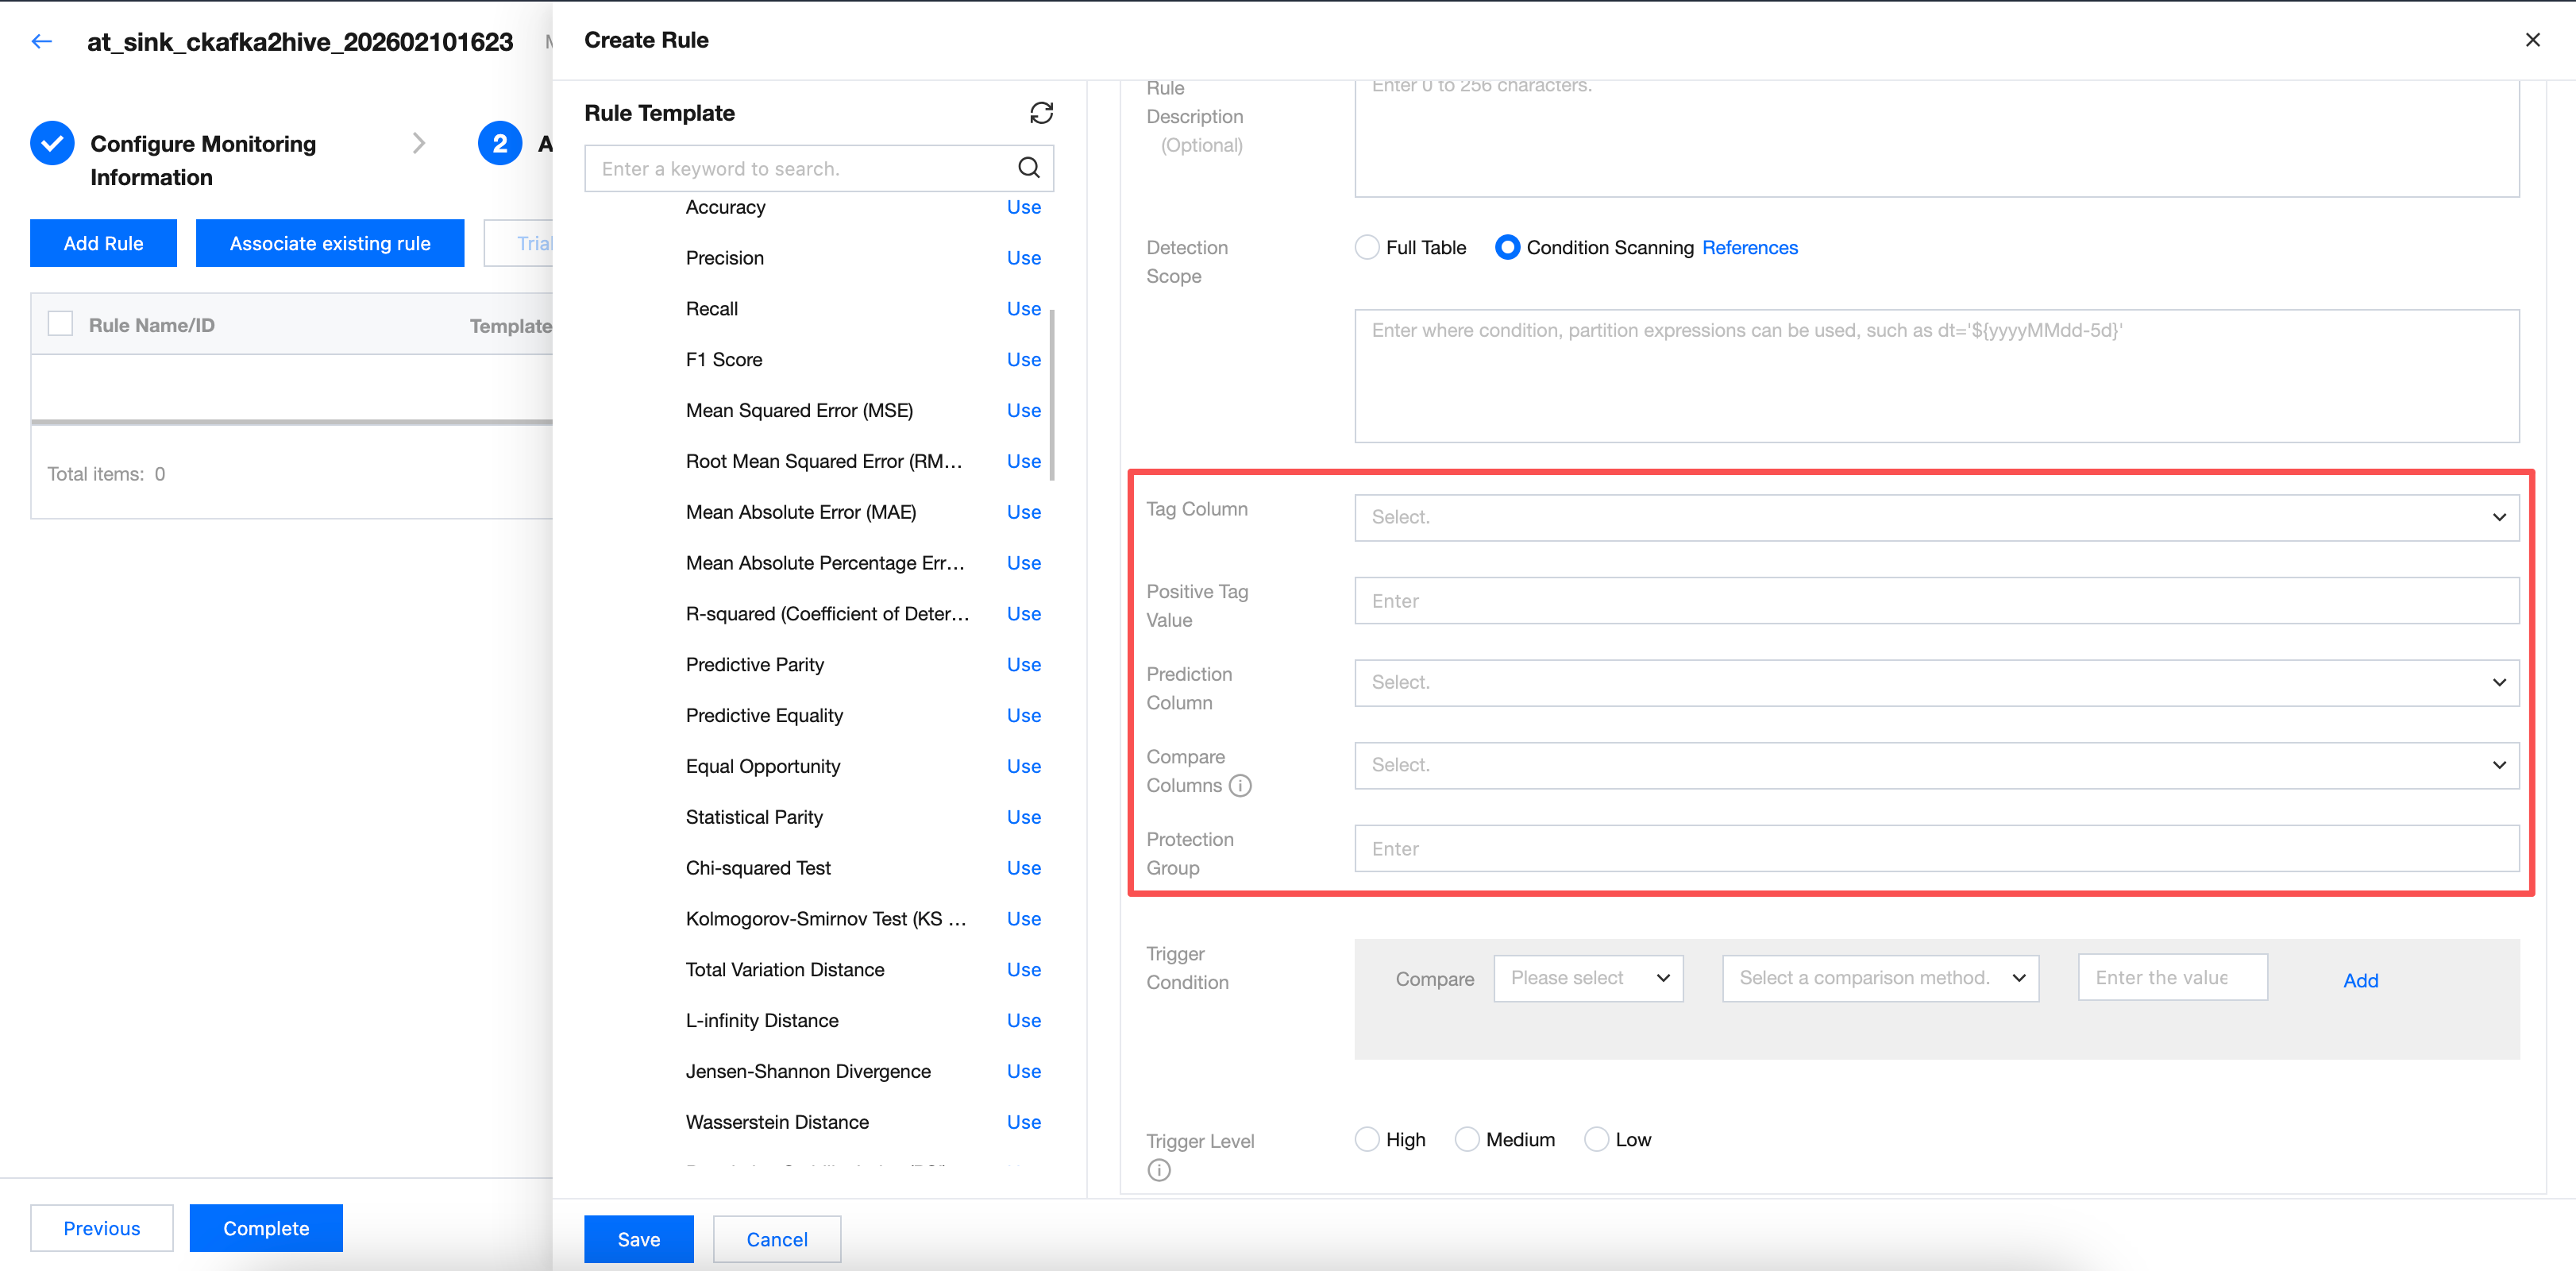
Category 3: Take "predict parity" as a sample.
New configuration parameters include tag column, positive tag value, prediction column, contrast column, and protection value. Required.
Note:
Tag column, positive tag value, prediction column, contrast column, and protection value require selecting the field of positive tag value, prediction column, contrast column, and protection value in the table. If the selected field is incorrect, there will be three possible results:
1. The task fails directly with an error.
2. The calculation result is empty, with no data (displayed as "-" on the webpage).
3. There is data, but it has little actual reference significance for model training.
フィードバック