Slow log (Redis/ValKey Edition)
Download
포커스 모드
폰트 크기
Overview
A slow query is defined as a query request that exceeds the specified time range, and the corresponding statement is called a slow query statement. Slow queries on Tencent Cloud Distributed Cache provide statistics on slow query requests generated by both Redis and Proxy nodes. The information includes the slow query command, generation time, request duration, and specific details.
Redis slow query: It provides statistics on slow query requests generated by the Redis node.
Proxy slow query: It provides statistics on slow query requests generated by the middleware proxy node.
Slow query analysis: It is a feature of TencentDB for DBbrain connected to Tencent Cloud Distributed Cache. DBbrain provides a service for analyzing slow query logs for the database. Slow log analysis of TencentDB for DBbrain is currently in the public beta stage, and you can try it for free. For more information, see Purchase Guide.
Note
The slow logs are retained for 15 days.
A default account can perform up to 15,000 queries per second, while a custom account can perform up to 20 queries per second.
If the query is slow, you can narrow down the query time period.
Prerequisites
You have created a Tencent Cloud Distributed Cache instance. For more information, see Creating Instance.
The database instance is in Running status.
Directions
Querying slow logs
1. Log in to the Tencent Cloud Distributed Cache console.
2. Above the Instance List on the right, select the region.
3. In the instance list, find the target instance.
4. Click the target instance ID to enter the Instance Details page.
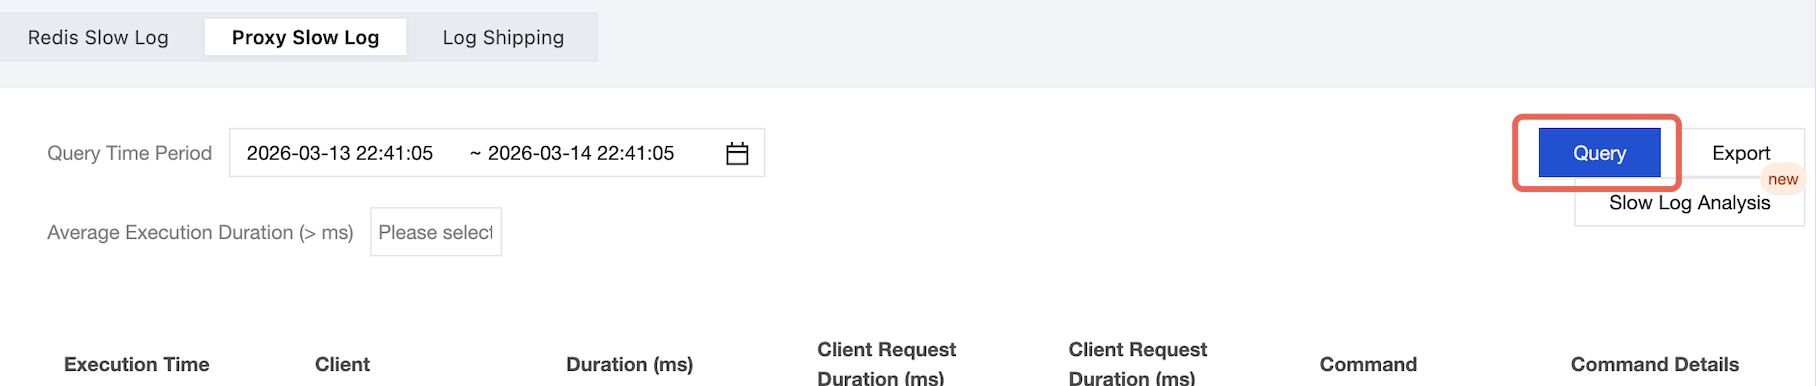
5. Switch to the Slow Log > Redis Slow Log tab, select a time range after Query Time Period, select a command request threshold that exceeds the duration from the drop-down list after Average Execution Duration, select the query node from the drop-down list after Node Role, and click Query. The record information of slow queries executed within this time range is displayed, including the slow query request command, execution time, execution duration, and command details.
Note:
To query the slow query logs generated by the proxy node, switch to the Proxy Slow Log tab.
Redis slow query logs record operations with the execution duration exceeding 1 ms, 5 ms, 10 ms, 20 ms, 30 ms, 40 ms, or 50 ms. The default duration is 30 ms.
Proxy slow query logs record operations with the execution duration exceeding 10 ms, 20 ms, 30 ms, 40 ms, or 50 ms. The default duration is 30 ms.
Related Operations
Exporting slow log
1. Click Export in the top-right corner of the Redis Slow Log or Proxy Slow Log page.
2. In the pop-up window, view the limit on the number of slow logs that can be exported at a time, and click Export.
3. Open the exported slow logs in Excel.
Analyzing slow log
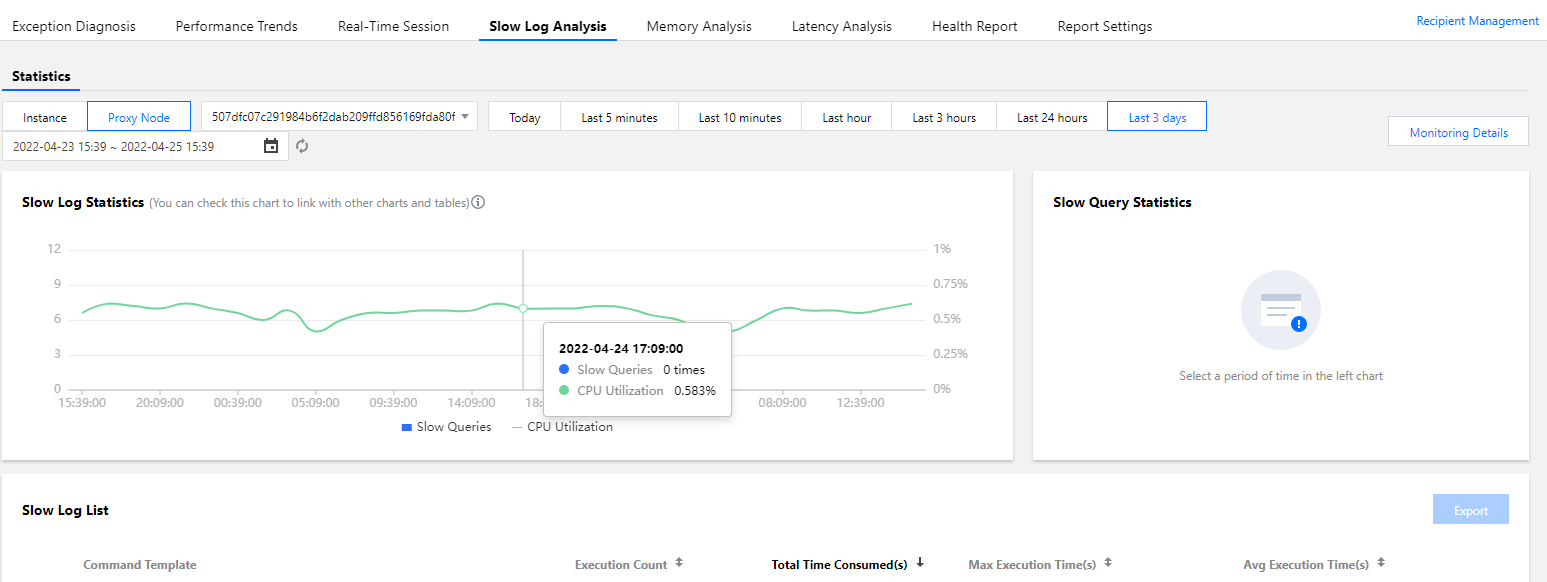
1. Click Slow Log Analysis in the top-right corner of the Redis Slow Log or Proxy Slow Log tab.
2. On DBbrain > Slow Log Analysis > Performance Optimization, select the query time period, and view the slow log information at the instance level or proxy level as needed. For more analysis, see Slow Log Analysis.
Related APIs
API Name | Description |
Queries the slow logs of an instance | |
Queries the slow queries of proxy |
피드백