The Memcached Edition instance provides comprehensive and transparent instance-level monitoring services, aggregating the entire instance's monitoring data using aggregation algorithms such as SUM, AVG, MAX, and LAST.
Viewing Instance Monitoring Granularity
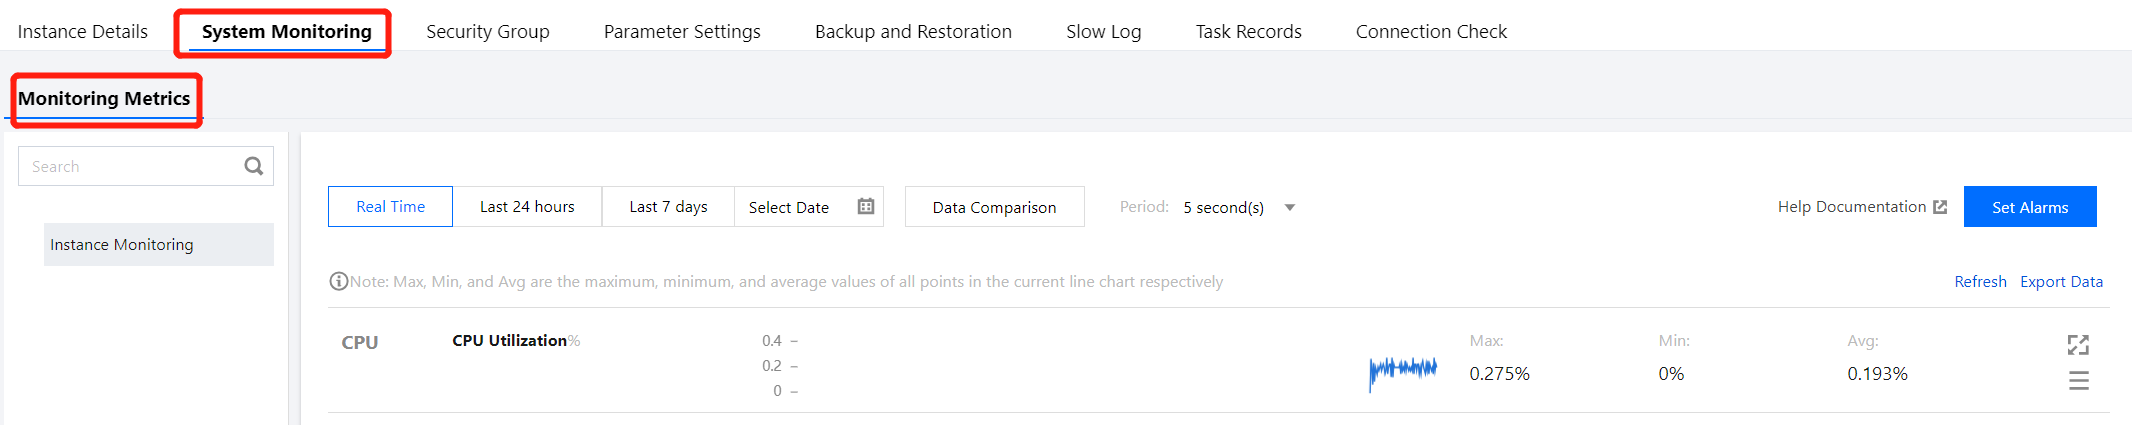
Through the Tencent Cloud Distributed Cache Console: Click the instance ID to enter the Instance Details page, and then select System Monitoring > Monitoring Metrics page. Redis currently supports monitoring at granularities of 5 seconds, 1 minute, 5 minutes, 1 hour, and 1 day. For the retention periods of each monitoring granularity, see Use Limits.
Through the API DescribeInstances: Check the field InstanceSet.MonitorVersion. If MonitorVersion = 5s, it indicates a 5-second granularity; if MonitorVersion = 1m, it indicates a 1-minute granularity.
Viewing Monitoring Data
You can view monitoring information through the Redis instance list, the Redis system monitoring page, and the TCOP console.
2. At the top of the Instance List page on the right, select the region.
3. In the instance list, locate the target instance.
4. Click the Instance ID in blue text to enter the Instance Details page. Click the System Monitoring tab, then select the Monitoring Metrics tab to view the monitoring data.
Viewing Monitoring Data via TCOP
Log in to the TCOP Console to view aggregated monitoring data.
Instance Monitoring
Instance monitoring summarizes the entire instance's monitoring data, aggregated by using algorithms such as SUM, AVG, MAX, and LAST.
Category
Metric Name (Chinese)
Metric Name (English)
Unit
Description
CPU Monitoring
CPU Utilization
cpu_util
%
Average CPU utilization
Memory monitoring
Memory usage
mem_used
MB
Actual memory usage, including both data and cache
Memory utilization
mem_util
%
Ratio of actual memory used to total allocated memory
Total number of keys
keys
count
Total number of keys stored in the instance (primary keys)
Number of expired Key
expired
count
Number of expired keys within the time window, corresponding to the expired_keys metric in the info command
Number of evicted Key
evicted
count
Number of keys evicted within the time window, corresponding to the evicted_keys metric in the info command
Number of keys with expiration time set
expires
count
Number of keys with an expiration time set in the instance (primary keys)
Network monitoring
Number of connections
connections
count
Number of TCP connections to the instance
Connection utilization
connections_util
%
Ratio of actual TCP connections to the maximum number of connections
Inbound traffic
in_flow
Mb/s
Amount of traffic entering the database per second
Inbound traffic utilization
in_bandwidth_util
%
Ratio of actual private network inbound traffic to the maximum bandwidth
Inbound traffic limit trigger
in_flow_limit
times
Number of occurrences where inbound traffic exceeded the maximum bandwidth
Outbound traffic
out_flow
Mb/s
Amount of traffic exiting the database per second
Outbound traffic utilization
out_bandwidth_util
%
Ratio of actual outbound traffic to the maximum bandwidth
Outbound traffic limit trigger
out_flow_limit
times
Number of occurrences where outbound traffic exceeded the maximum bandwidth
Latency
Average execution latency
latency_avg
ms
Average request execution latency
Maximum execution latency
latency_max
ms
Maximum execution latency
Average read latency
latency_read
ms
Average latency for read commands
Average execution latency for read command
latency_write
ms
Average latency for write commands
Average latency for other commands
latency_other
ms
Average execution latency for non-read/write commands
Request monitoring
Total requests
commands
requests/s
QPS, that is, the number of commands executed
Read requests
cmd_read
requests/s
Number of read commands executed
Write requests
cmd_write
requests/s
Number of write commands executed
Other requests
cmd_other
requests/s
Number of non-read/write commands executed
Large Value requests
cmd_big_value
requests/s
Number of commands with request sizes exceeding 32 KB executed
Number of Key requests
cmd_key_count
requests/s
Number of keys accessed by commands
Number of Mget requests
cmd_mget
requests/s
Number of Mget commands executed
Slow queries
cmd_slow
times
Execution latency exceeding the number of times for slowlog-log-slower-than configuration
Read request hits
cmd_hits
times
Number of keys found during read requests, corresponding to the keyspace_hits metric in the info command
Read request misses
cmd_miss
times
Number of keys not found during read requests, corresponding to the keyspace_misses metric in the info command
Execution Error
cmd_err
times
Number of command execution errors, such as non-existent commands or incorrect parameters
Read request hit rate
cmd_hits_ratio
%
Key hits / (Key hits + Key misses). This metric reflects the cache miss rate.