Logstash is an open source log processing tool that collects data from multiple sources, filters the collected data, and stores the data for other purposes.
Logstash is highly flexible, has powerful syntax analysis features and rich plugins, and supports multiple input and output sources. As a horizontally scalable data pipeline, Logstash works with Elasticsearch and Kibana to provide powerful log collection and search capabilities.
How Logstash Works
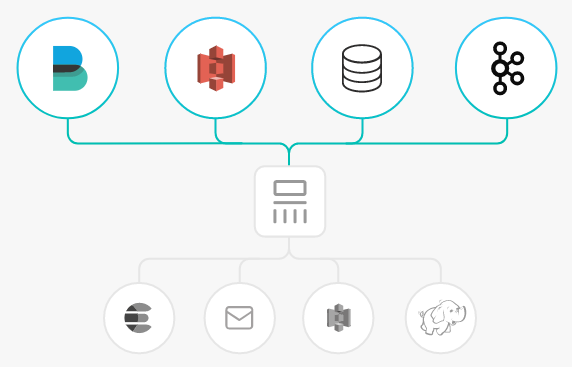
Logstash data processing can be divided into three phases: inputs → filters → outputs.
1. Inputs: Data is input from different sources, such as files, syslog, Redis, and Beats.
2. Filters: Data is modified and filtered. This is an intermediate process in the Logstash data pipeline, where events can be changed based on actual conditions. Common filters include grok, mutate, drop, and clone.
3. Outputs: Data is transferred to other destinations. An event can be transferred to multiple outputs, and ends when the transfer is completed. Elasticsearch is the most common output.
Logstash supports encoding and decoding, and allows specified formats for the input and output ends.
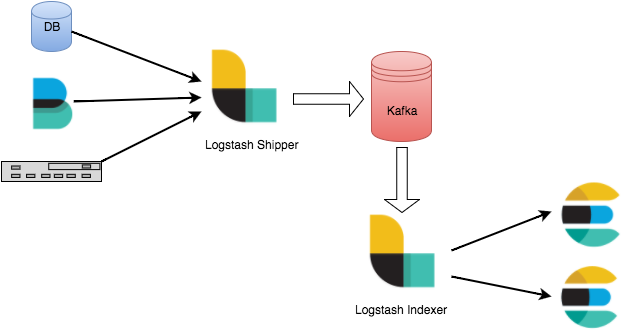
Strengths of Accessing Kafka via Logstash
Asynchronous data processing: Data can be processed asynchronously to prevent burst traffic.
Decoupling: When Elasticsearch fails, upstream workloads will not be affected.
Note
The Logstash filtering consumes resources. If deployed on a production server, Logstash will affect the performance of the server.
2. In the left sidebar, select Instance List and click the ID of the target instance to go to the basic instance information page.
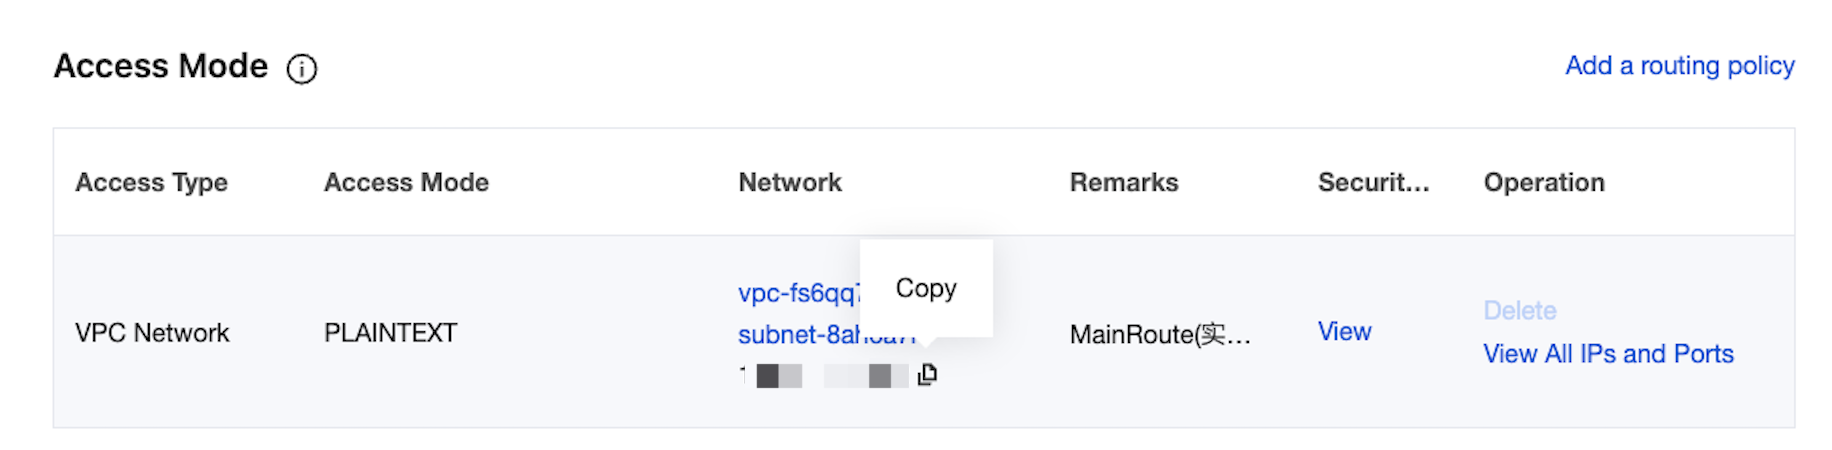
3. On the Access Mode section of the instance's basic information page, you can obtain the access address of the instance.
Step 2: Creating Topic
1. On the basic instance information page, select the Topic List tab at the top.
2. On the Topic Management page, click Create to create a Topic named logstash_test.
Step 3: Access CKafka
Note
You can click the tabs below to view the steps for accessing CKafka as inputs or outputs.
As inputs
As outputs
1. Run bin/logstash-plugin list to check whether the installed plugins include logstash-input-kafka.
2. Create the configuration file input.conf in the .bin/ directory.
Here, standard output is used as the data destination, and Kafka is used as the data source.
consumer_threads =>3 // Number of consumption threads, which is generally the same as the number of CKafka partitions.
auto_offset_reset =>"earliest"
}
}
output {
stdout{codec=>rubydebug}
}
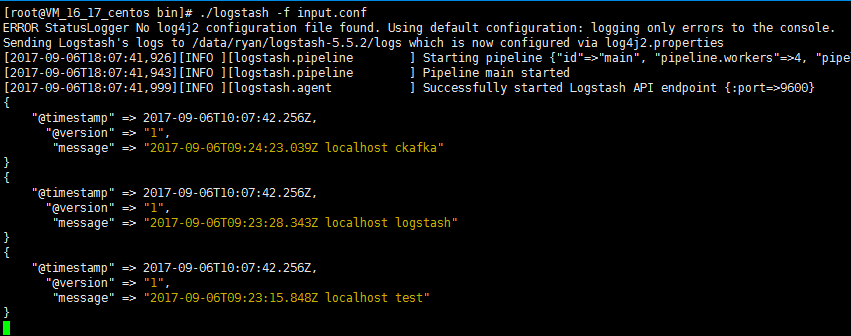
3. Run the following command to start Logstash to consume messages.
./logstash -f input.conf
The result is as follows:
You can see that the data in the Topic has been consumed.
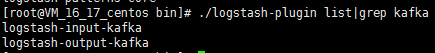
1. Run bin/logstash-plugin list to check whether the installed plugins include logstash-output-kafka.
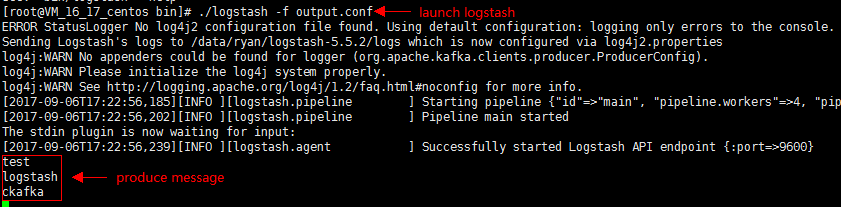
2. Create the configuration file output.conf in the .bin/ directory. Here, standard input is used as the data source, with Kafka as the data destination.