This document is a practical guide for EdgeOne real-time log push to Splunk. Splunk is a powerful data platform that supports large-scale data collection, indexing, and analysis, widely used for security log analysis, Ops monitoring, and other scenarios. Through this tutorial, you can push EdgeOne logs to Splunk in real time to achieve uniform log analytics and visualization capability.
If you have not yet learned how to create a real-time log push task or define push content, for details, see Push to HTTP Server.
For Splunk Cloud, the HEC feature is enabled by default. You can verify its availability on the Settings > Data Inputs > HTTP Event Collector webpage.
Understood the basic requirements for Splunk log collection, including authentication header (Authorization: Splunk <token>), log format (JSON structure), and transport protocol (HTTPS). For details, see Format events for HTTP Event Collector.
Operation Steps
Configuring Splunk Platform
1. Log in to the Splunk console.
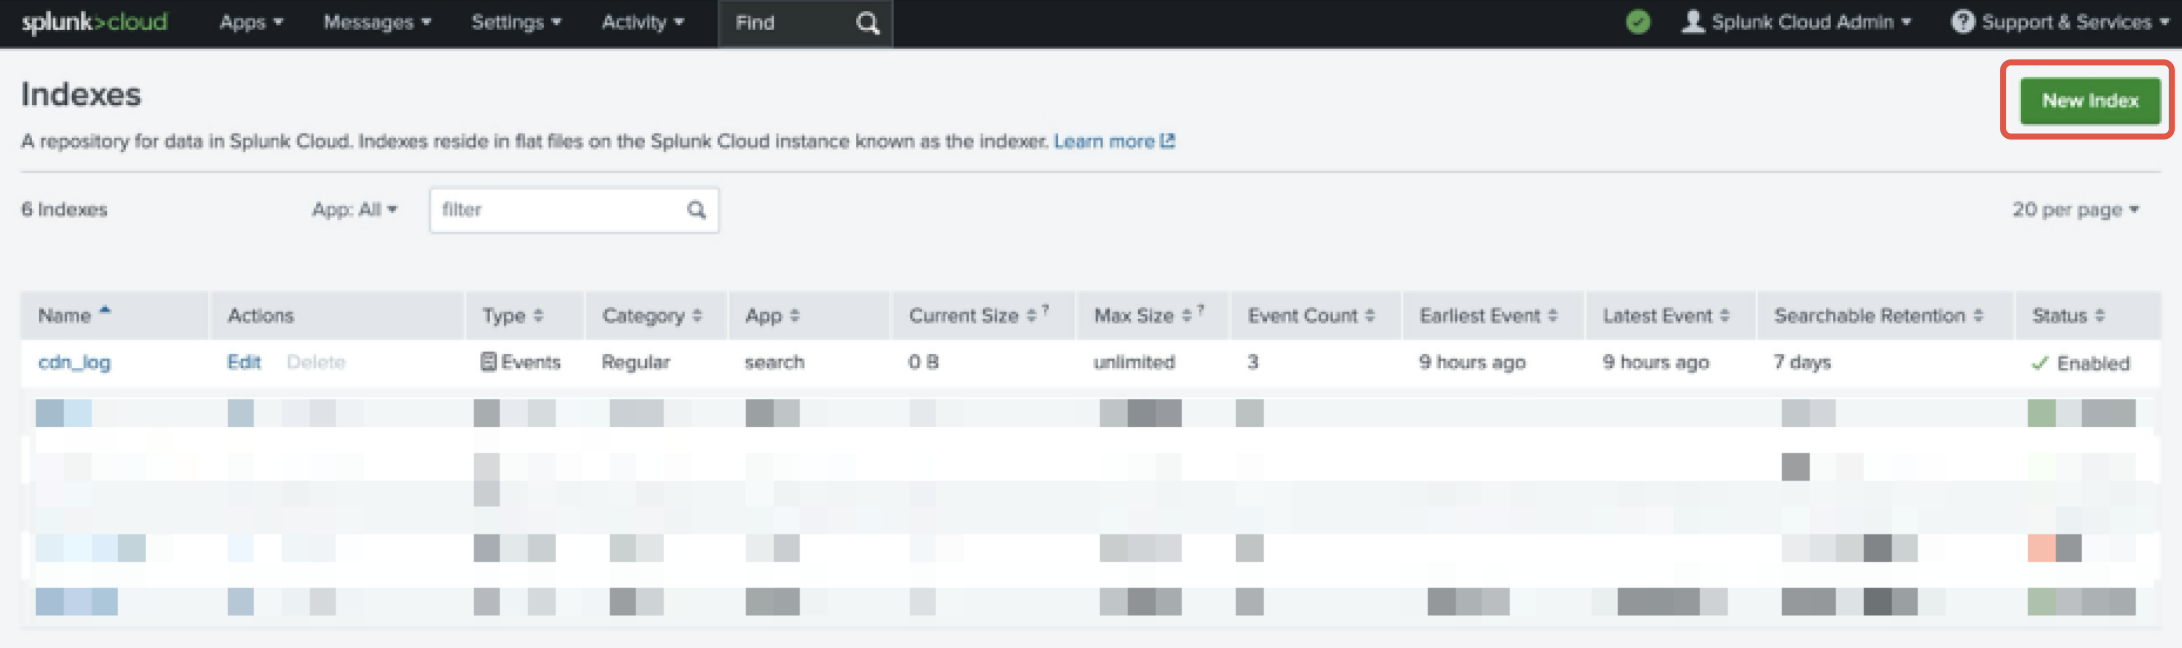
2. Click Settings > Indexes in the left sidebar to create an index (example: cdn_log).
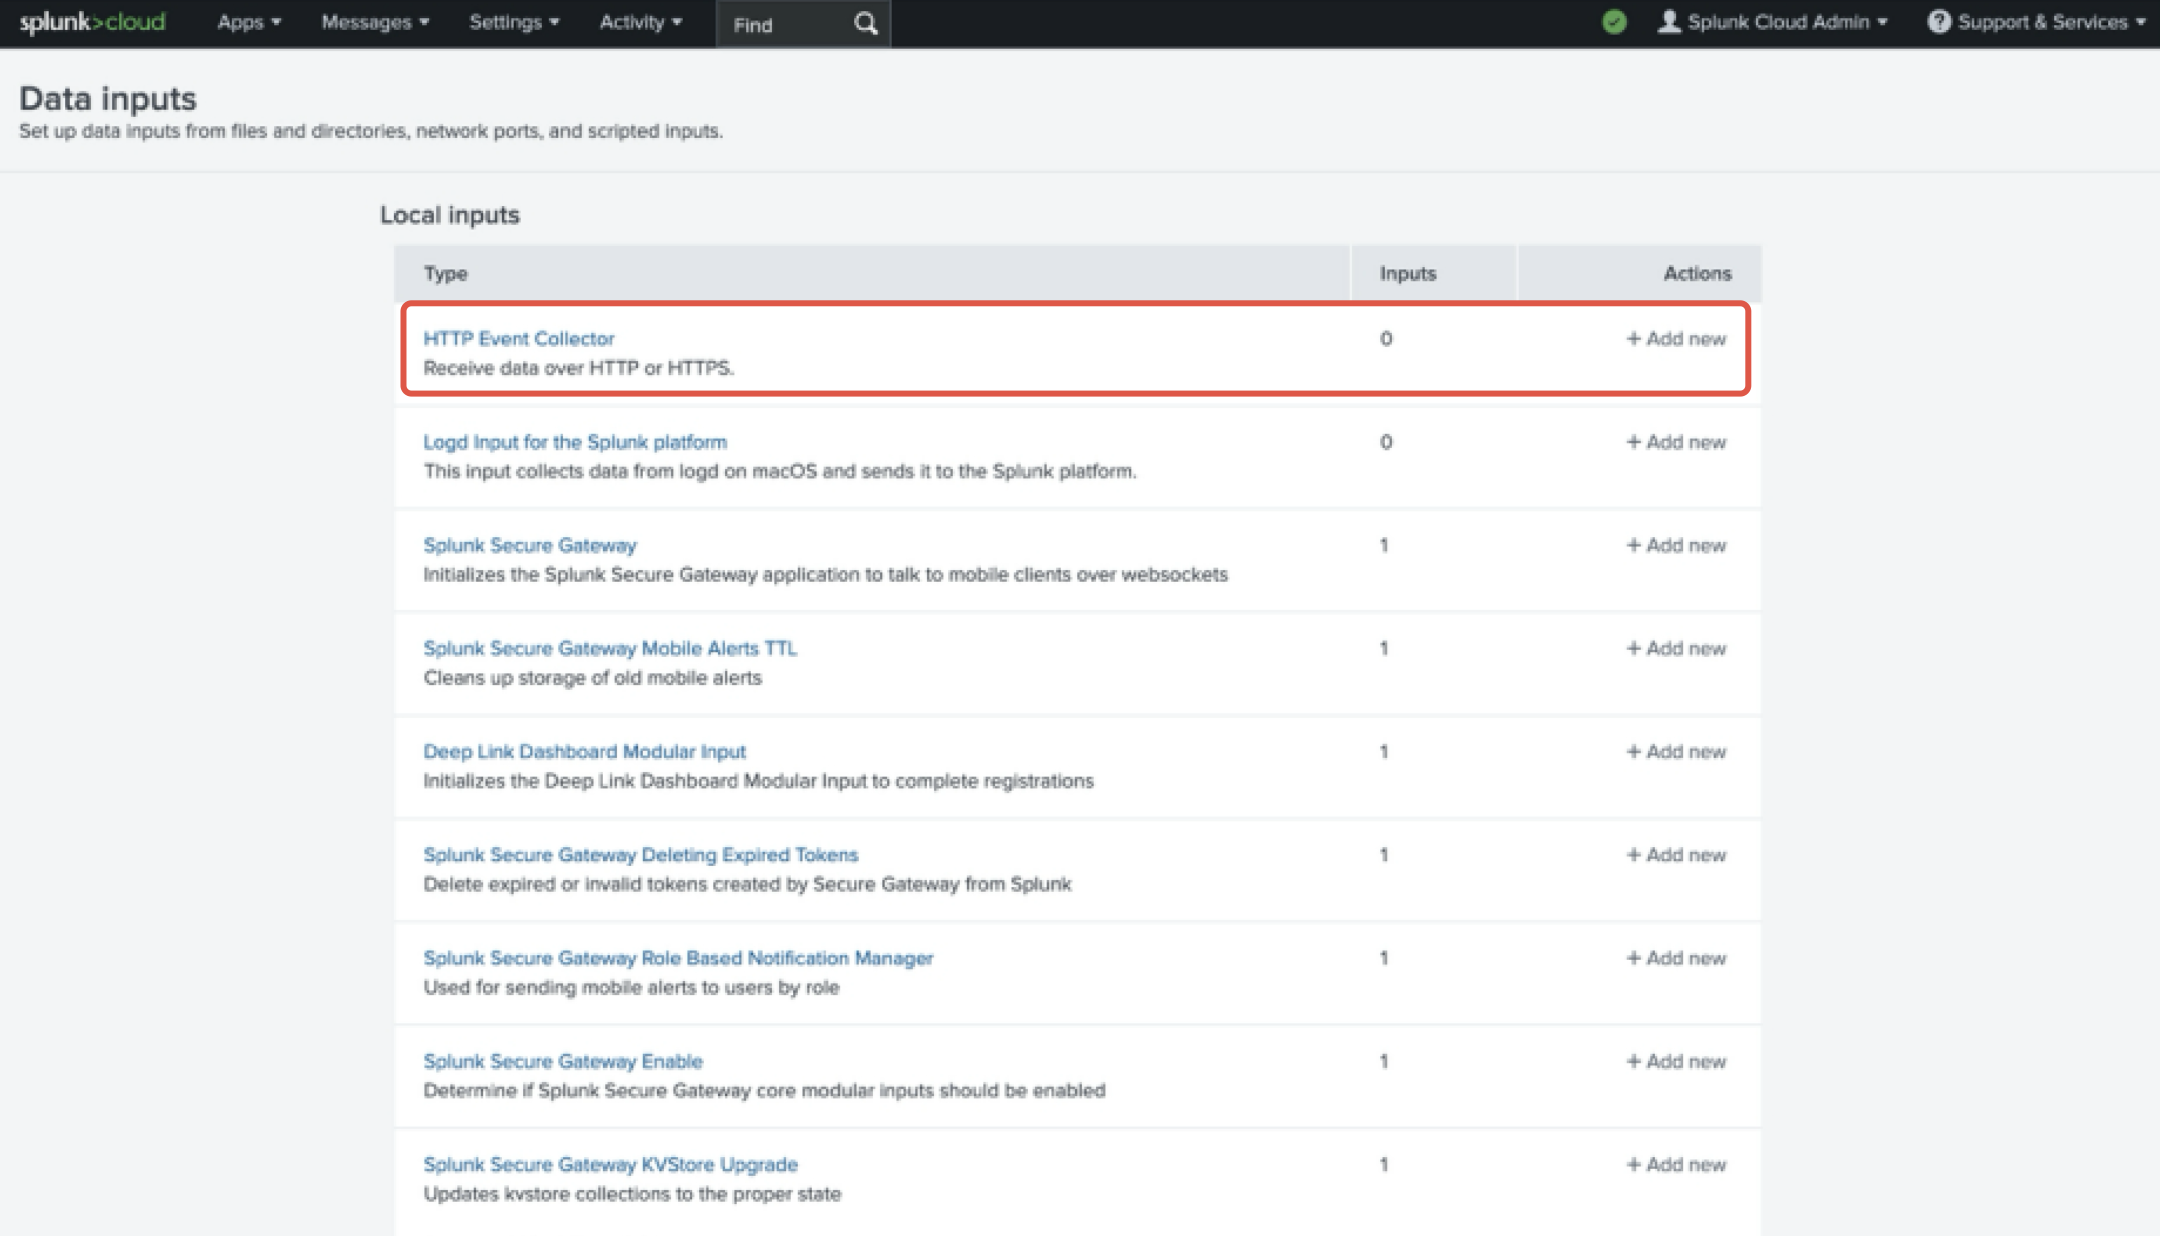
3. Go to the Settings > Data Inputs webpage and select HTTP Event Collector (HEC).
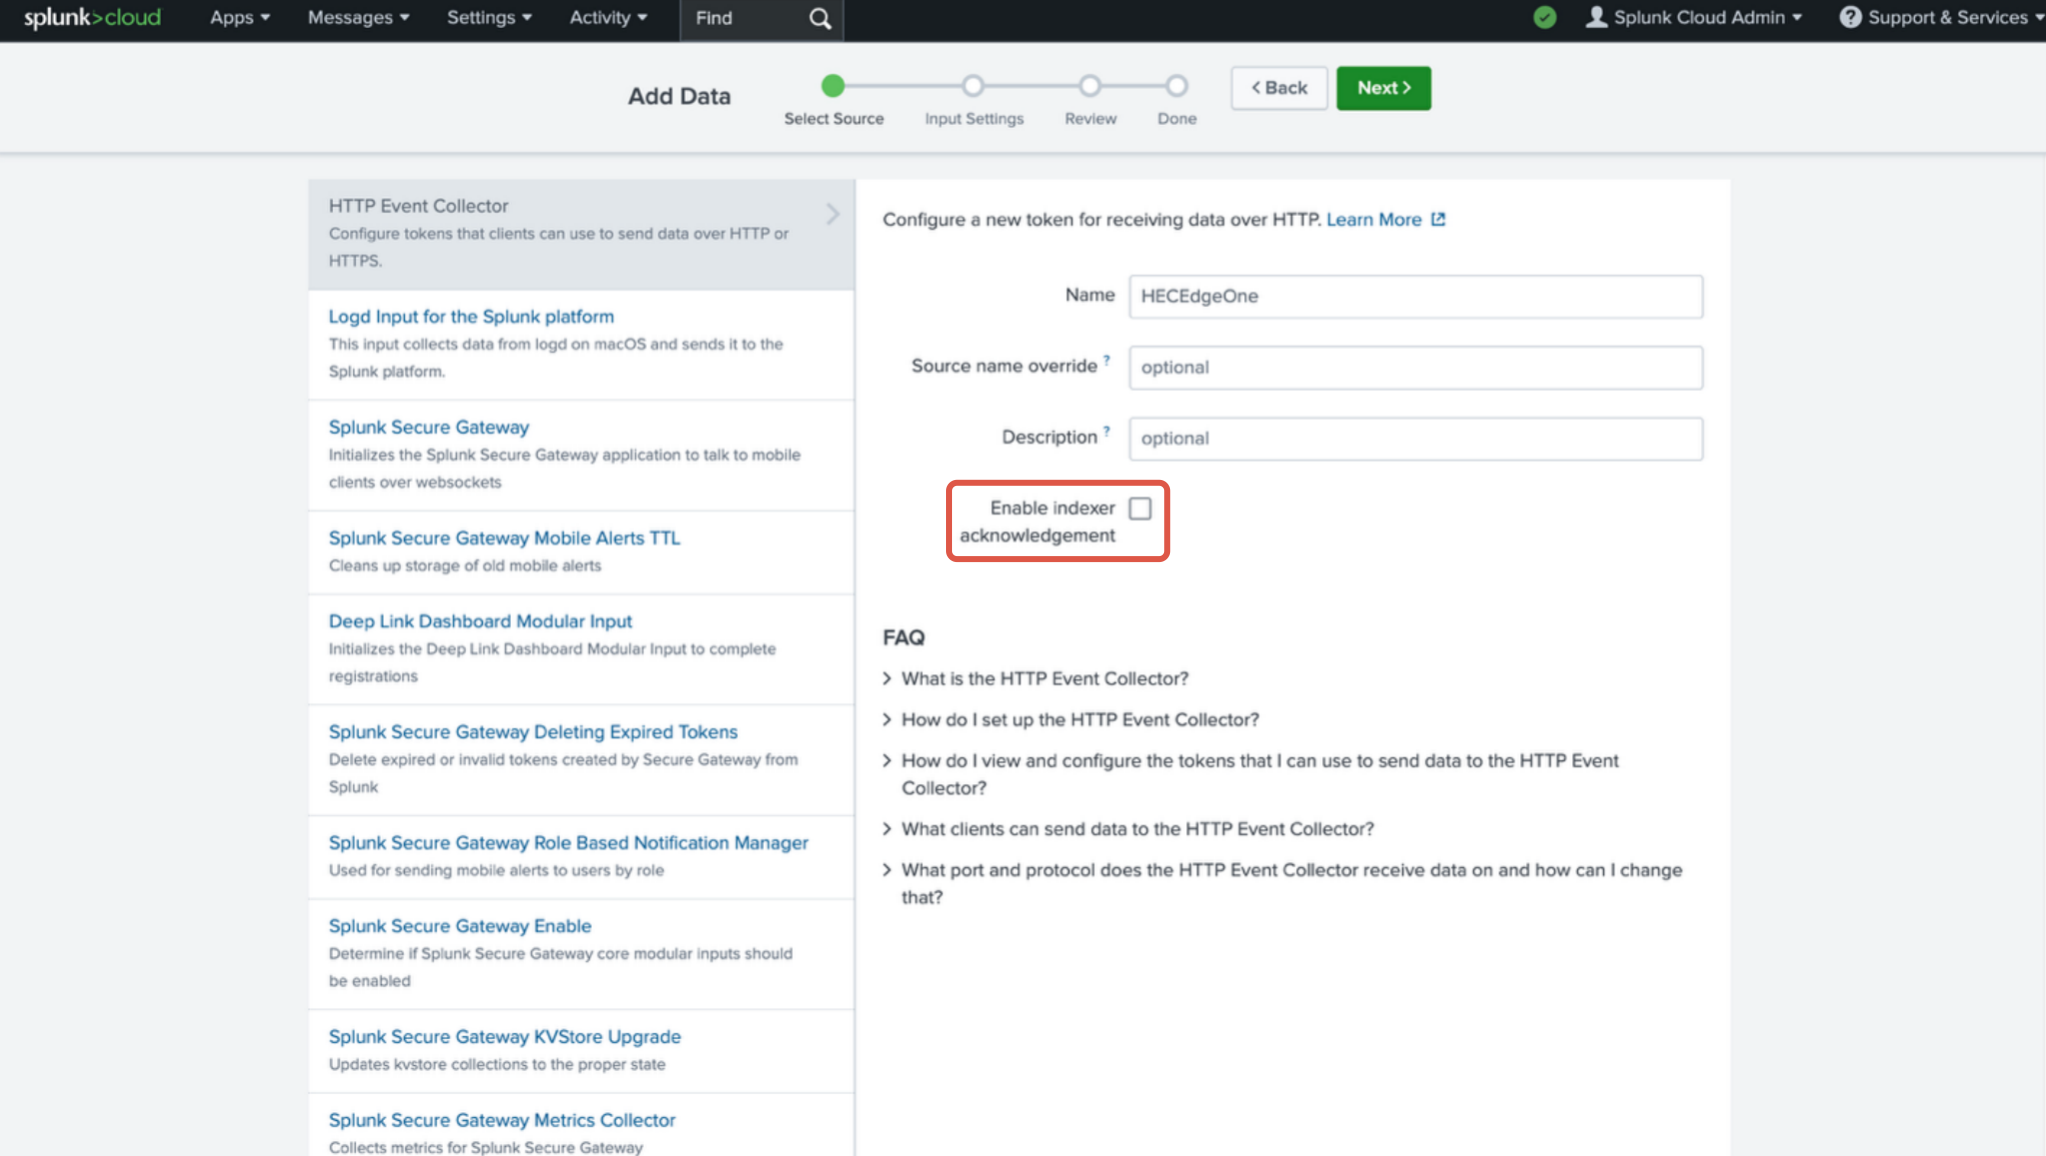
4. Create a new Token (example: HECEdgeOne) with the following setting method:
Enable event receipt: Check Enable.
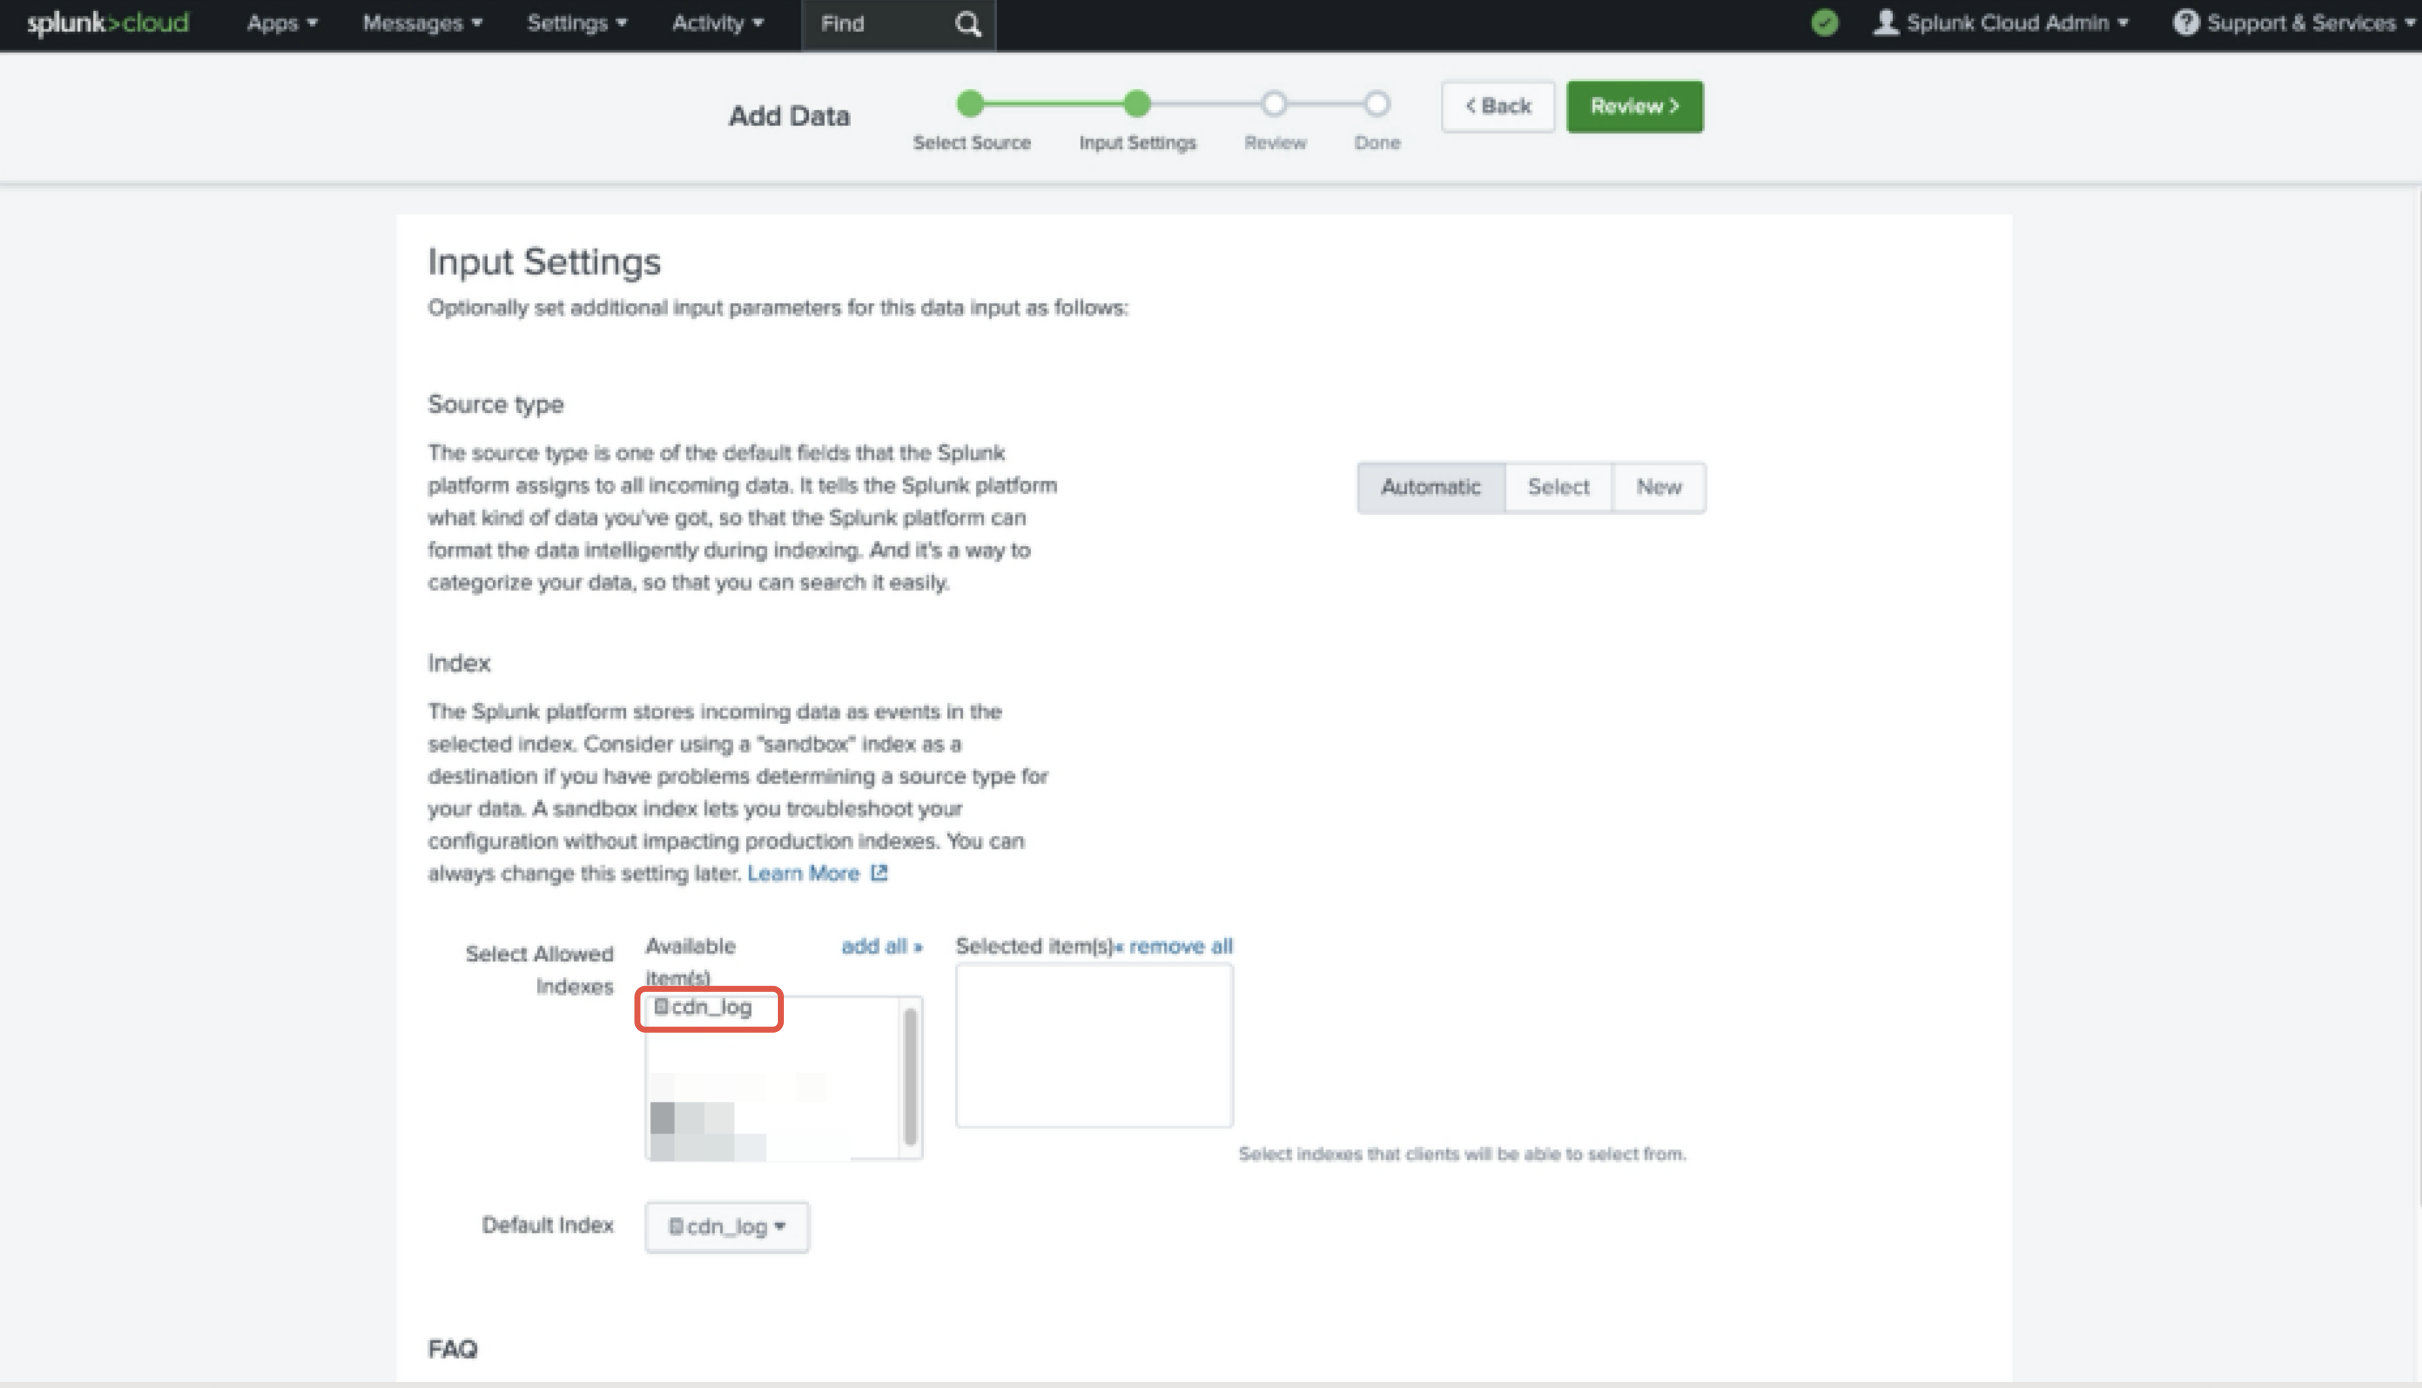
Default index: Select a previously created index, such as cdn_log.
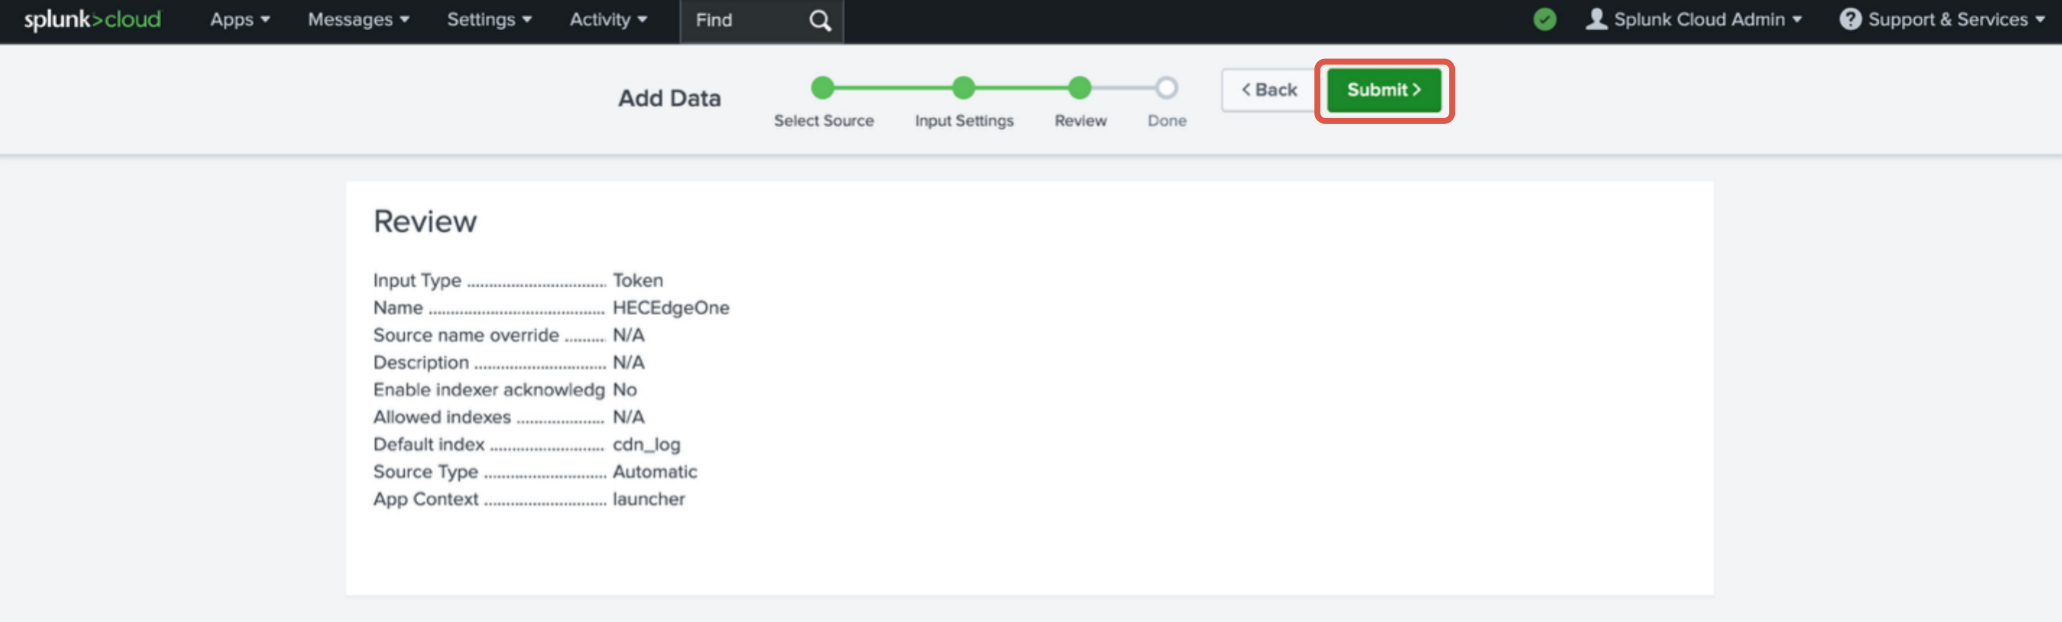
Preview the configuration, then click Submit.
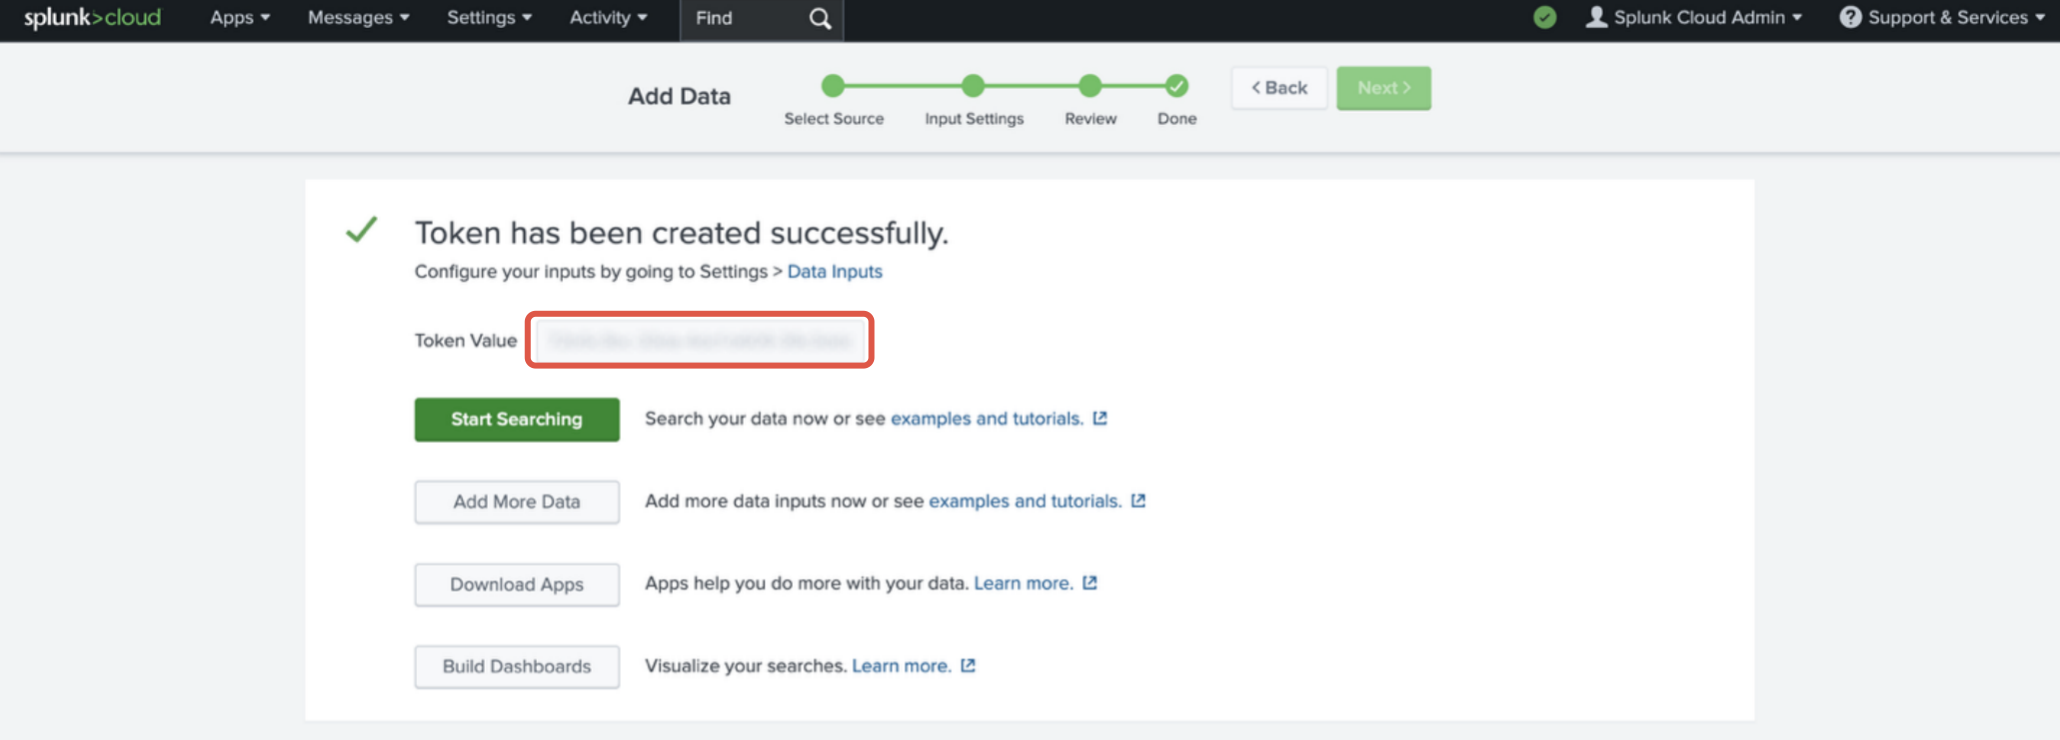
Record the token value of the generated Splunk HTTP event collector, which will be used as an authentication credential in subsequent configuration.
Configuring EdgeOne Real-Time Log Push
Refer to Push to HTTP Server to configure a real-time log push task in EdgeOne. Below are the configuration instructions for the Splunk destination information:
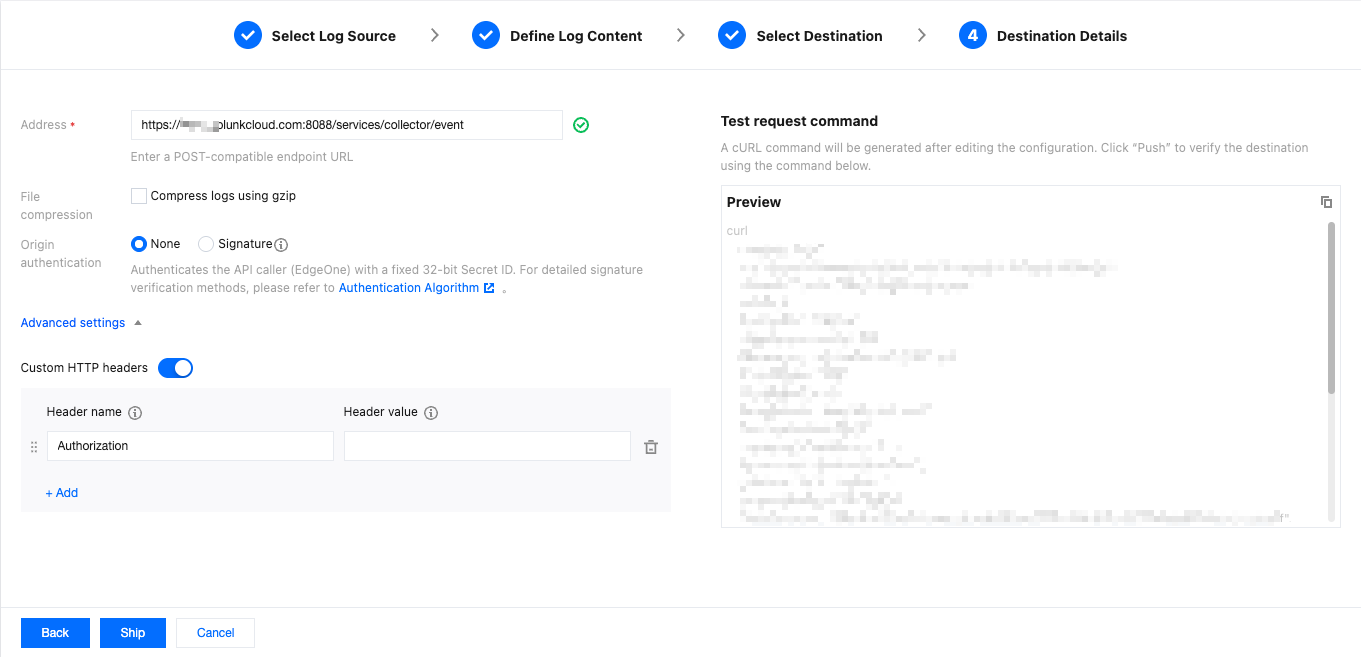
1. On the destination information page, fill in the destination and parameter information.
API address: Please check your Splunk HTTP event collector endpoint. For example, https://example.splunkcloud.com:8088/services/collector/event;
Content compression: To reduce log Content size and save traffic overhead, you can enable Content compression by selecting gzip to compress log files. EdgeOne will use gzip format to compress logs before transmission and add the HTTP header Content-Encoding: gzip to indicate the compression format.
3. To verify API connectivity during the configuration phase of a real-time log push task, test data will be sent to the API address. For details, see Push to HTTP Server.
Verification
View whether EdgeOne real-time logs are successfully delivered in the Splunk Resource Explorer.
1. Log in to the Splunk console.
2. Click Apps > Search & Reporting.
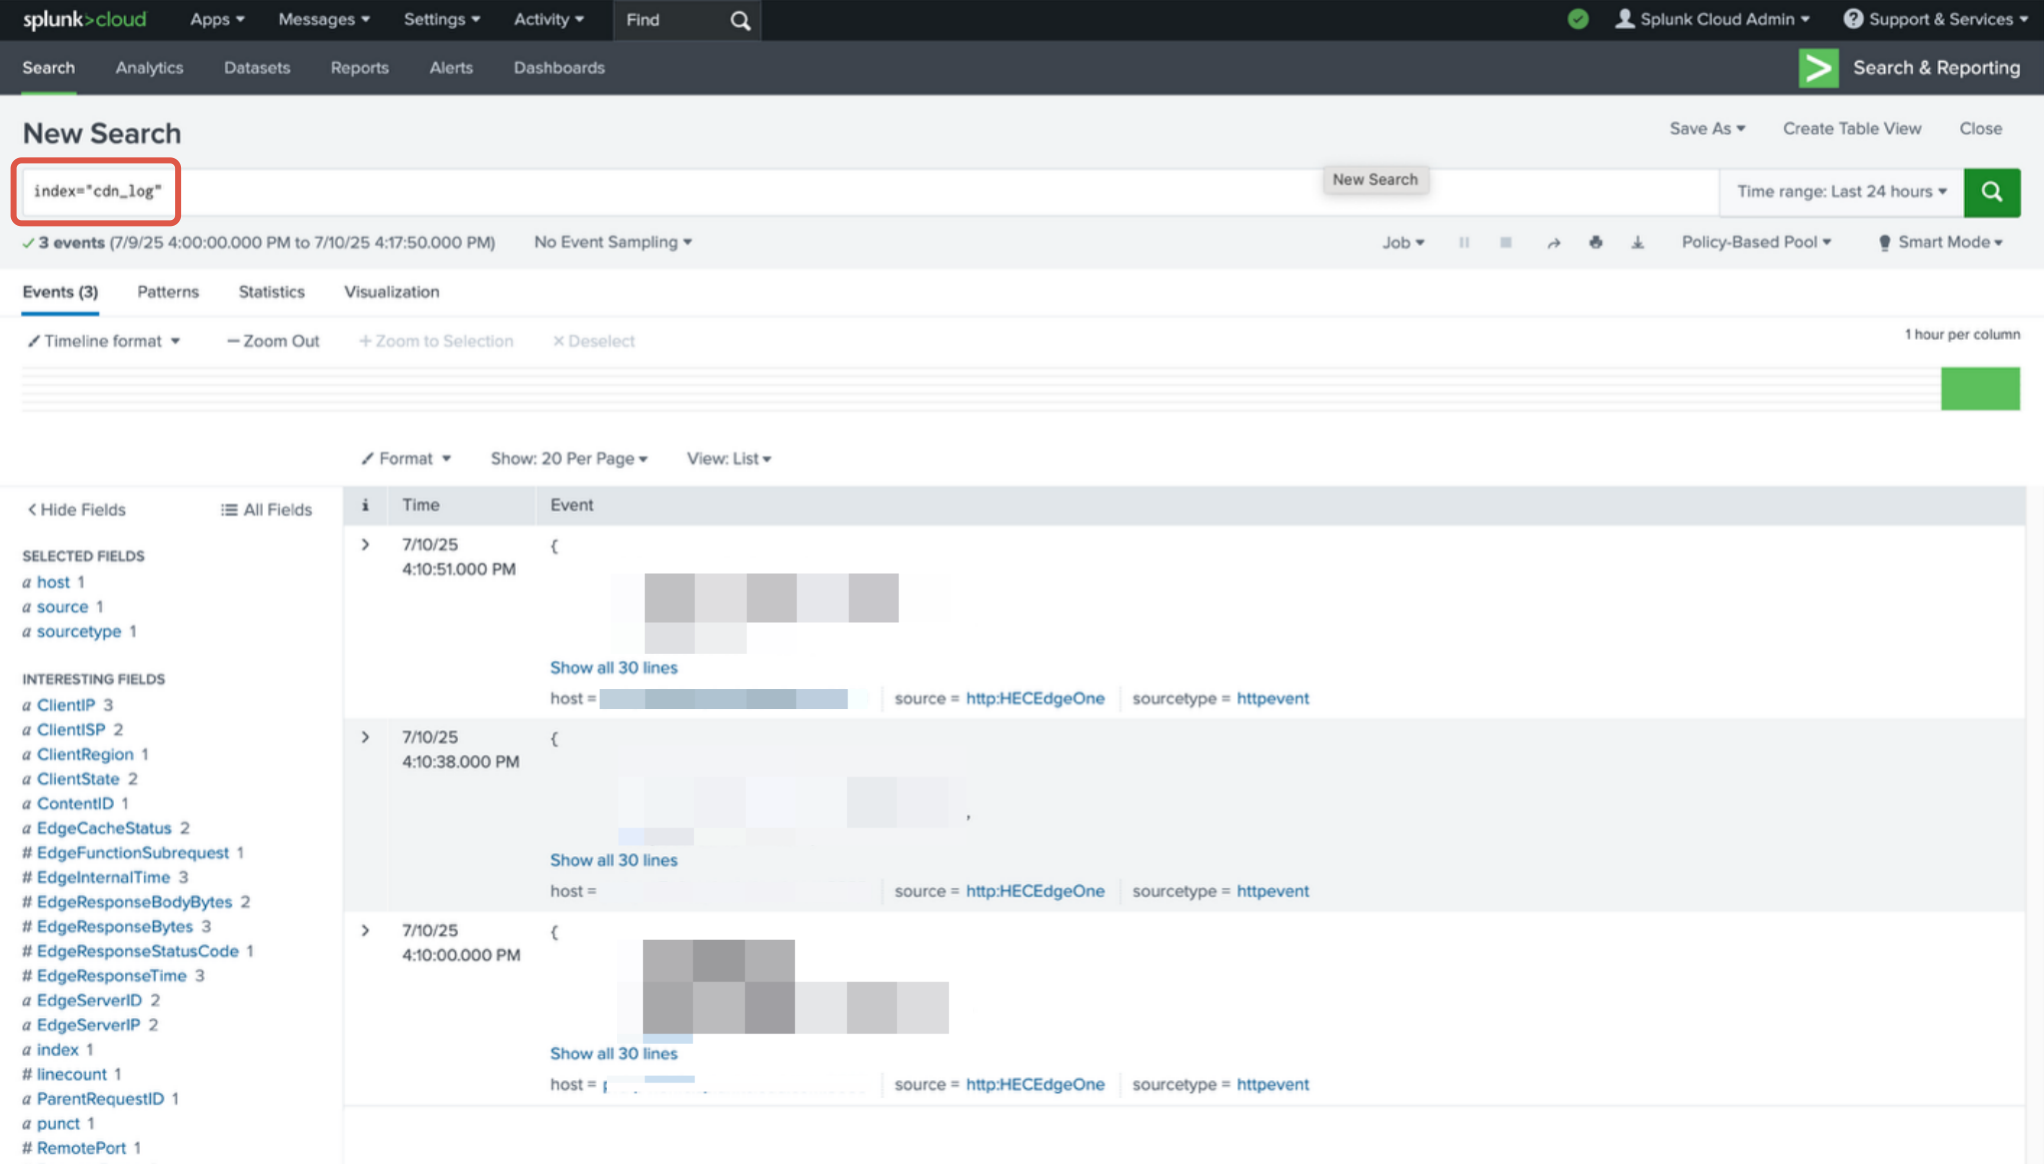
3. Enter index="cdn_log" in the Splunk search criteria.
4. View the real-time log content pushed by EdgeOne.