Release Notes
Announcements
Configuration Item | Description |
Chart Name | Set the display name of the table, which can be left empty. |
Legend | Set the chart legends. You can control the legend styles and positions and add comparison data to legends. |
Tooltip | Control the content style of the bubble tip displayed when the mouse is hovered over. |
Unit |
Configuration Item | Description |
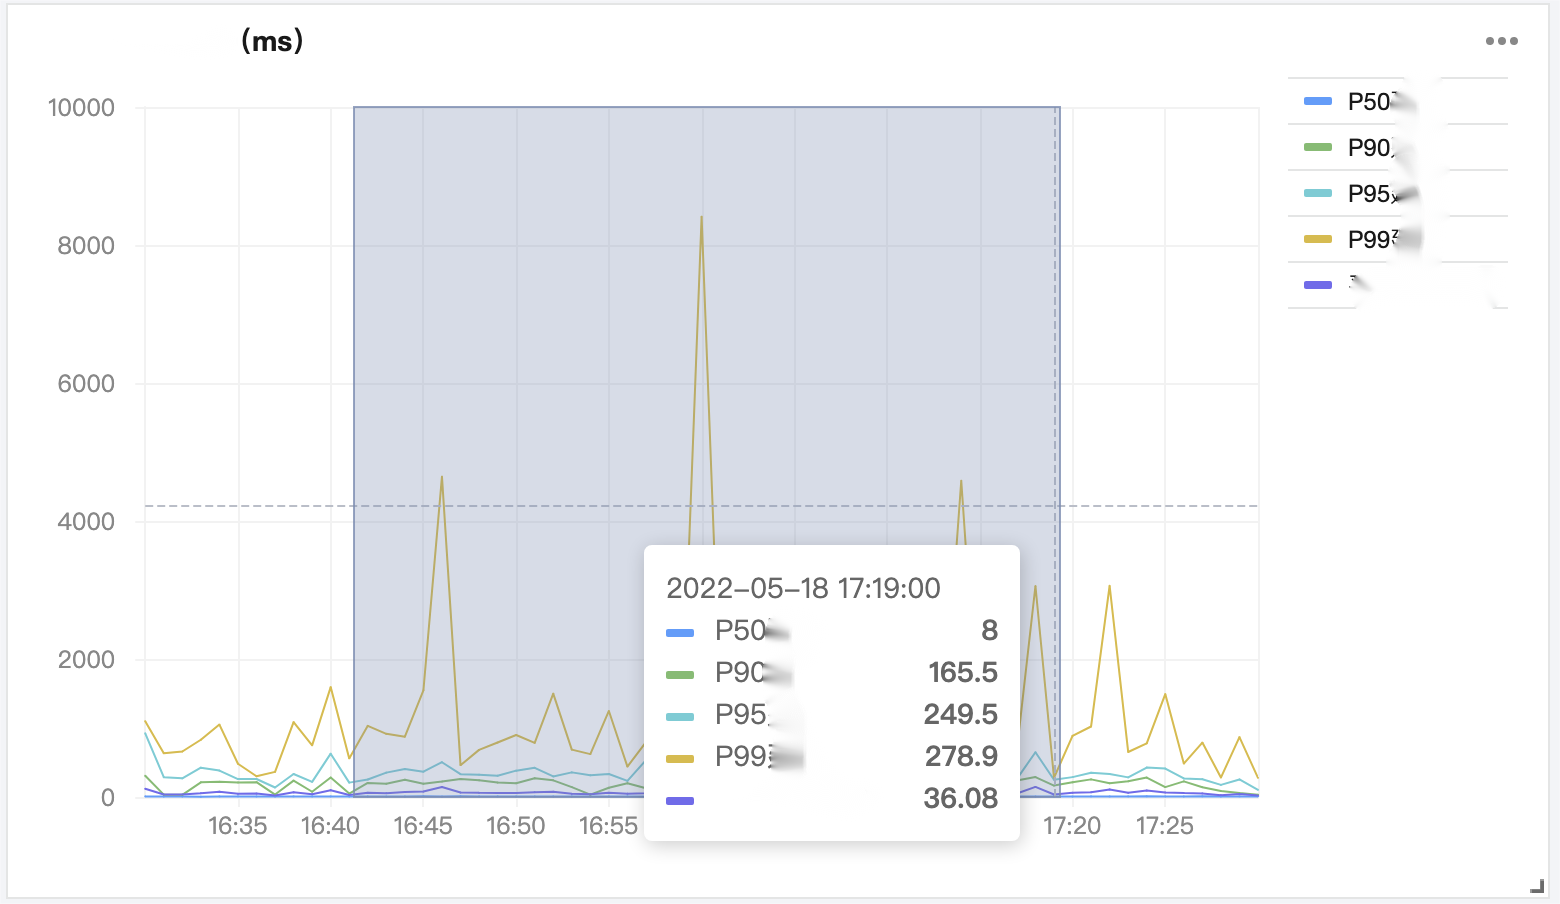
Changes | After the changes feature is enabled, you can compare the data in a time period with the data in the same period X hours, days, months, or years ago. The comparison data is displayed as dotted lines in the chart. |
Configuration Item | Description |
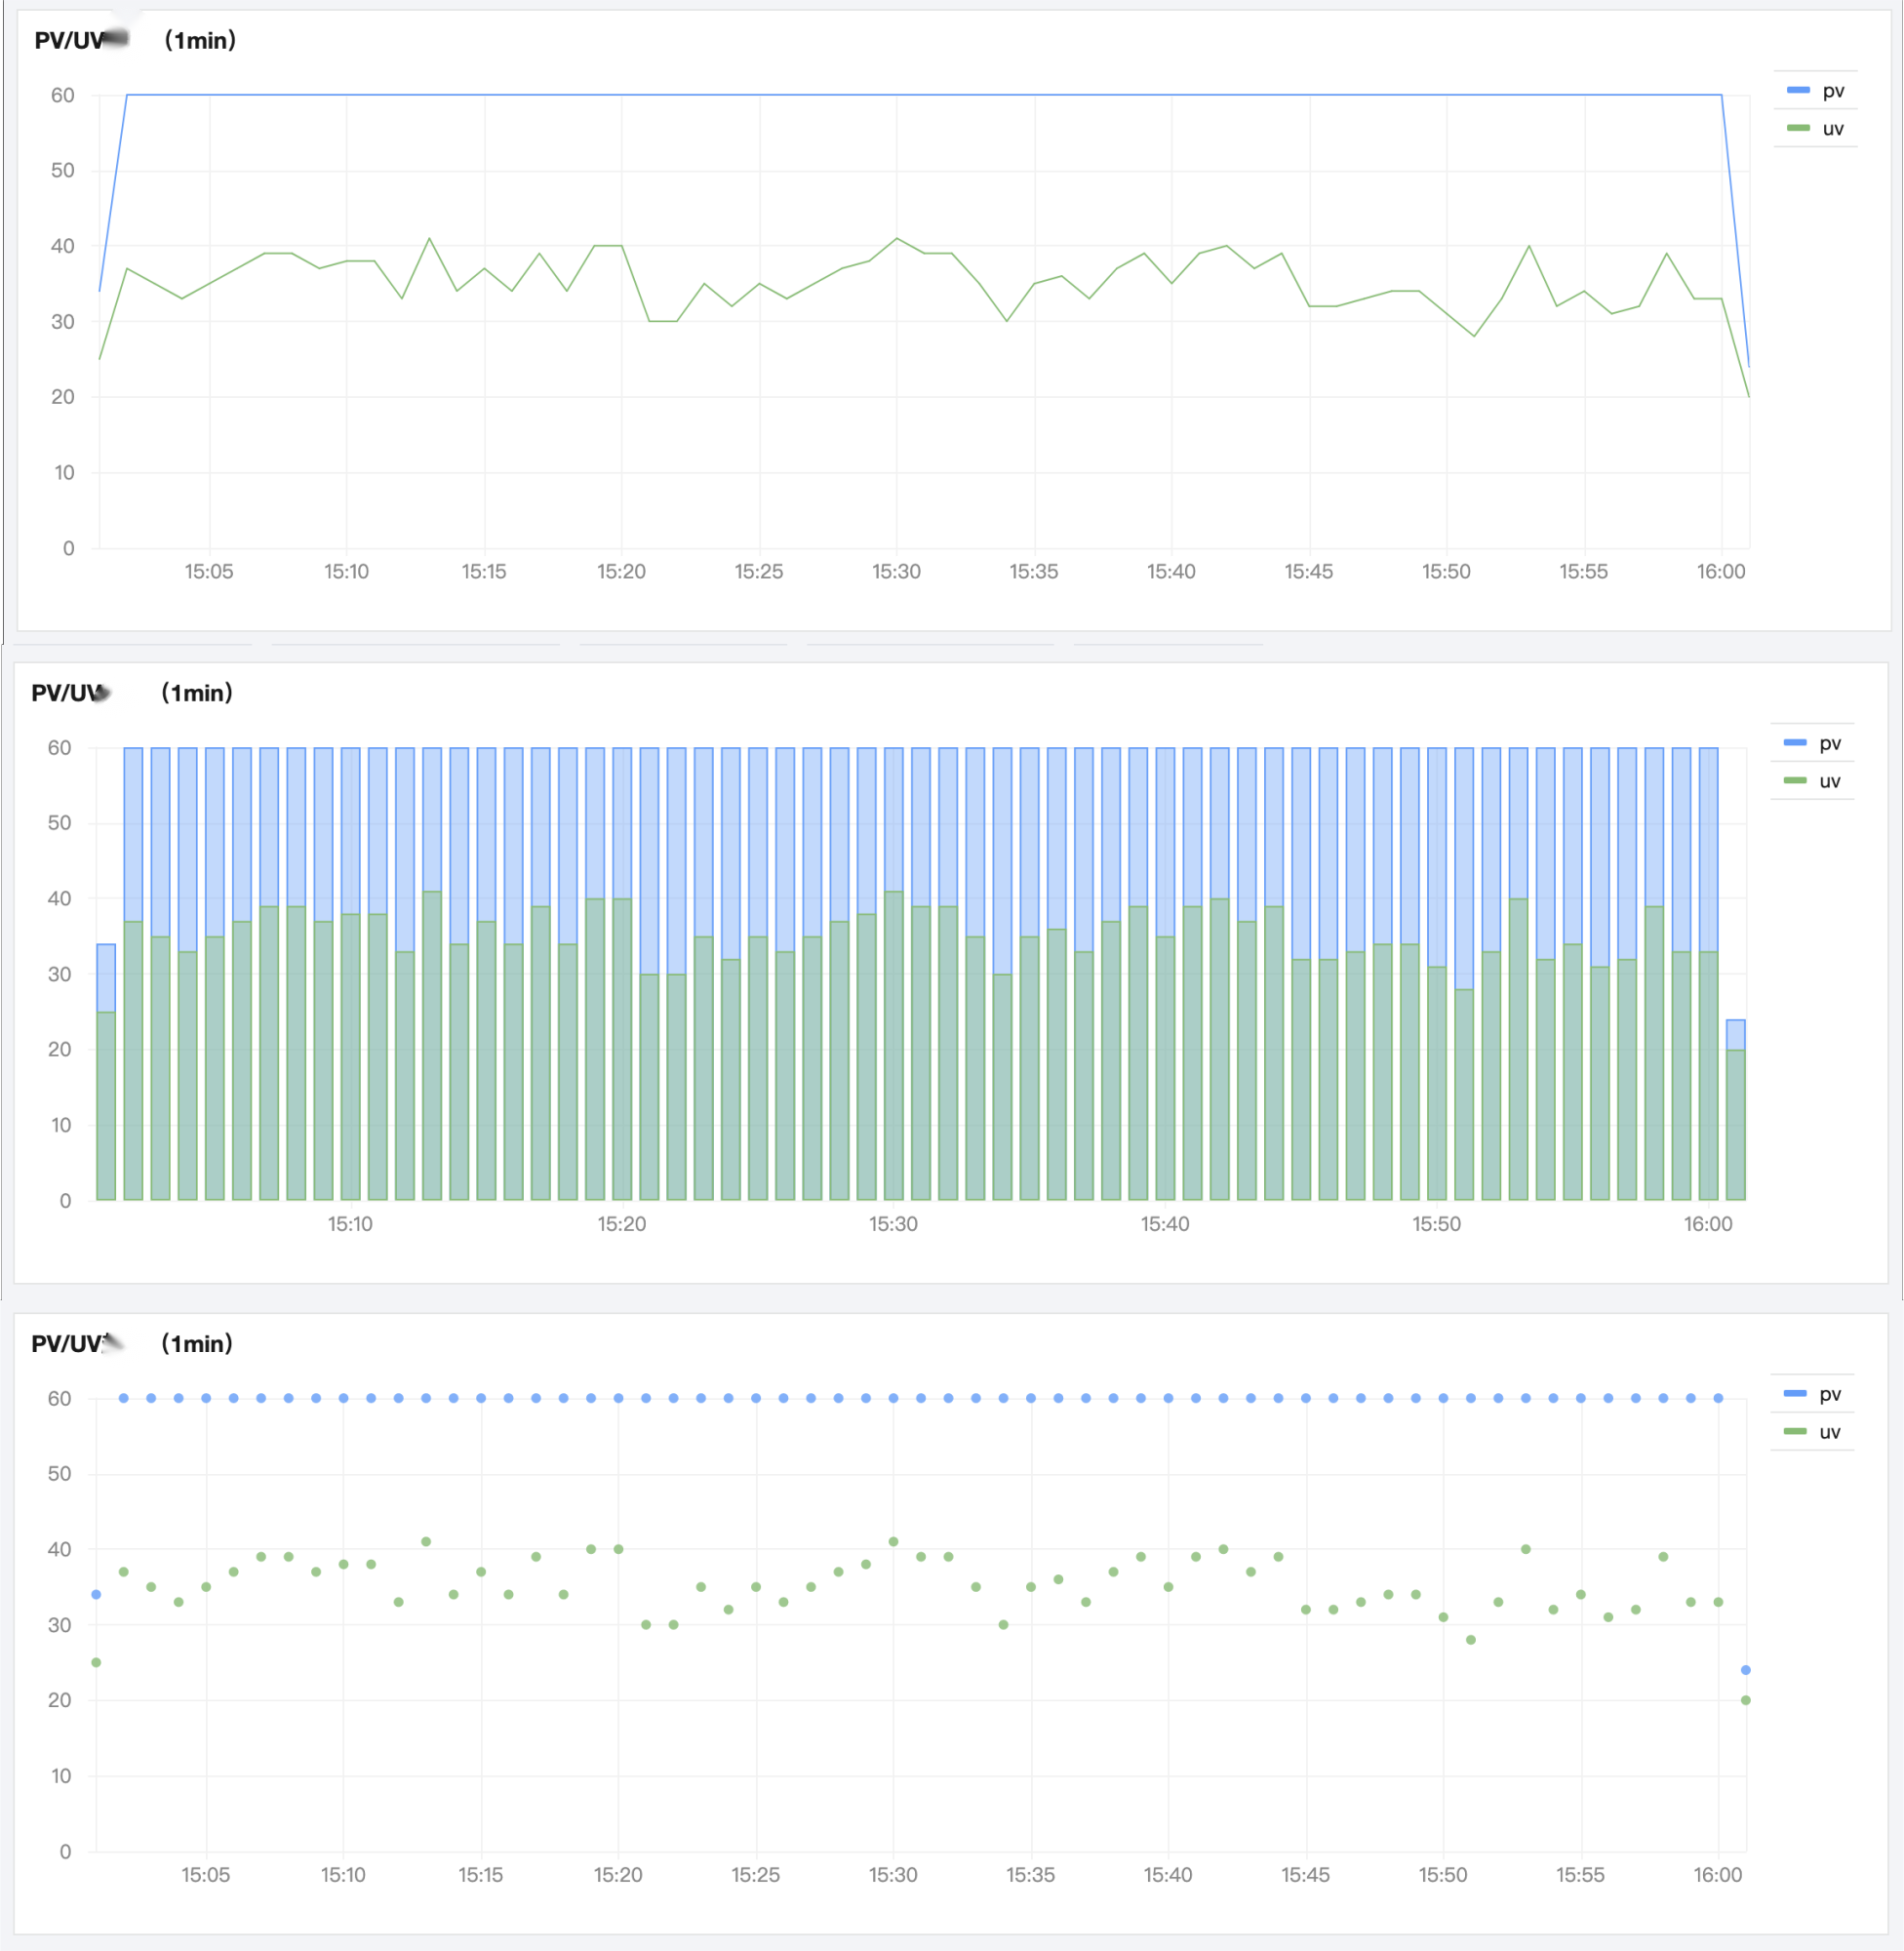
Sequence diagram | Drawing Style: Set the display style of data on coordinate axes. If you select a line, column, or dot, it will be a line chart, histogram, or scatter plot respectively. Linear: Set whether to smooth the connections between points. Line Width: Control the thickness of lines. Fill: Control the transparency of the fill area. If this value is 0, there will be no fill. Display Point: Display data points. If there is no data, no points will be displayed. Null: Control the processing of a sequence point if there is no data on the point. This value is 0 by default. Stack: Control whether to display data in a stack. |
Axes | Show: Show/Hide axes. MAX/MIN: Control the maximum and minimum values displayed on coordinate axes. Coordinate areas greater than the maximum value or smaller than the minimum value will not be displayed. |


Configuration Item | Description |
Threshold configuration | Threshold Point: Set the threshold points. You can add multiple threshold intervals. You can click a threshold color to open the color picker to customize the color. Threshold Display: Control the style of threshold display, including three modes: threshold line, area filling, and both. If this option is disabled, no threshold will be used. |
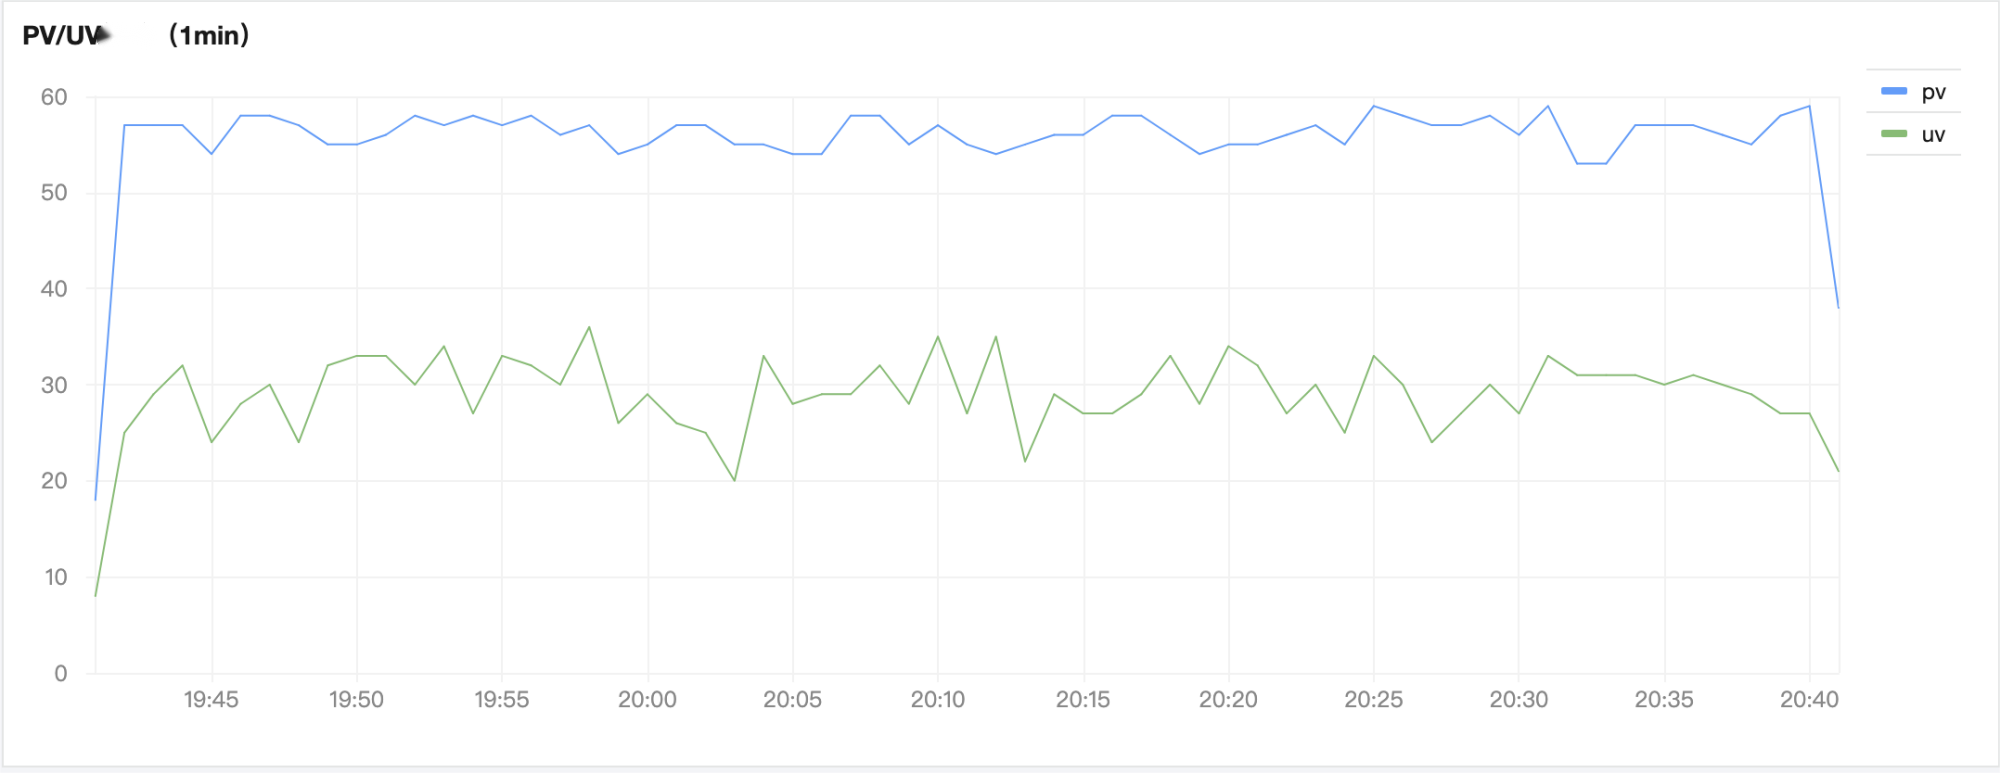
* | select histogram( cast(__TIMESTAMP__ as timestamp),interval 1 minute) as time, count(*) as pv,count( distinct remote_addr) as uv group by time order by time desc limit 10000
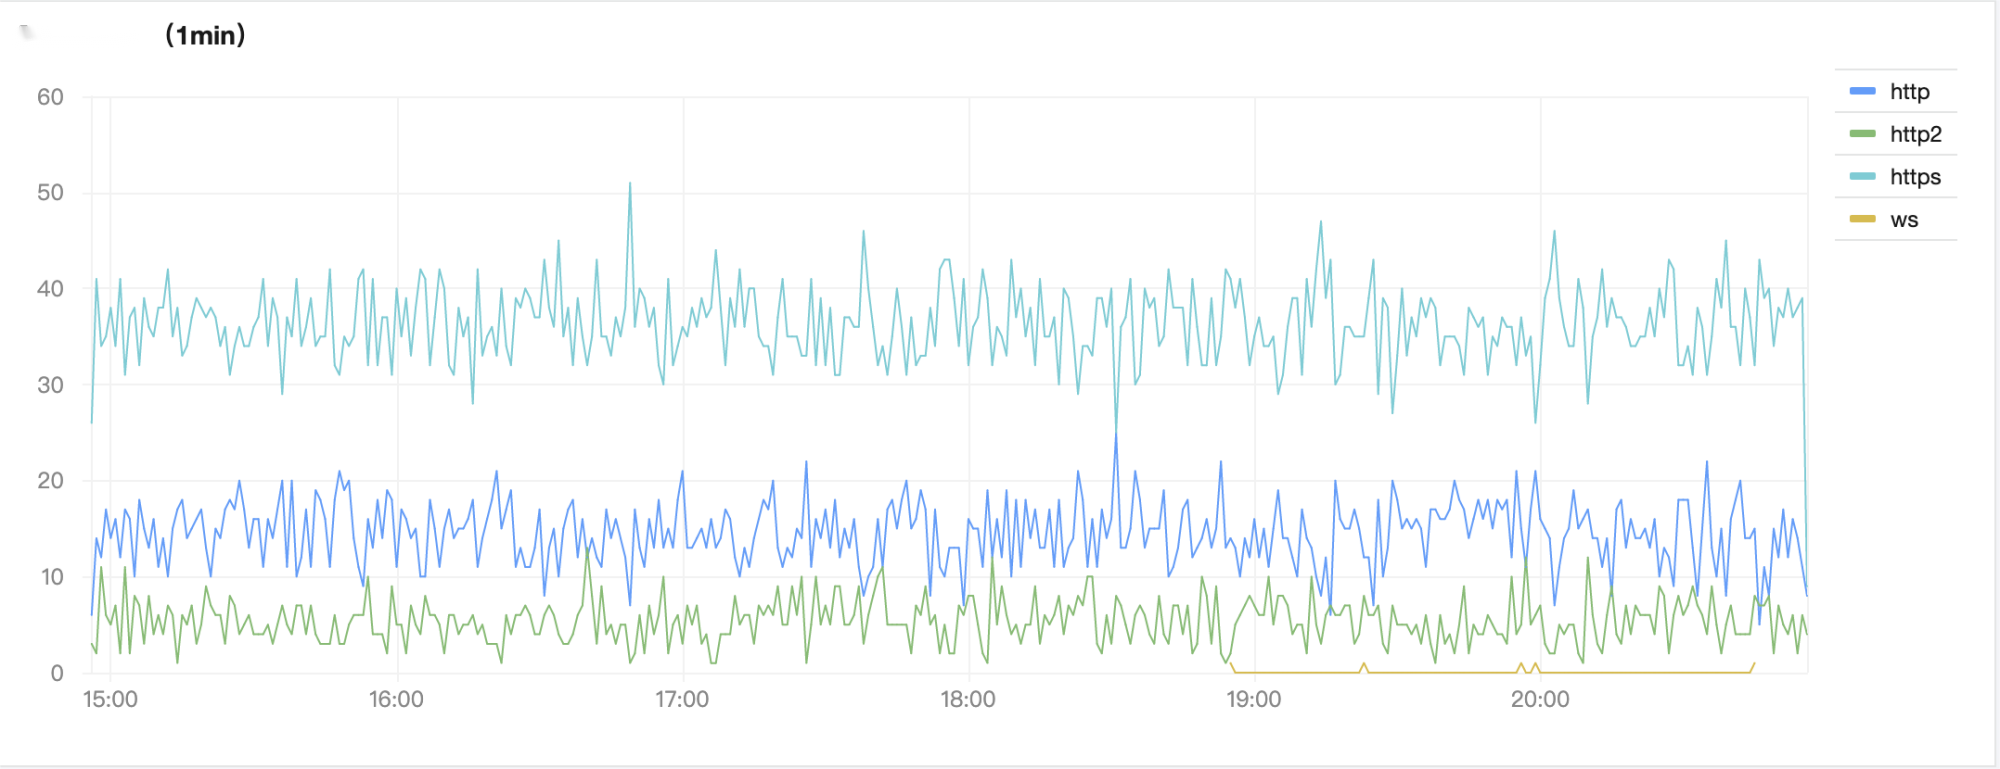
* | select histogram( cast(__TIMESTAMP__ as timestamp),interval 1 minute) as time, protocol_type, count(*) as pv group by time, protocol_type order by time desc limit 10000
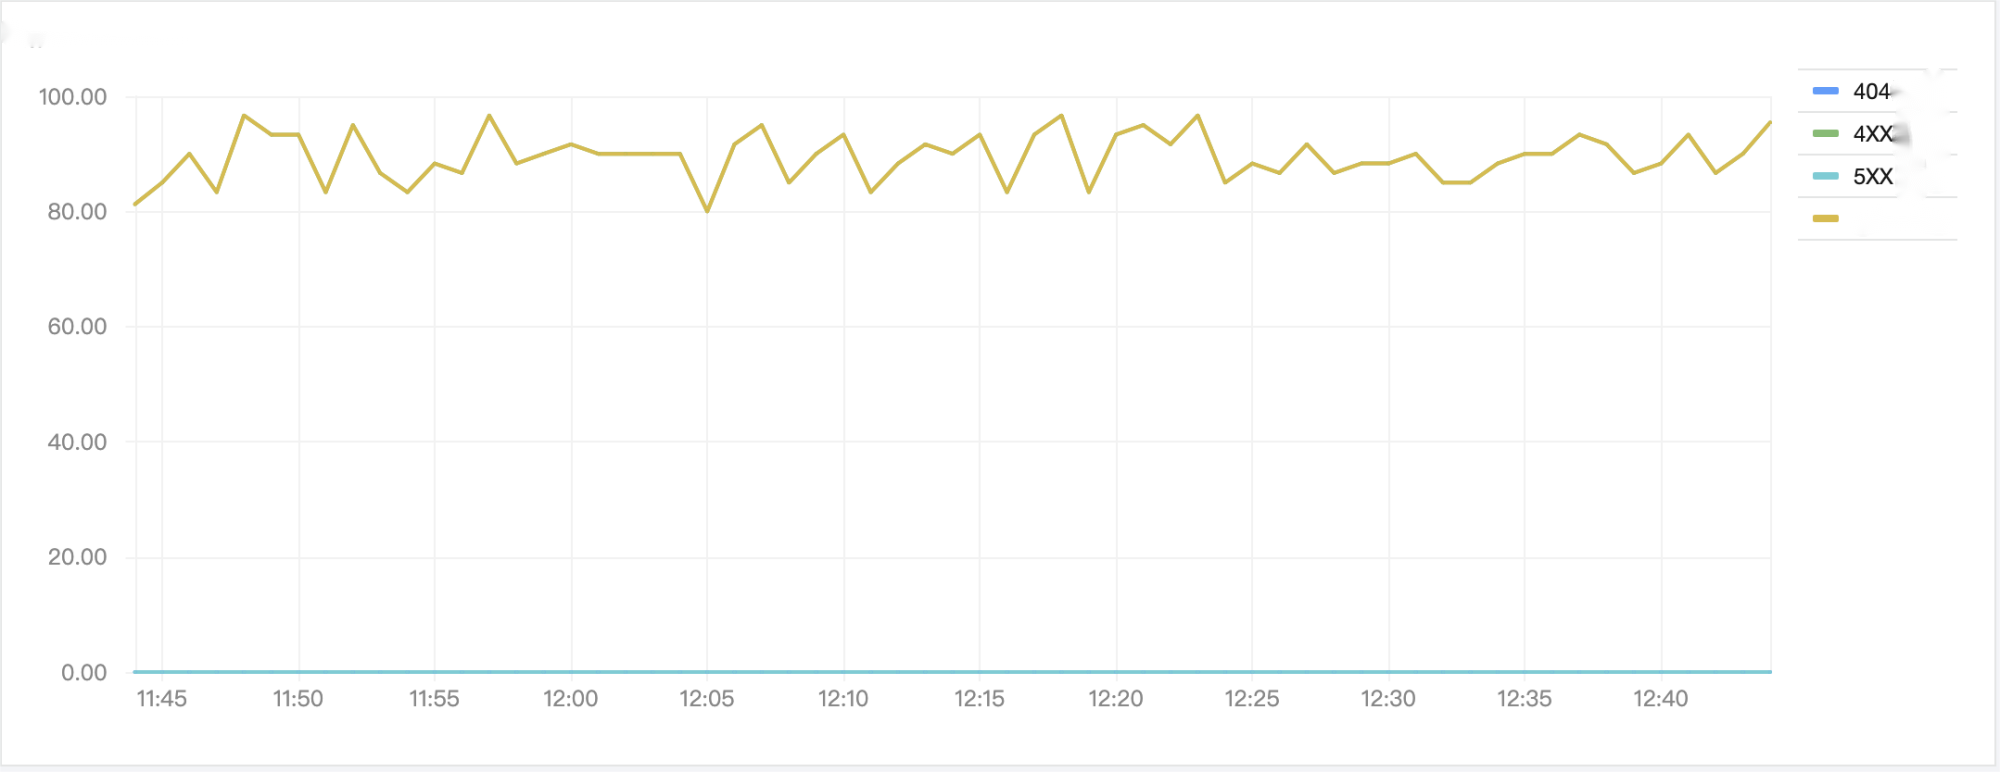
* | select date_trunc('minute', __TIMESTAMP__) as time, round(sum(case when status = 404 then 1.00 else 0.00 end)/ cast(count(*) as double)*100,3) as "404 proportion", round(sum(case when status >= 500 then 1.00 else 0.00 end)/cast(count(*) as double)*100,3) as "5XX proportion", round(sum(case when status >= 400 and status < 500 then 1.00 else 0.00 end)/cast(count(*) as double)*100,3) as "4XX proportion", round(sum(case when status >= 400 then 1.00 else 0.00 end)/cast(count(*) as double)*100,3) as "total failure rate" group by time order by time limit 10000
Was this page helpful?
You can also Contact sales or Submit a Ticket for help.
Help us improve! Rate your documentation experience in 5 mins.
Feedback