Viewing Monitoring Metrics of Control Plane Components in a TKE Cluster
Download
Mode fokus
Ukuran font
Application Scenario
Tencent Kubernetes Engine (TKE) is a managed Kubernetes service. TKE automatically manages the availability and scalability of Kubernetes control plane nodes, which are responsible for scheduling containers, managing application availability, storing cluster data, and execute other critical tasks. However, the behavior or configuration of specific workloads may increase the load on the control plane, resulting in performance degradation. In such cases, accessing key control plane metrics and monitoring charts enables cluster administrators to quickly detect and solve issues of workloads running on a cluster. For example, worker nodes with insufficient resources may affect Pod scheduling of the scheduler. To detect scheduling issues promptly, cluster administrators need to access scheduler metrics to view Pods pending processing and receive notifications in a timely manner. In addition, there are a large number of control plane metrics. Even experienced administrators face the challenge of selecting the proper monitoring metrics and creating valid monitoring charts.
TKE provides monitoring capabilities for cluster control plane components. It allows cluster administrators to view the performance of the Kubernetes cluster control plane and quickly detect, troubleshoot, and fix issues. TKE clusters provide monitoring charts through TencentCloud Managed Service for Prometheus (TMP).
Prerequisites
The monitoring component clustermonitor has been upgraded to 1.3.2 or a later version.
TMP has been enabled and associated with instances.
Directions
1. Log in to the TKE console, and click Cluster in the left sidebar.
2. Click the ID of the target cluster on the Cluster Management page to enter the cluster details page.
3. Click TMP in the left sidebar.
4. Enable TMP through one-click enable Prometheus monitoring or associating an existing TMP instance.
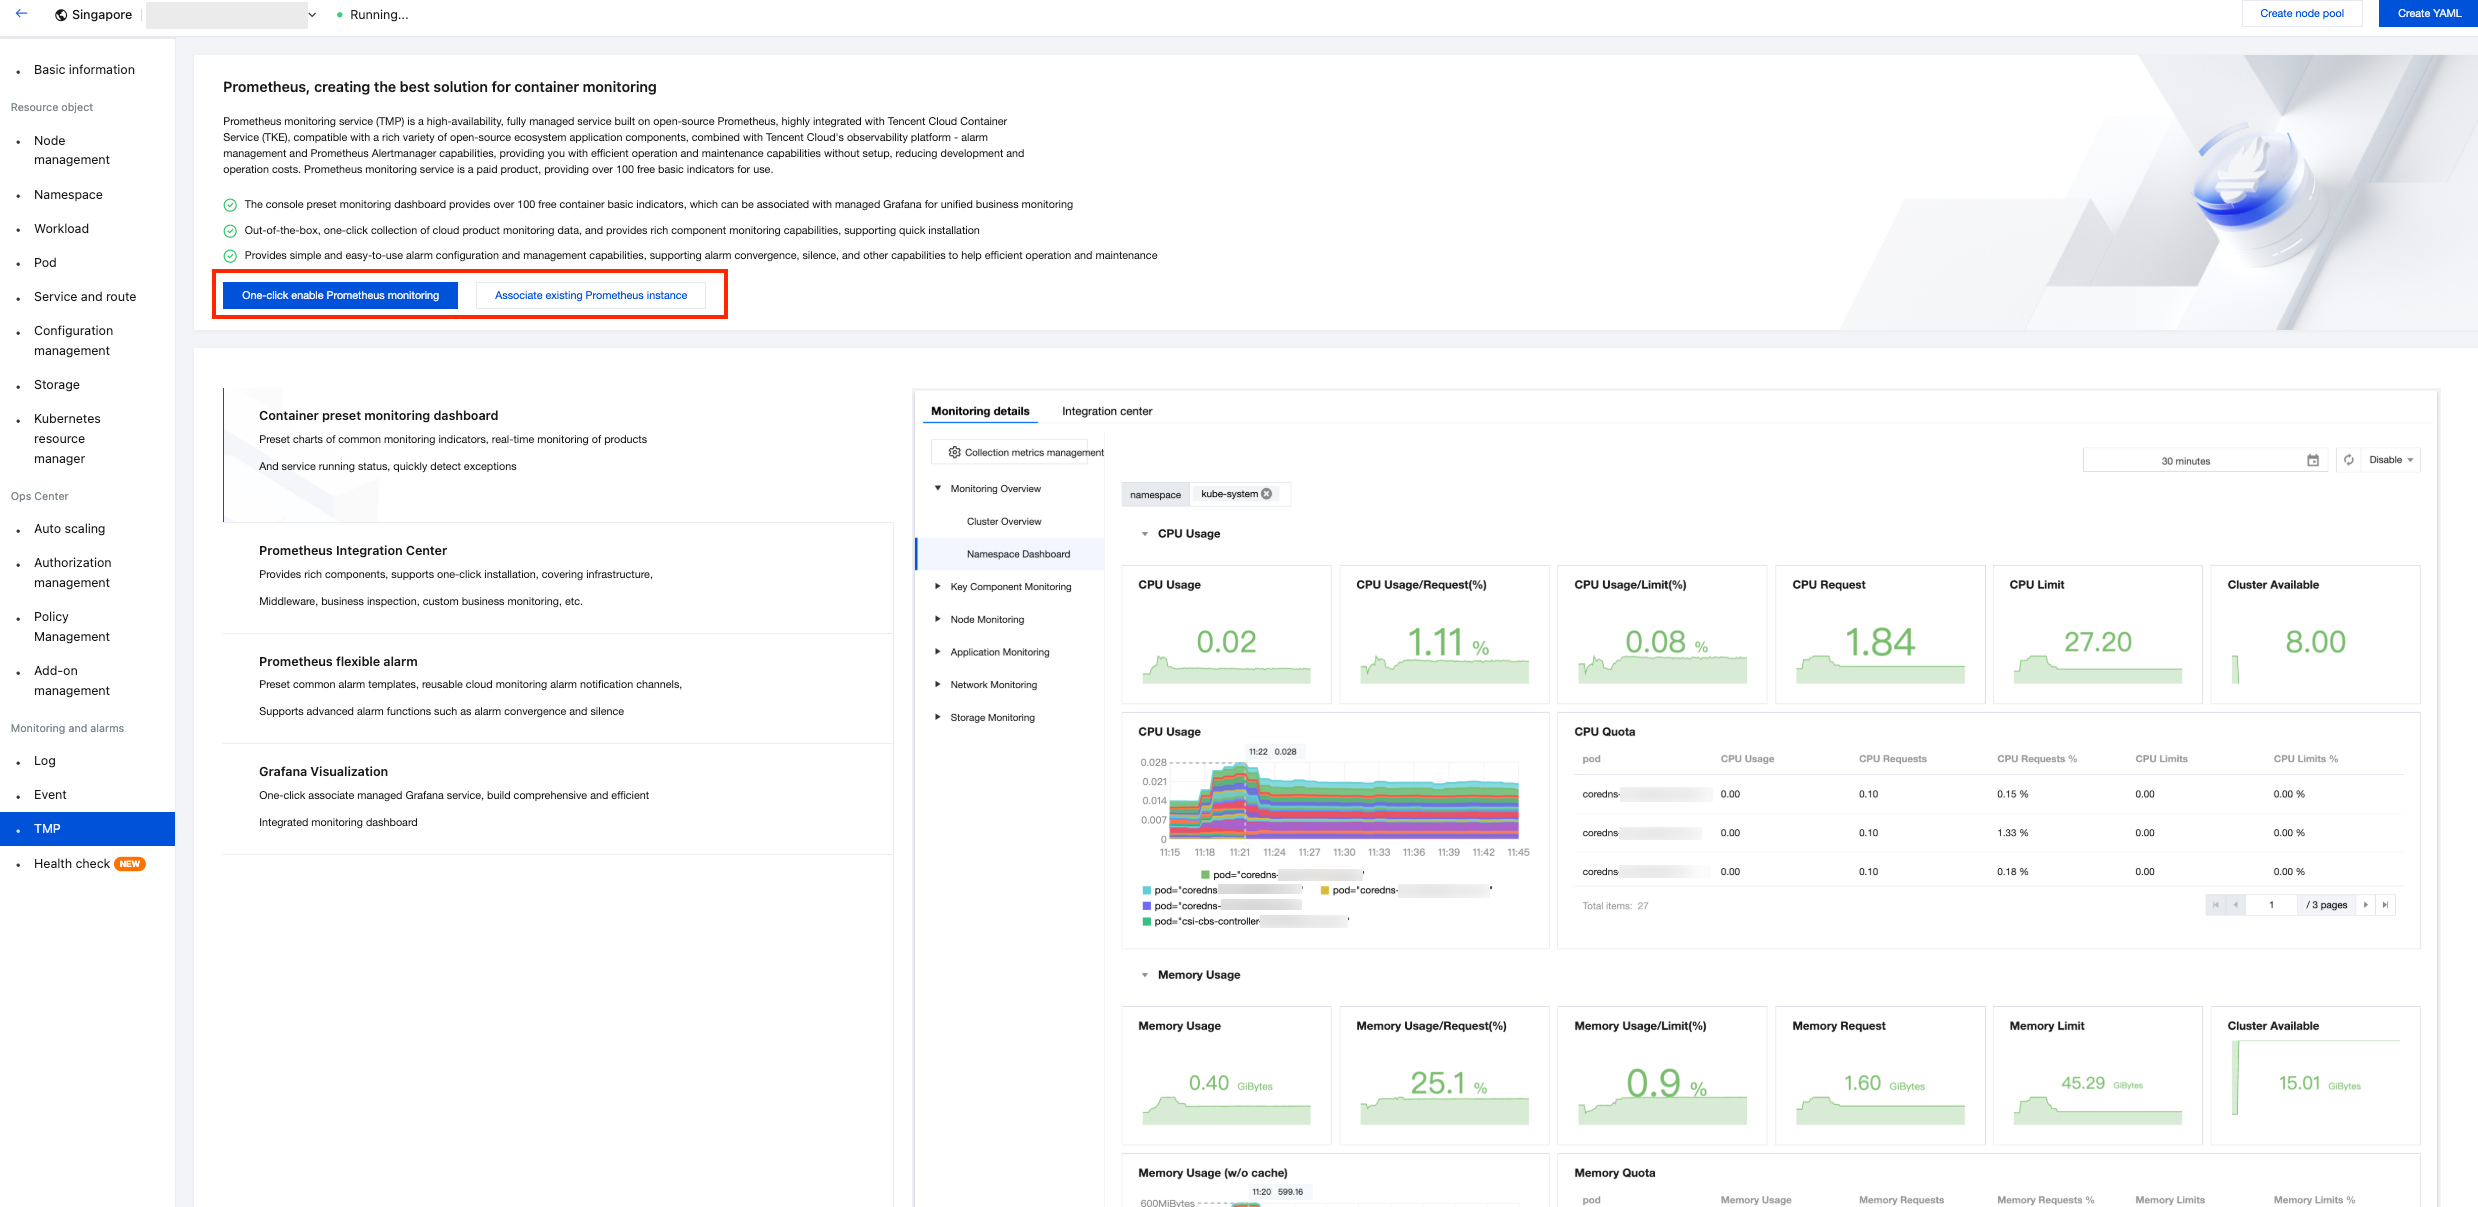
5. Click Monitoring Detail on the Prometheus Monitoring page, and click Core Component Monitoring.
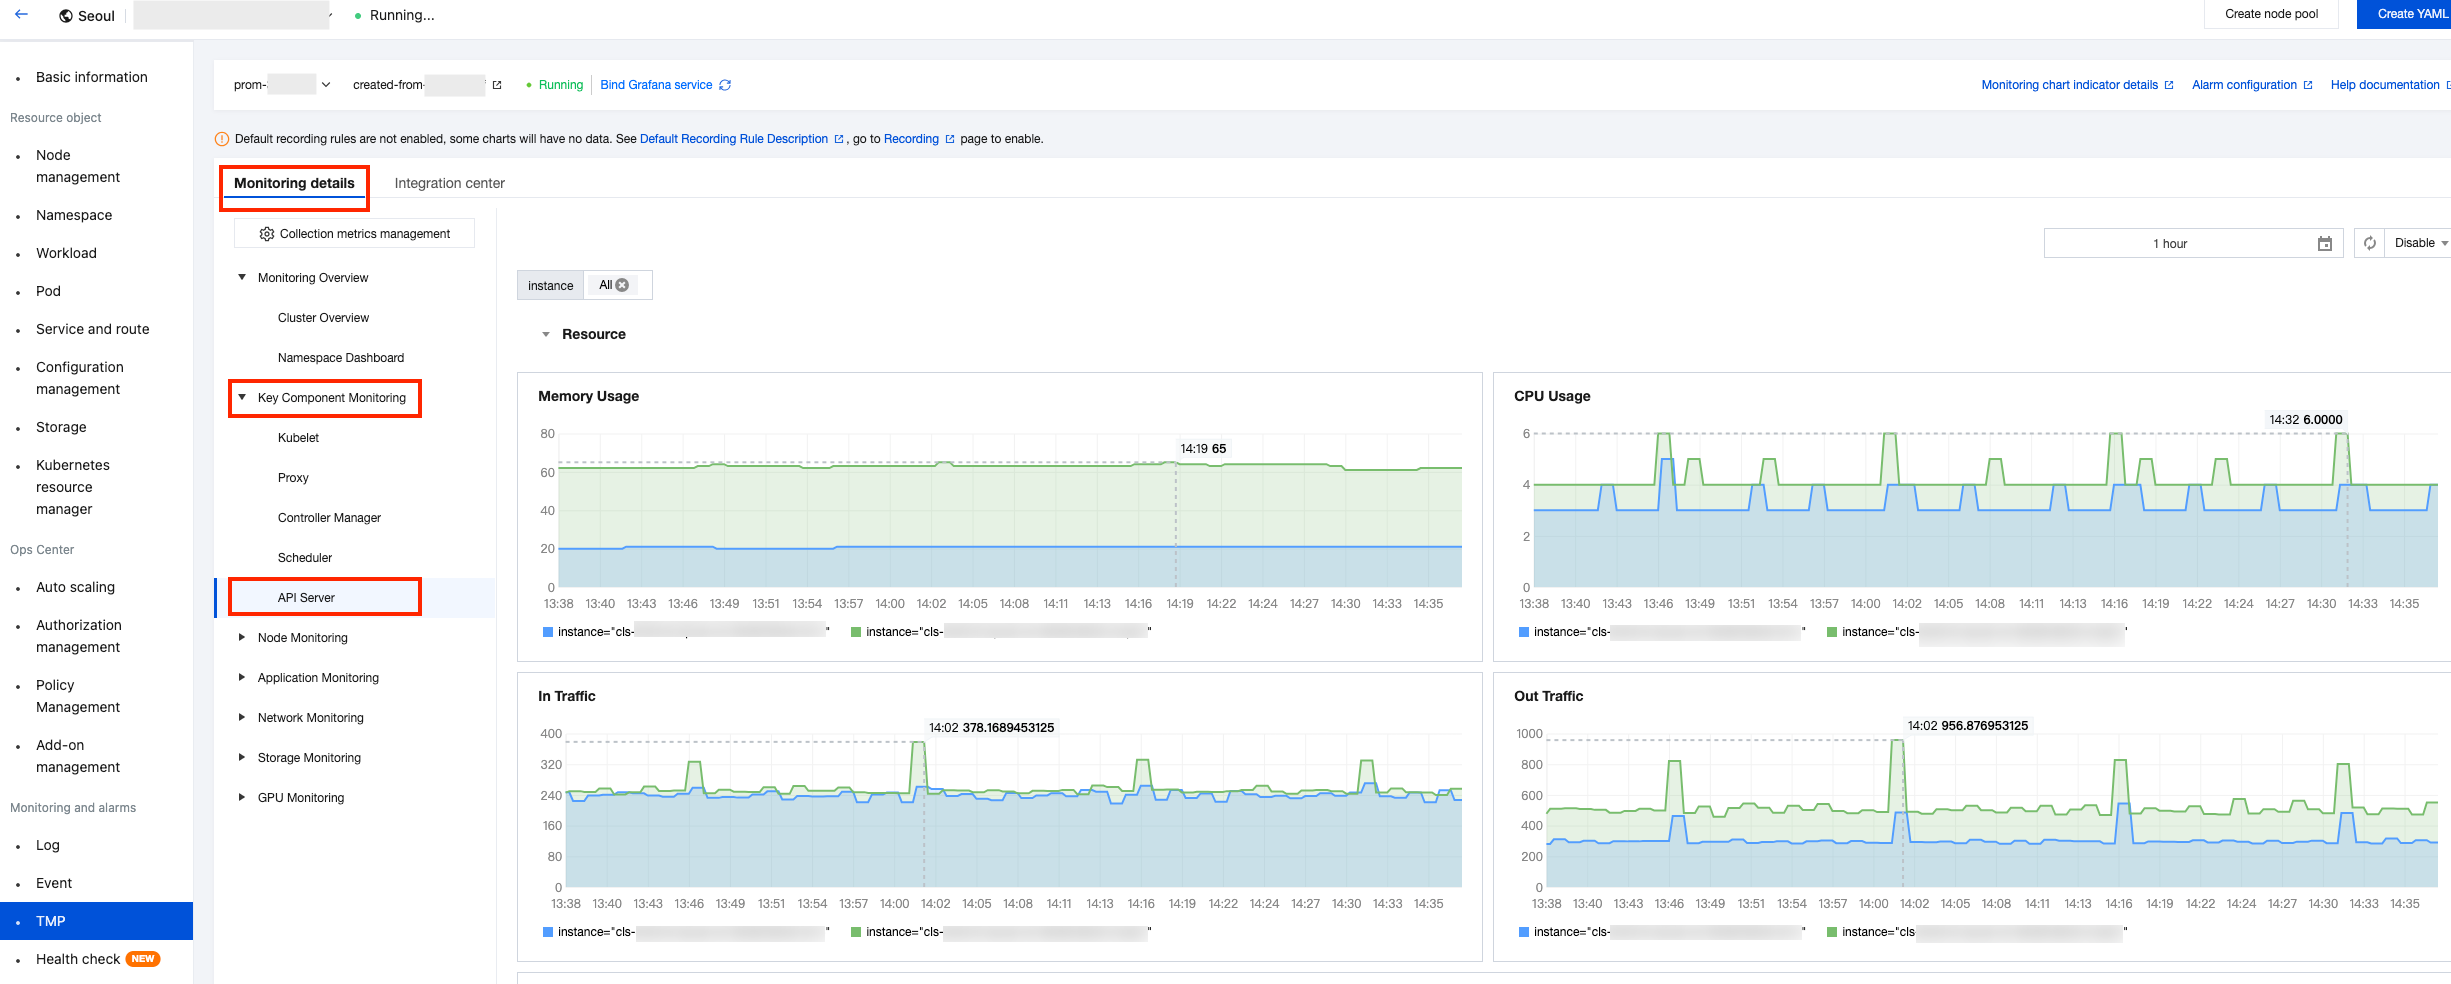
View the monitoring dashboard for API Server, Scheduler, and Controller Manager.
References
kube-apiserver component: For the metric list and instructions on using the corresponding monitoring dashboard, see kube-apiserver component metric descriptions.
kube-scheduler component: For the metric list and instructions on using the corresponding monitoring dashboard, see kube-scheduler component metric descriptions.
kube-controller-manager component: For the metric list and instructions on using the corresponding monitoring dashboard, see kube-controller-manager component metric descriptions.
For configuration instructions and recommended alarm configurations for collecting metrics of control plane components in TKE clusters (kube-apiserver, kube-scheduler, and kube-controller-manager) by using self-built Prometheus, see User-built Prometheus Collecting Control Plane Monitoring and Alarms.
Bantuan dan Dukungan
Apakah halaman ini membantu?
Anda juga dapat Menghubungi Penjualan atau Mengirimkan Tiket untuk meminta bantuan.
masukan