tencent cloud

Tencent Cloud Observability Platform

Release Notes and Announcements
Release Notes
Product Introduction
Overview
Strengths
Basic Features
Basic Concepts
Use Cases
Use Limits
Purchase Guide
Tencent Cloud Product Monitoring
Application Performance Management
Mobile App Performance Monitoring
Real User Monitoring
Cloud Automated Testing
Prometheus Monitoring
Grafana
EventBridge
PTS
Quick Start
Monitoring Overview
Instance Group
Tencent Cloud Product Monitoring
Application Performance Management
Real User Monitoring
Cloud Automated Testing
Performance Testing Service
Prometheus Getting Started
Grafana
Dashboard Creation
EventBridge
Alarm Service
Cloud Product Monitoring
Tencent Cloud Service Metrics
Operation Guide
CVM Agents
Cloud Product Monitoring Integration with Grafana
Troubleshooting
Practical Tutorial
Application Performance Management
Product Introduction
Access Guide
Operation Guide
Practical Tutorial
Parameter Information
FAQs
Mobile App Performance Monitoring
Overview
Operation Guide
Access Guide
Practical Tutorial
Tencent Cloud Real User Monitoring
Product Introduction
Operation Guide
Connection Guide
FAQs
Cloud Automated Testing
Product Introduction
Operation Guide
FAQs
Performance Testing Service
Overview
Operation Guide
Practice Tutorial
JavaScript API List
FAQs
Prometheus Monitoring
Product Introduction
Access Guide
Operation Guide
Practical Tutorial
Terraform
FAQs
Grafana
Product Introduction
Operation Guide
Guide on Grafana Common Features
FAQs
Dashboard
Overview
Operation Guide
Alarm Management
Console Operation Guide
Troubleshooting
FAQs
EventBridge
Product Introduction
Operation Guide
Practical Tutorial
FAQs
Report Management
FAQs
General
Alarm Service
Concepts
Monitoring Charts
CVM Agents
Dynamic Alarm Threshold
CM Connection to Grafana
Documentation Guide
Related Agreements
Application Performance Management Service Level Agreement
APM Privacy Policy
APM Data Processing And Security Agreement
RUM Service Level Agreement
Mobile Performance Monitoring Service Level Agreement
Cloud Automated Testing Service Level Agreement
Prometheus Service Level Agreement
TCMG Service Level Agreements
PTS Service Level Agreement
PTS Use Limits
Cloud Monitor Service Level Agreement
API Documentation
History
Introduction
API Category
Making API Requests
Monitoring Data Query APIs
Alarm APIs
Legacy Alert APIs
Notification Template APIs
TMP APIs
Grafana Service APIs
Event Center APIs
TencentCloud Managed Service for Prometheus APIs
Monitoring APIs
Data Types
Error Codes
Glossary

Integration Center

PDF
포커스 모드
폰트 크기
마지막 업데이트 시간: 2024-08-07 22:04:30
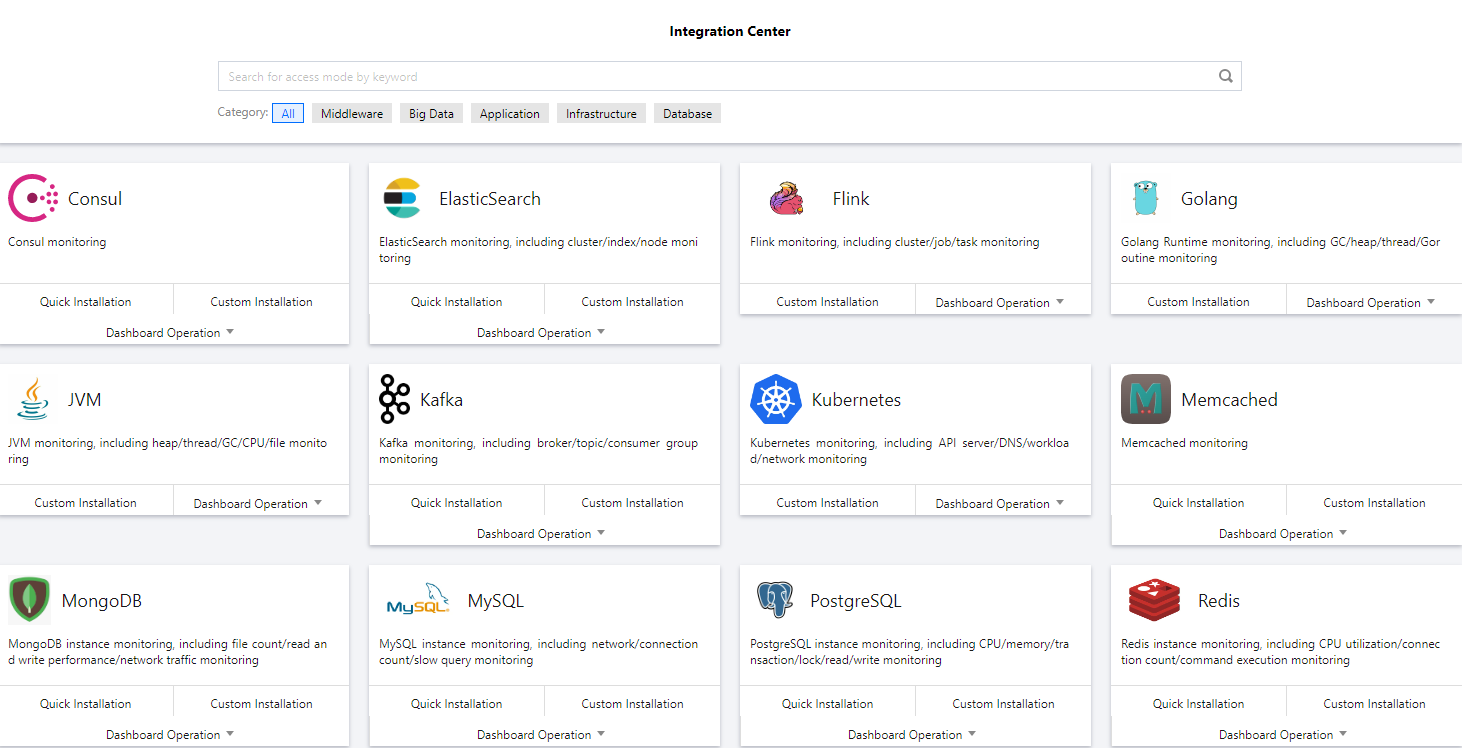
TMP integrates commonly used programming languages, middleware, big data, and infrastructure databases. It supports quick installation and custom installation. You only need to follow the instructions to monitor the corresponding components. It also provides out-of-the-box Grafana monitoring dashboards. The integration center covers three major monitoring scenarios of basic service monitoring, application layer monitoring, and TKE cluster monitoring, making it easier for you to integrate and use.

List of Supported Services

Service Type
Service
Monitoring Metric
Quick Installation
Integration Guide
Big data
Elasticsearch
Cluster/Index/Node monitoring
Supported
Flink
Cluster/Job/Task monitoring
Not supported
Development
CVM
The extended `cvm_sd_config` can be used to configure a CVM scrape task and collect Node Exporter or custom business metrics.
Supported
Go
GC/Heap/Thread/Goroutine monitoring
Not supported
JVM
Heap/Thread/GC/CPU/File monitoring
Not supported
Spring MVC
HTTP API/Exception/JVM monitoring
Not supported
Middleware
Kafka
Broker/Topic/Consumer group monitoring
Supported
Consul
Consul monitoring
Supported
Etcd
Etcd monitoring
Not supported
-
Istio
Istio monitoring
Not supported
-
Infrastructure
Kubernetes
API server/DNS/Workload/Network monitoring
Supported
Database
TencentDB for MongoDB
File count/Read and write performance/Network traffic monitoring
Supported
TencentDB for MySQL
Network/Connection count/Slow query monitoring
Supported
TencentDB for PostgreSQL
CPU/Memory/Transaction/Lock/Read/Write monitoring
Supported
TencentDB for Redis
Memory utilization/Connection count/Command execution status monitoring
Supported
TencentDB for Memcached
Memcached monitoring
Supported
Inspection
Health check
Blackbox can be used to regularly test the connectivity of the target service, helping you stay up to date with the service health and discover exceptions in time.
Supported
CM
CM
Tencent Cloud service monitoring
Supported
-
Custom
Scrape task
The native `static_config` can be used to configure a scrape task.
Supported
CVM scrape task
The extended `cvm_sd_config` can be used to configure a CVM scrape task.
Supported

Directions

Quick installation

Some services support quick agent installation. For more information, see Integration Center > List of Supported Services.
1. Log in to the TMP console.
2. In the instance list, select the corresponding TMP instance.
3. Enter the instance details page and click Integration Center.
4. In the Integration Center, select the service that supports quick installation and click Install in the bottom-left corner.


5. On the Integration List page, enter the metric collection name and address and click Save. Below is a sample for Kafka:


Custom installation

1. Log in to the TMP console.
2. In the instance list, select the corresponding TMP instance.
3. Enter the instance details page and click Integration Center.
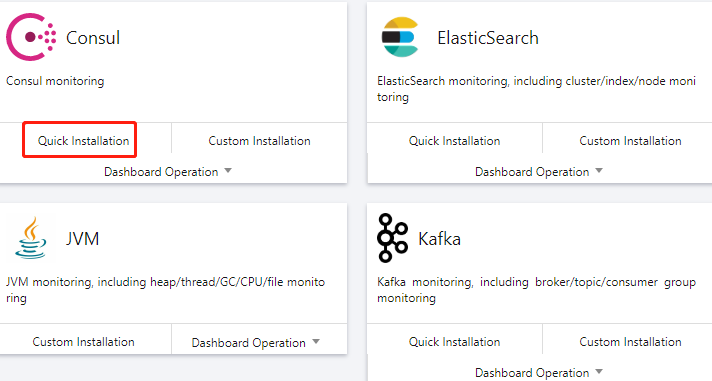
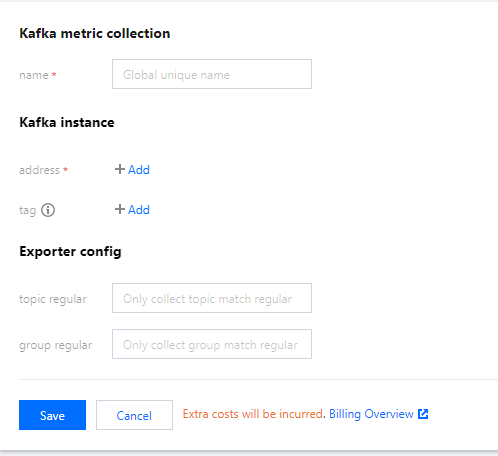
4. Select the target service in the integration center. You can click Integration Guide to view the integration guide. After successful integration, you can monitor the corresponding service in real time. You can also click Install/Upgrade in Dashboard Operation to install or upgrade the Grafana dashboard for the service.


도움말 및 지원

문제 해결에 도움이 되었나요?

피드백