Grafana is a cross-platform, open-source visualization and analysis tool. It is currently the most popular time series data display tool for network architecture and application analysis, primarily used for visualizing large-scale metric data. For more information, see Grafana Cloud documentation. By using TencentDB for CTSDB 3.0 with Grafana, you can use Grafana's user-friendly visualization tools to better monitor and analyze data from CTSDB 3.0.
Prerequisites
1. Before using Grafana, you need to purchase an instance of CTSDB 3.0, configure the user account and database information, and write a sufficient amount of data. For detailed operations, see Creating Database Instance and Connecting to Instance and Writing Data.
Tencent Cloud Managed Service for Grafana (TCMG) should be in the same VPC network as the CTSDB 3.0 instance. Otherwise, it will be unreachable.
Configure the outbound rules in the security group of Tencent Cloud Grafana by adding the IP address and port of the CTSDB 3.0 to the outbound rules. Then, configure the inbound rules in the security group of CTSDB 3.0 by adding the IP address and port of Grafana to the inbound rules.
Access the download URL of the Grafana official website in the browser on the Windows operating system of Tencent Cloud CVM. Download the corresponding installation package based on your system version and configuration, and then install it.
Note:
The official Grafana v8.x and earlier versions have been verified. Currently, because the show retention policies API for CTSDB 3.0 is not yet available, Grafana uses Show RP to check the data source when the data source is being added, resulting in a Network Error: Bad Request (400) error. You can ignore this message, and the data source can be added and used normally.
Tencent Cloud CVM should be in the same VPC network as TencentDB for CTSDB 3.0 instance.
Configure outbound rules in the security group of Tencent Cloud CVM by adding the IP and port of CTSDB 3.0 to the outbound rules. Then, configure inbound rules in the security group of CTSDB 3.0 by adding the IP and port of the CVM to the inbound rules.
Steps
Below are the steps to use Tencent Cloud Managed Service for Grafana (TCMG). The configuration process for the open-source Grafana service is similar.
2. In the Instance List, find the created Grafana instance, click Instance ID, and enter the Basic Info page of the Grafana service.
3. In the Network area on the Basic Info page, click
to open the public network address.
4. Click Access Address in the Basic Info area to log in to the Grafana service.
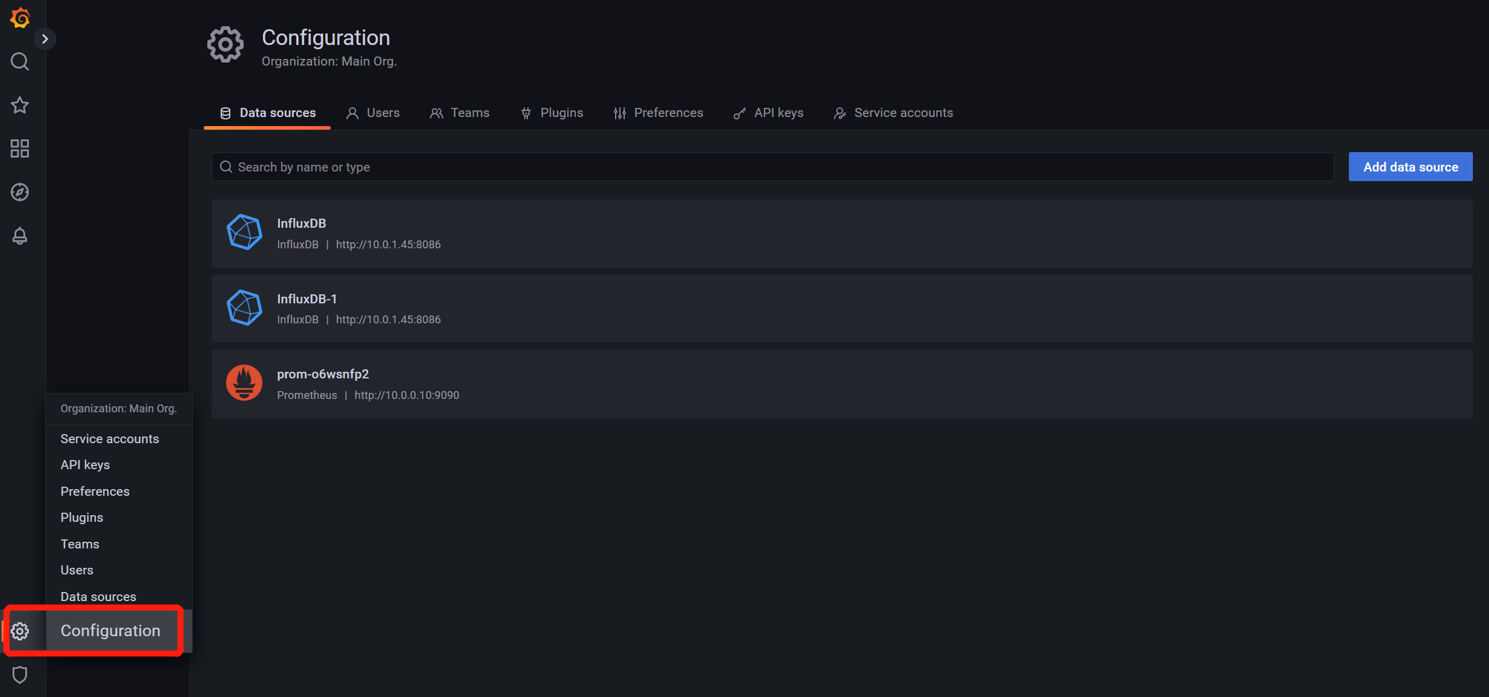
5. In the bottom-left corner, click
and select Configuration to enter the Data sources page, as shown below:
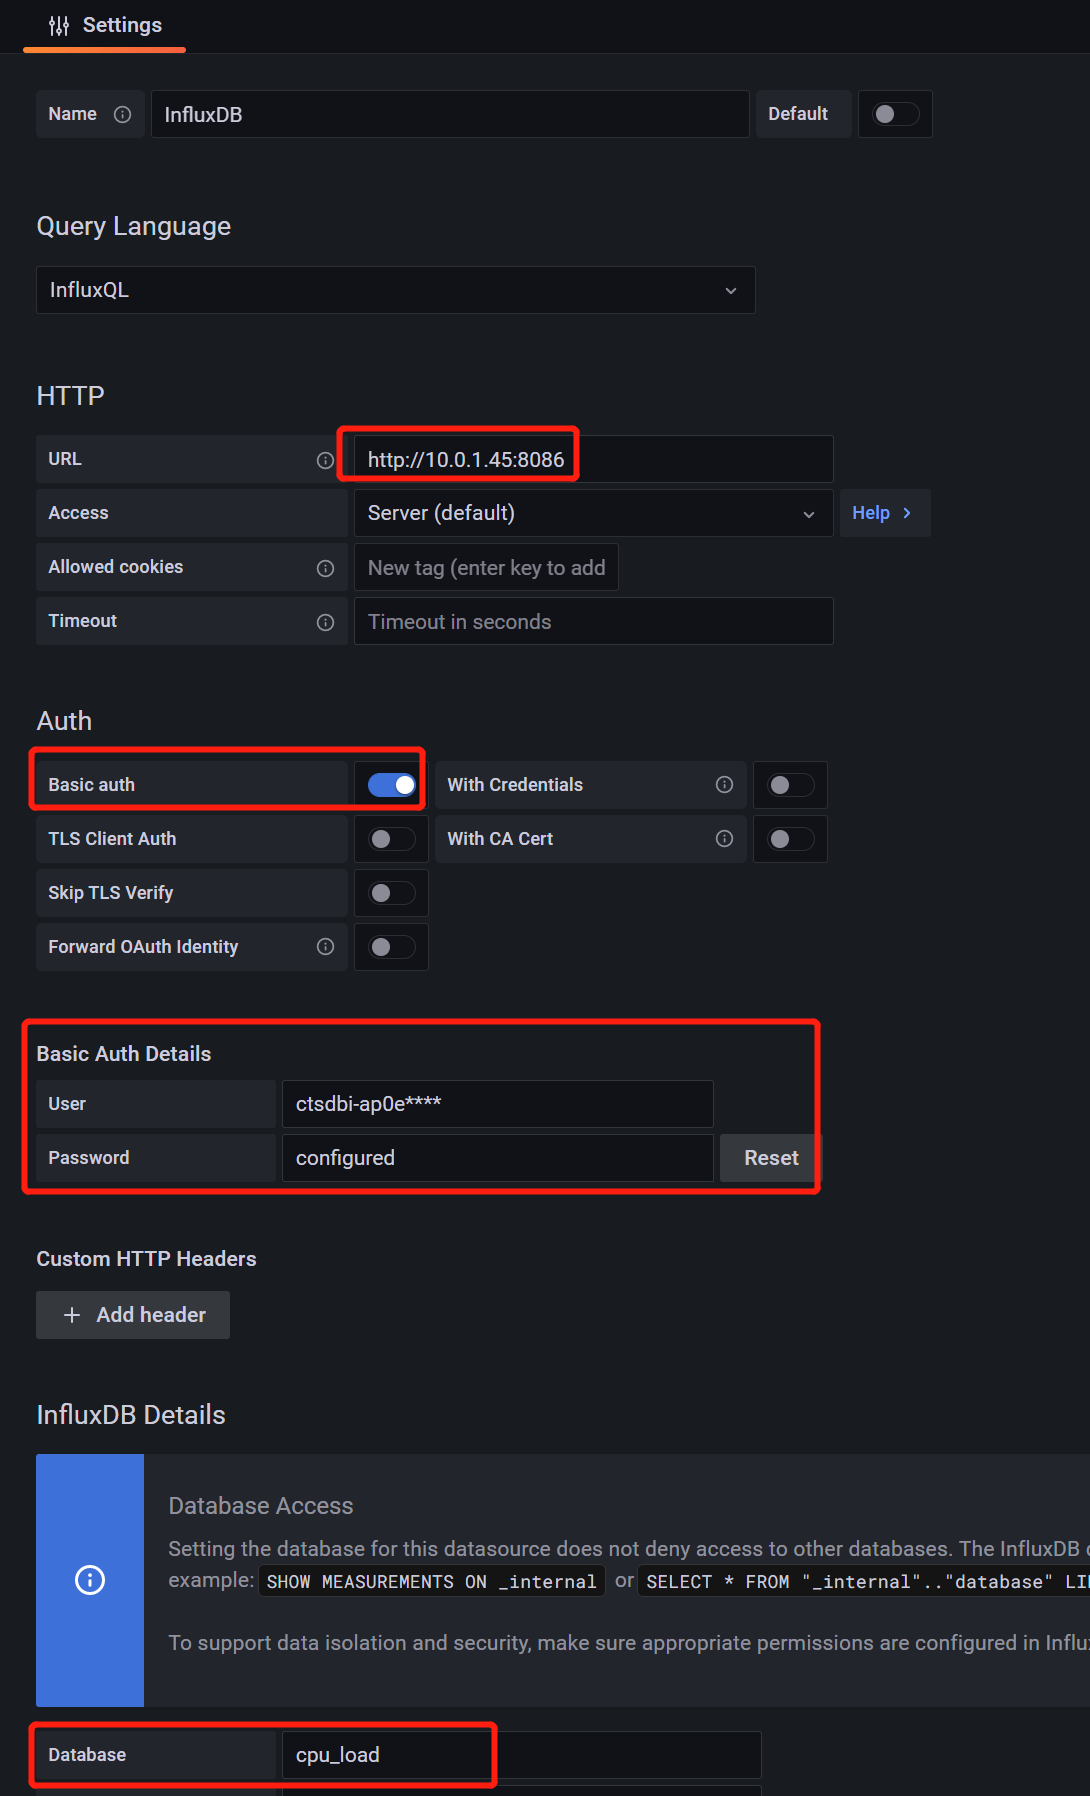
6. In the search box, input InfluxDB to find the InfluxDB database, and configure the data source parameters as follows:
Interface Parameter
Sub-parameter
Parameter Description
Example
URL
-
Configure the private network access address for the CTSDB 3.0.
For example, if the private network address is 10.0.1.45 and the port is 8086,
then input: http://10.0.1.45:8086
Auth
Basic auth
Configure whether authentication is required to access the CTSDB 3.0.
Enabled
Basic Auth Details
User
This parameter is displayed only when Basic auth is enabled. Input the username for accessing the CTSDB 3.0.
ctsdbi-ap0e****
Password
Enter the password corresponding to the username for accessing the CTSDB 3.0.
test@123
InfluxDB Details
Database
Configure the name of the database for the data source. Data should be written. Otherwise, the test will fail.
cpu_data
7. After the configuration is completed, click Save & test below to save the configuration and test connectivity. A prompt datasource is working. 1 measurements found indicates successful access.
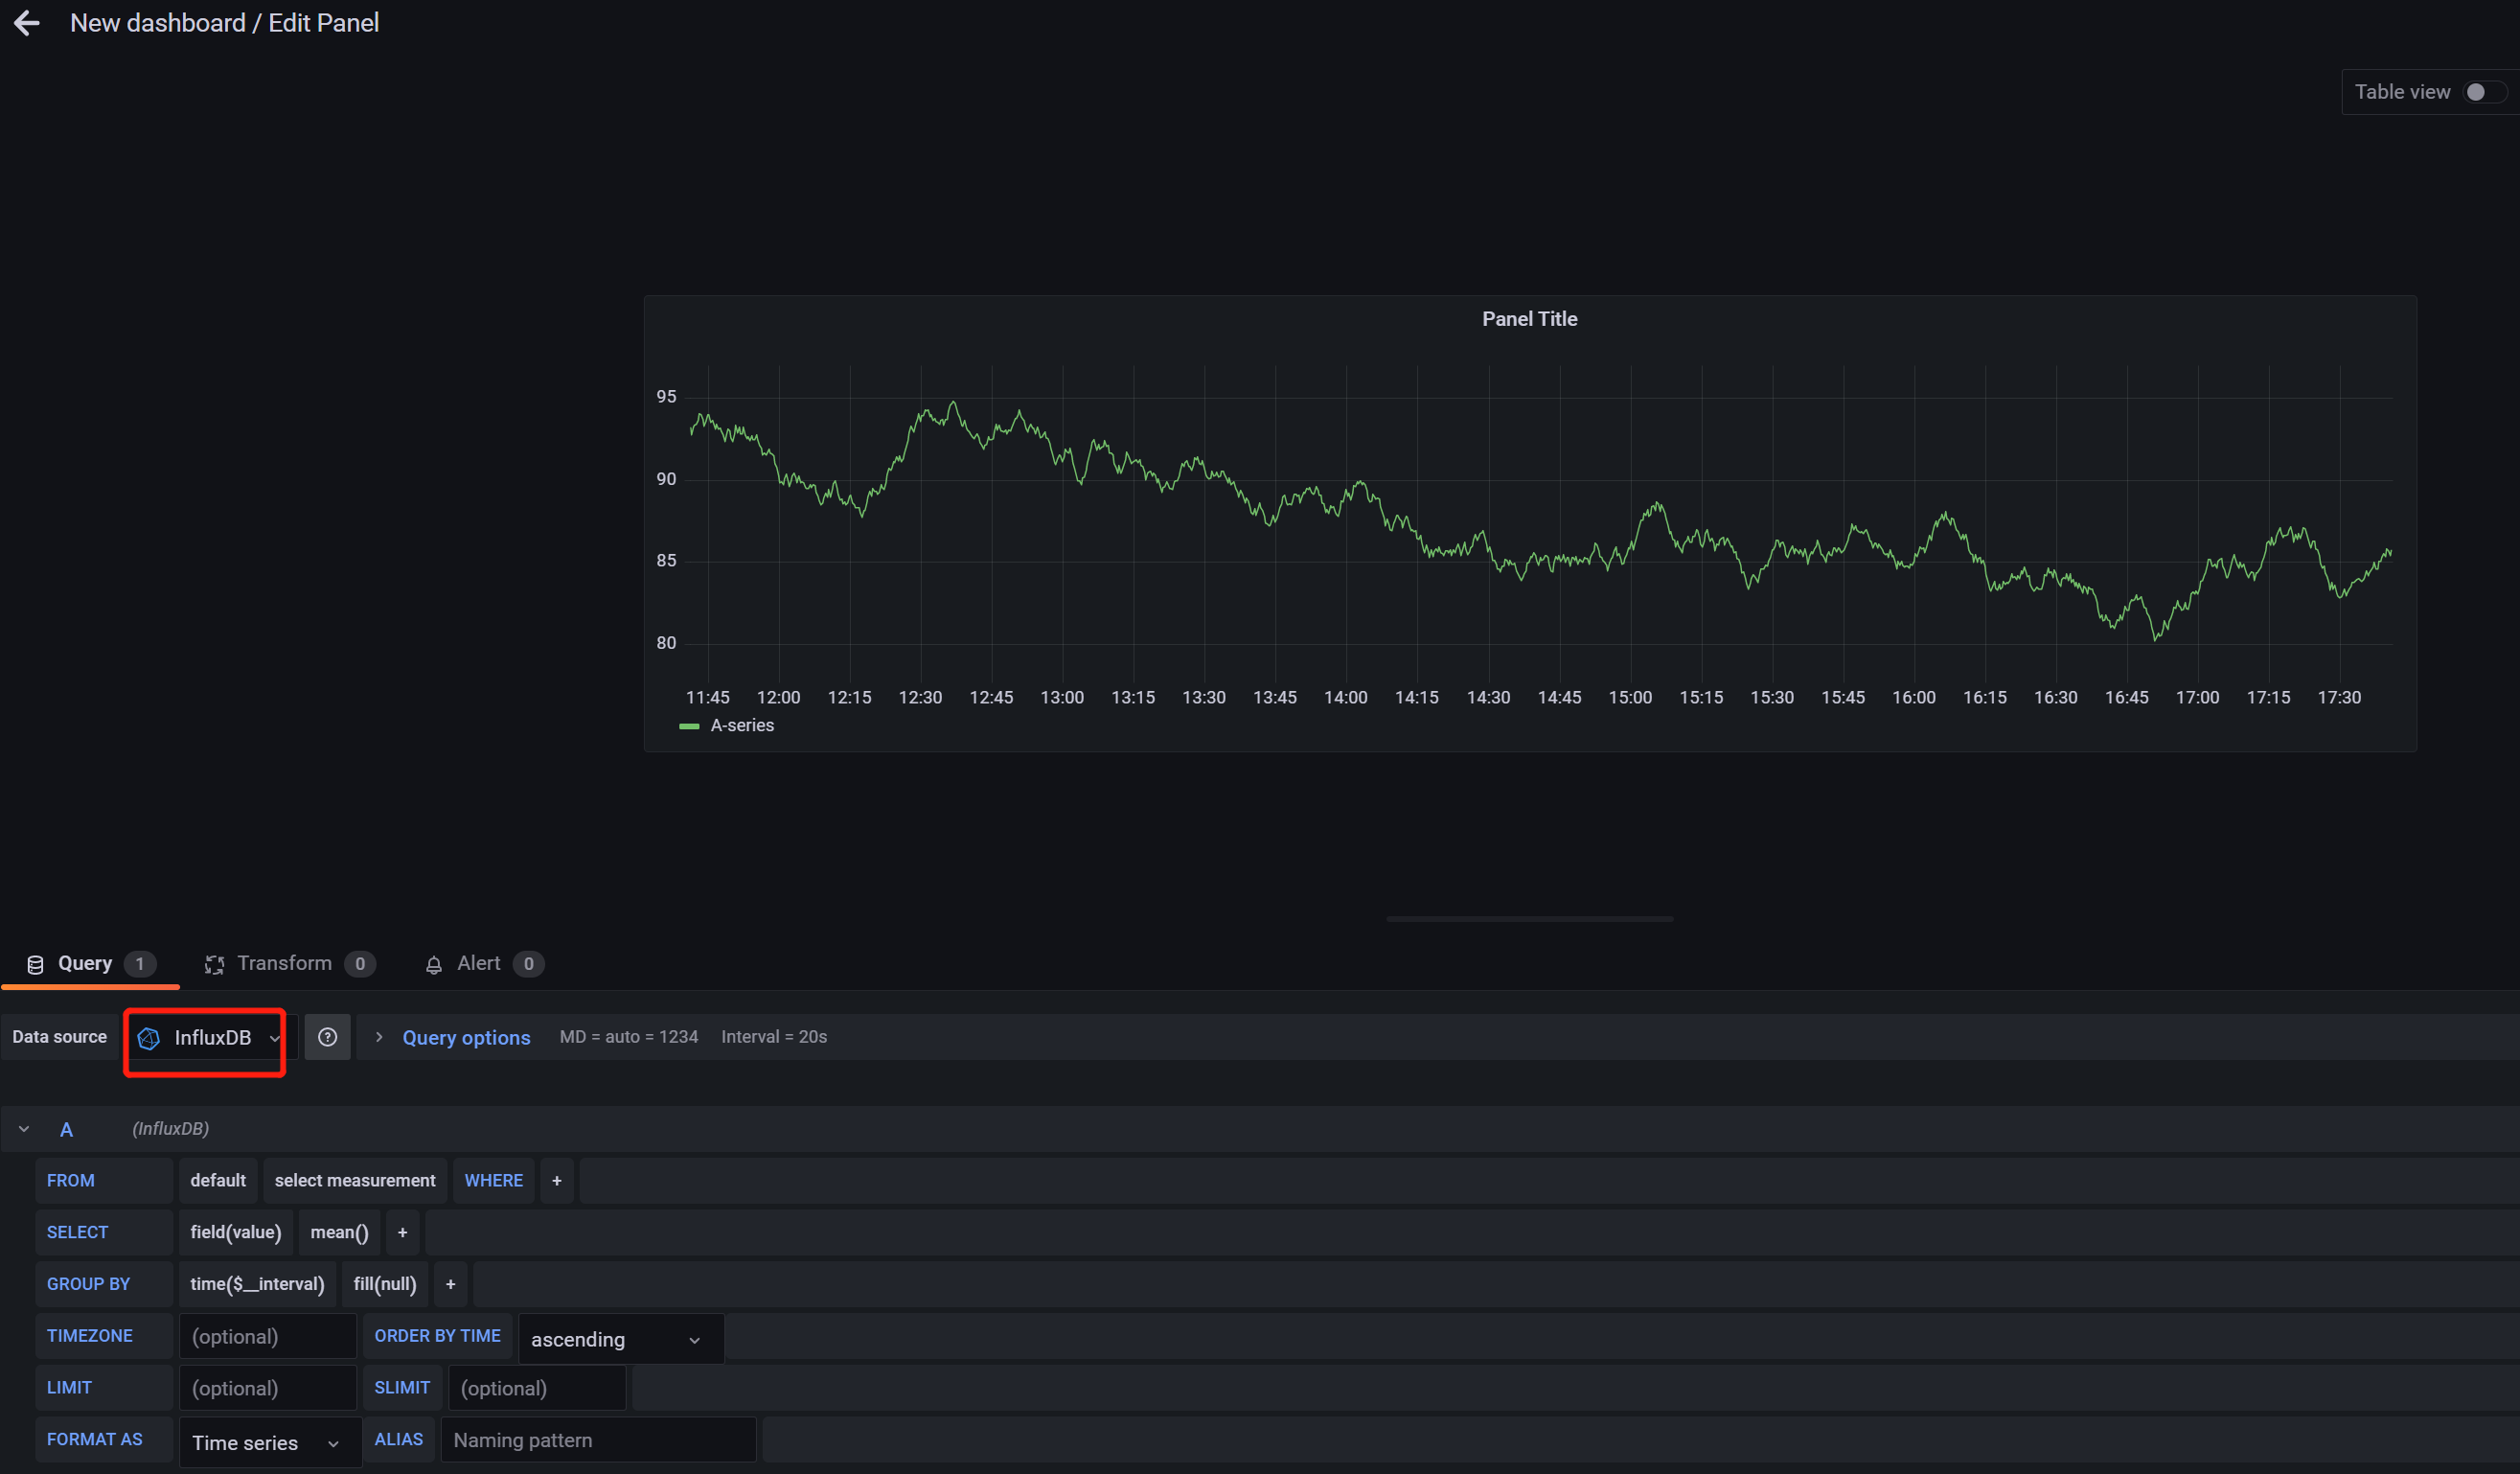
8. Click
in the top-left corner and select New dashboard to create a graph. Select the connected data source for Data source, as shown below. For more operations on creating graphs, see Getting Started with Grafana and InfluxDB.