tencent cloud

Tencent Cloud TCHouse-D

Product Introduction
Overview
Concepts
Cluster Architecture
Strengths
Scenarios
Purchase Guide
Billing Overview
Renewal Instructions
Overdue Policy
Refund Instructions
Configuration Adjustment Billing Instructions
Getting Started
Using Tencent Cloud TCHouse-D Through the Console
Using Tencent Cloud TCHouse-D Through a Client
Operation Guide
Cluster Operation
Monitoring and Alarm Configuration
Account Privilege Management
Data Management
Query Management
Modify Configurations
Node Management
Log Analysis
SQL Studio
Enabling Resource Isolation
Development Guide
Design of Data Table
Importing Data
Exporting Data
Basic Feature
Query Optimization
Ecological Expansion Feature
API Documentation
History
Introduction
API Category
Making API Requests
Cluster Operation APIs
Database and Table APIs
Cluster Information Viewing APIs
Hot-Cold Data Layering APIs
Database and Operation Audit APIs
User and Permission APIs
Resource Group Management APIs
Data Types
Error Codes
Cloud Ecosystem
Granting CAM Policies to Sub-accounts
Query Acceleration for Tencent Cloud DLC
Practical Tutorial
Basic Feature Usage
Advanced Features Usage
Resource Specification Selection and Optimization Suggestions
Naming Specifications and Limits to the Database and Data Table
Table Design and Data Import
Query Optimization
Suggested Usage to Avoid
Accessing TCHouse-D via JDBC over the Public Network
Performance Testing
TPC-H Performance Testing
SSB Performance Testing
TPC-DS Performance Testing
FAQs
Common Operational Issues
Common Errors
Contact Us
Glossary
Product Policy
Service Level Agreement
Privacy Policy
Data Processing And Security Agreement

Slow Query Analysis

PDF
Mode fokus
Ukuran font
Terakhir diperbarui: 2024-06-27 10:52:17

Operation Guide

1. Log in to Tencent Cloud TCHouse-D Console, and select the target cluster by ID/Name in the cluster list to enter the cluster details page.
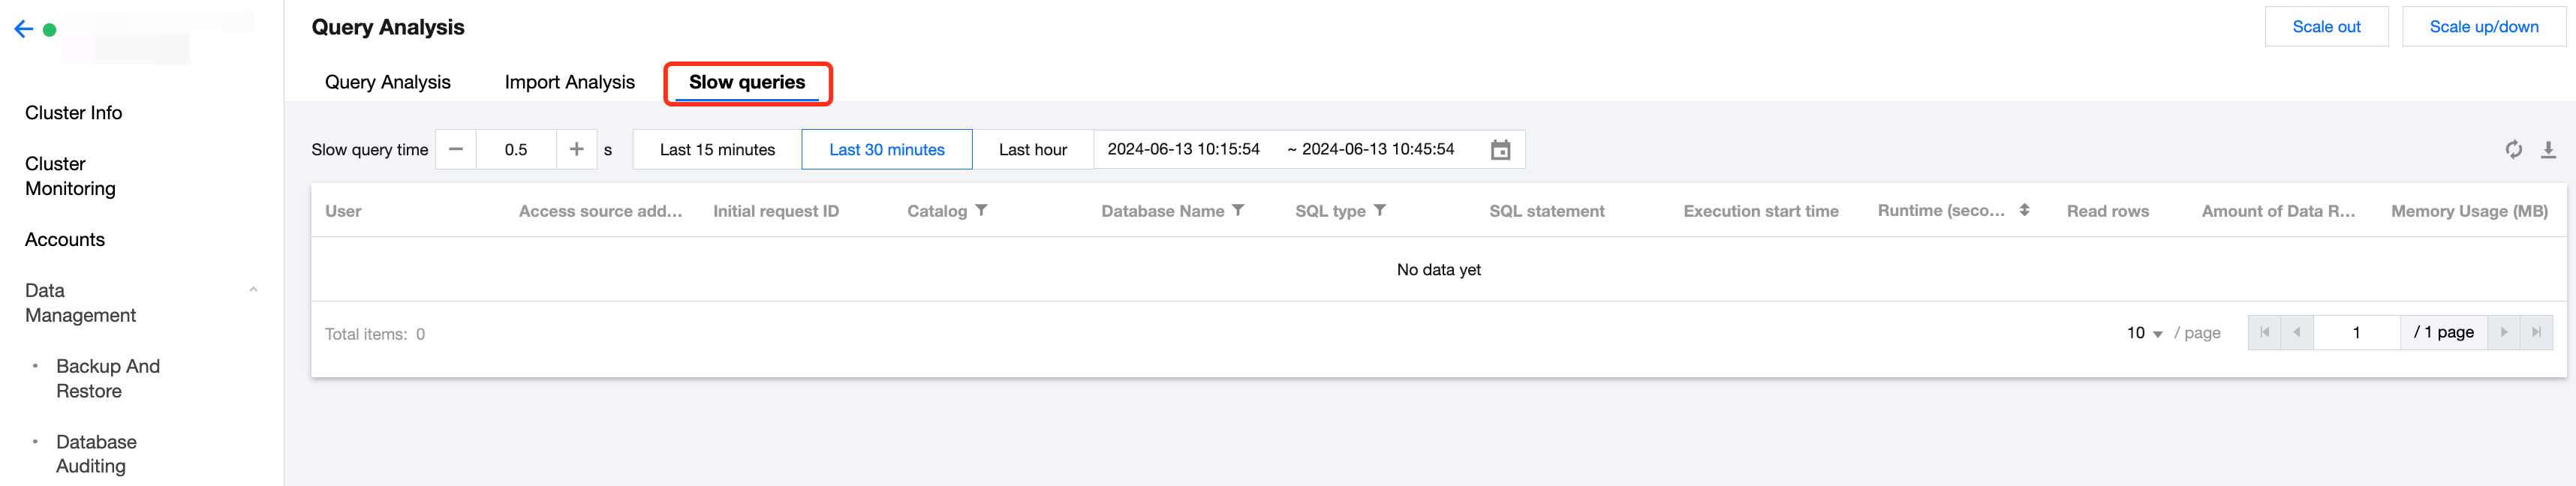
2. After switching to the Query Analysis page, you can switch to Slow Queries sub-page to perform slow query analysis.


3. This page, by default, displays slow SQL taking more than 500 ms. You can adjust the threshold for judging slow query SQL duration as needed, supporting a minimum setting of 100 ms.

Features

You can set the time range for analysis, including the last 15 minutes, last 30 minutes, last hour, or a custom time period.
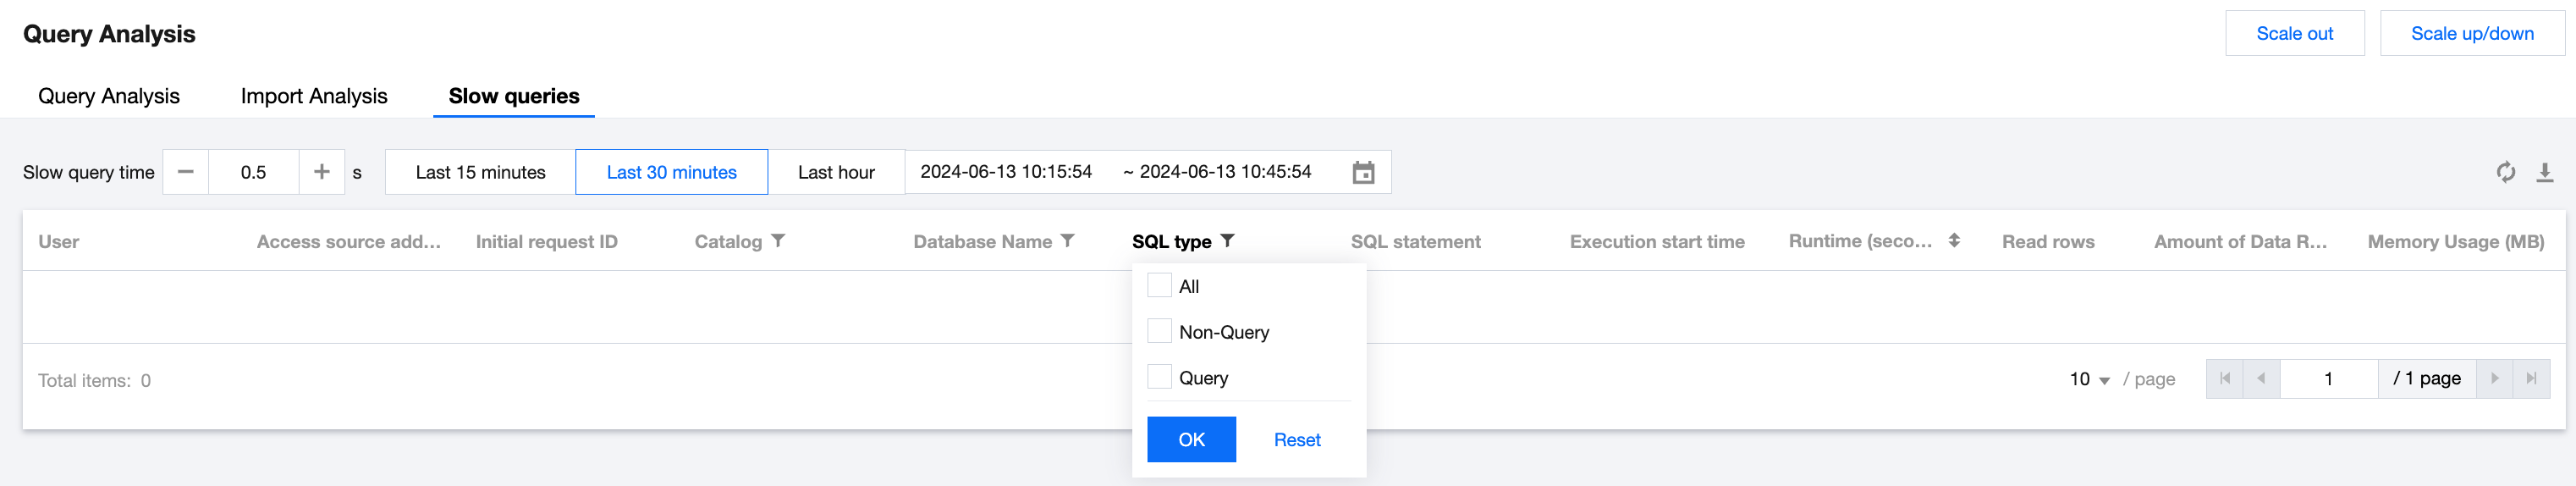
It supports sorting the slow queries list by execution duration, or filtering based on database name, or SQL types:
Database Name: If you did not specify the database during the query, this column will be displayed as NULL.
SQL Type: query and non-query.


Bantuan dan Dukungan

Apakah halaman ini membantu?

masukan