TencentDB for CTSDB 3.0 supports viewing trend graphs of monitoring metrics at any time, helping you quickly analyze the operation and performance of CTSDB to adjust and optimize CTSDB in a timely manner and predict risks in advance.
Usage Instructions
The monitoring data is kept for 30 days, and you cannot view the monitoring information before 30 days.
After receiving the alarm message reported by Tencent Cloud, you need to troubleshoot anomalies according to the alarm message.
Viewing Monitoring Metrics
1. Log in to the CTSDB Console using a Tencent Cloud account.
2. At the top of the right page, select Version 3.0.
3. In the Instance List, find the instance you need to view.
4. Click the target instance ID, or click Manage in the Operation column to enter the Instance Details page.
5. Select the Instance Monitoring tab, click
in the time box, and select the period for which you want to get the monitoring view.
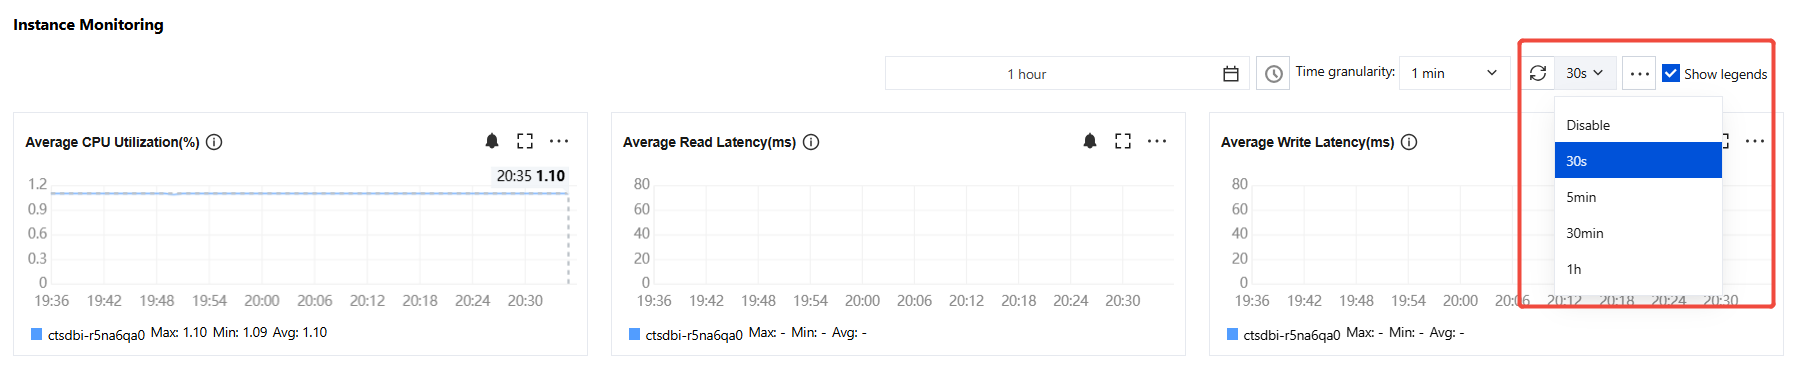
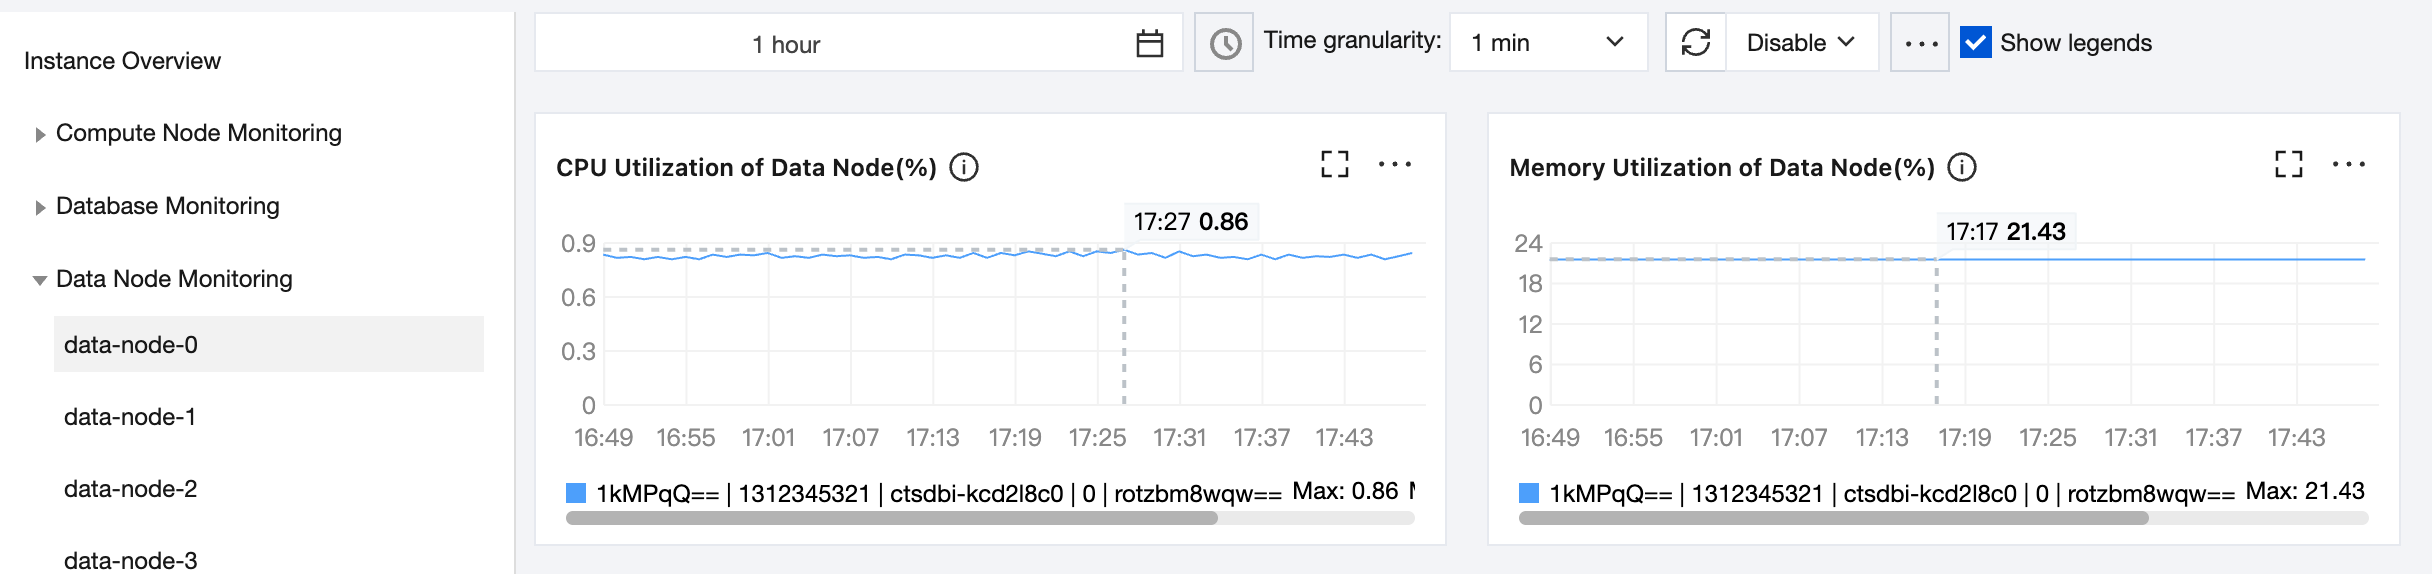
6. In the Time granularity drop-down list, configure the time interval on the monitoring view timeline.
7. In the Disable drop-down list, select the time for automatic data update. Options available are 30s, 5min, 30min, and 1h.
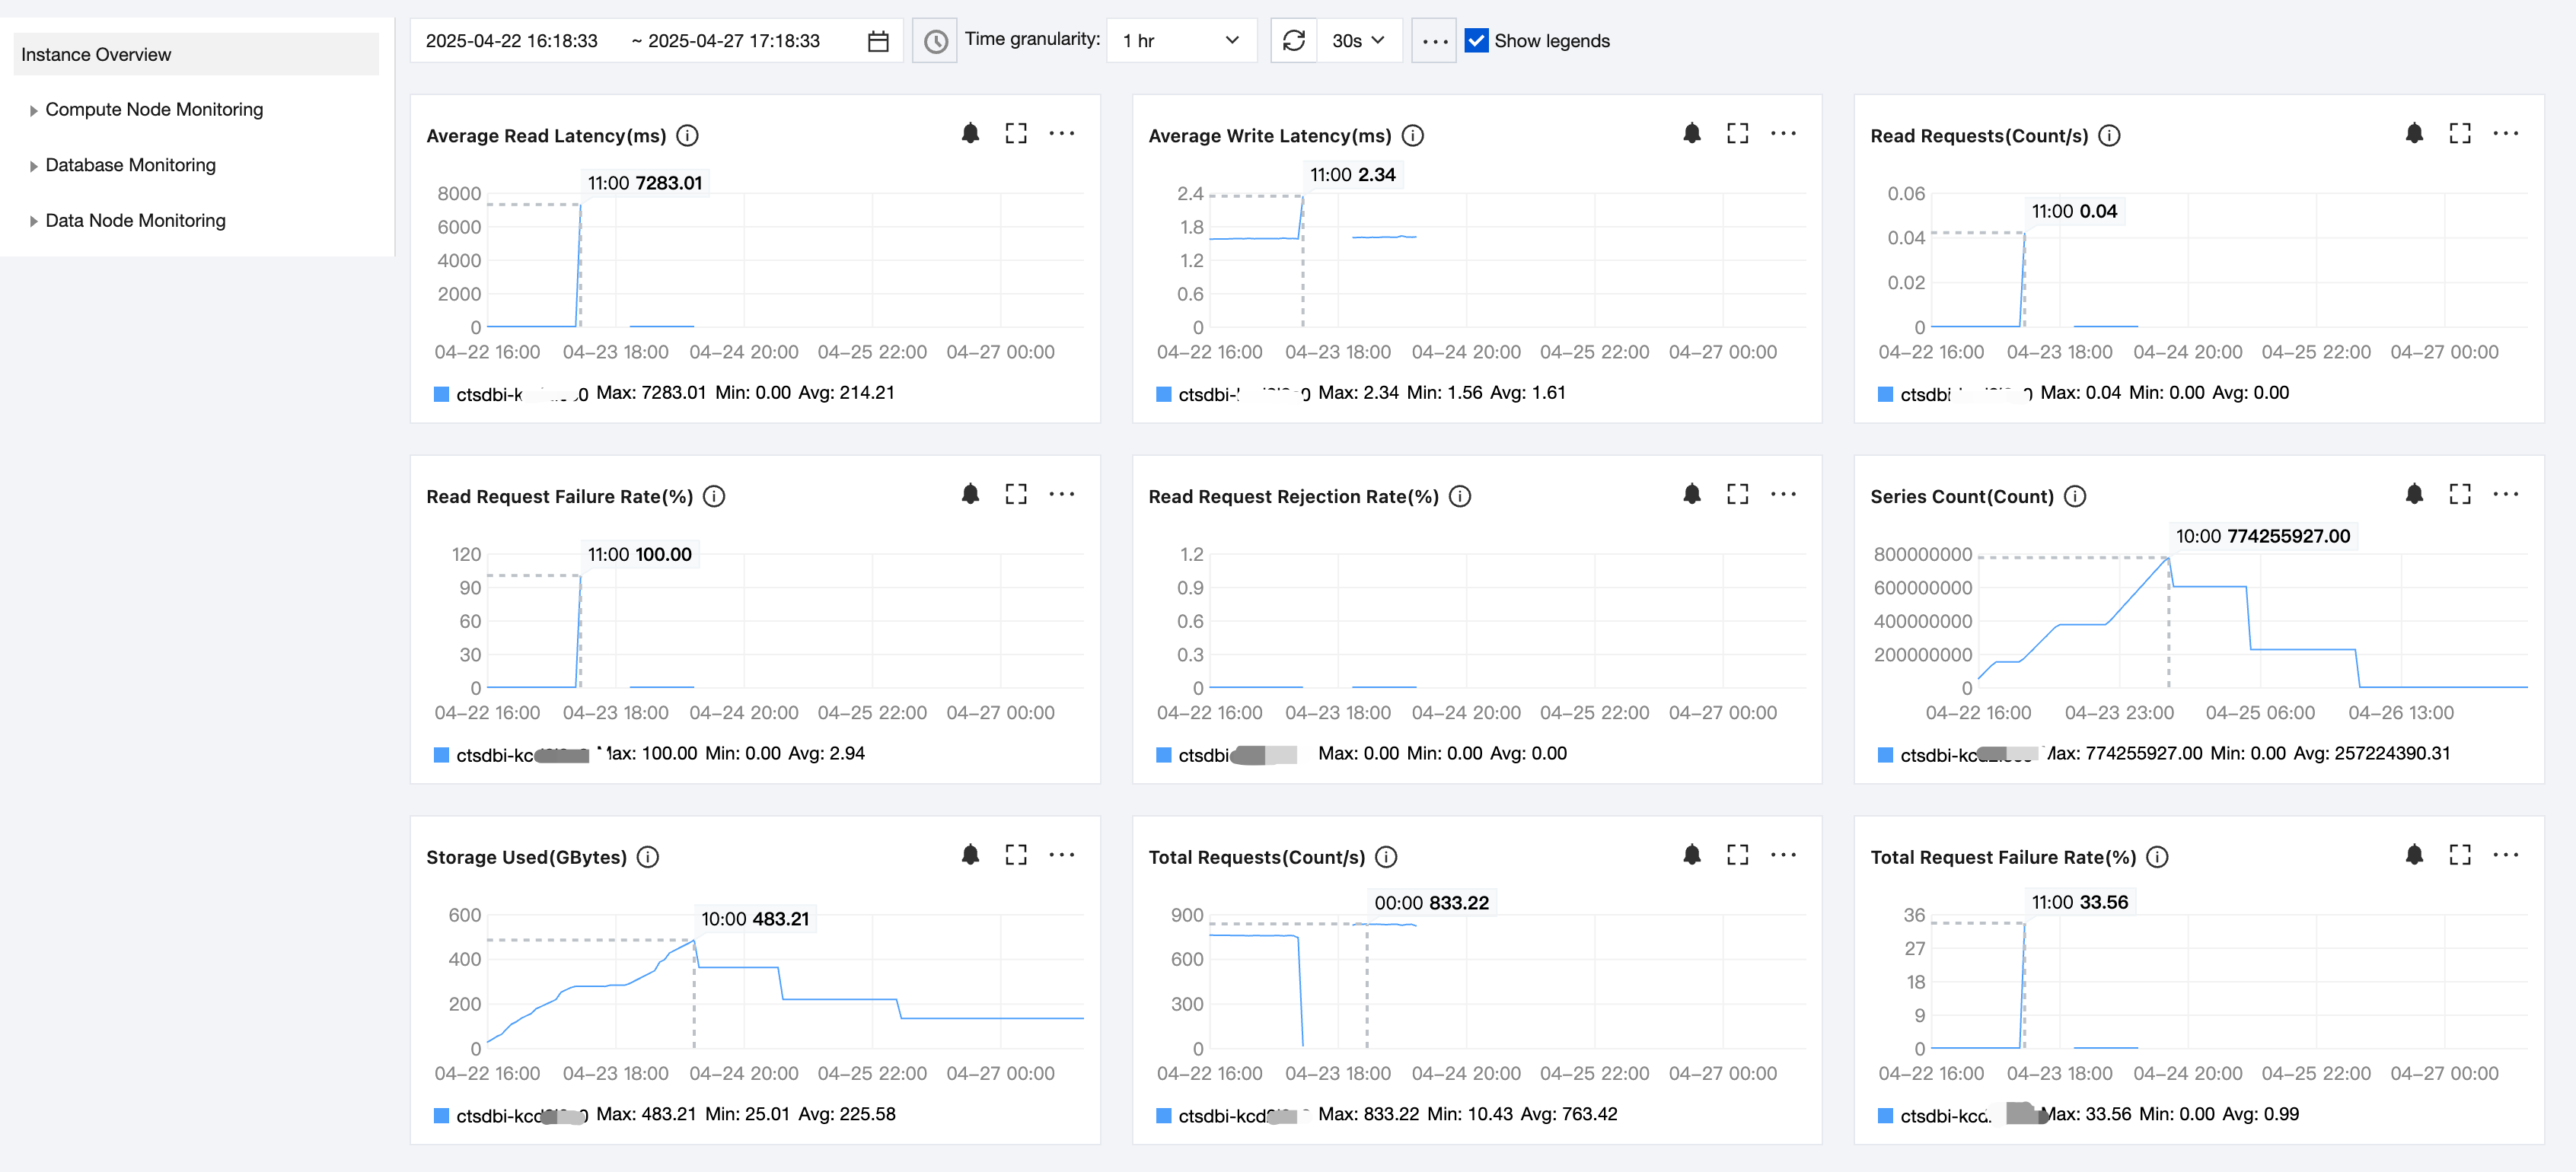
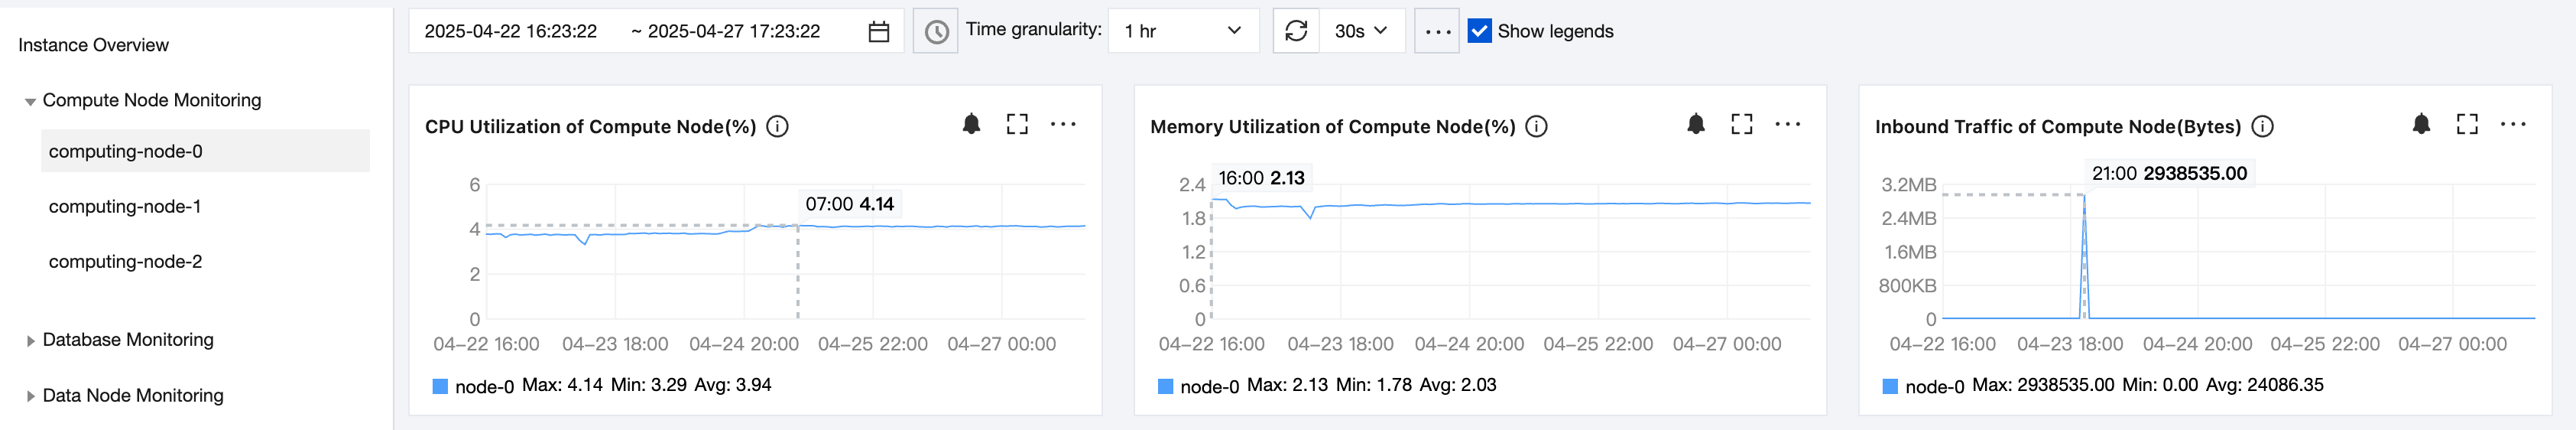
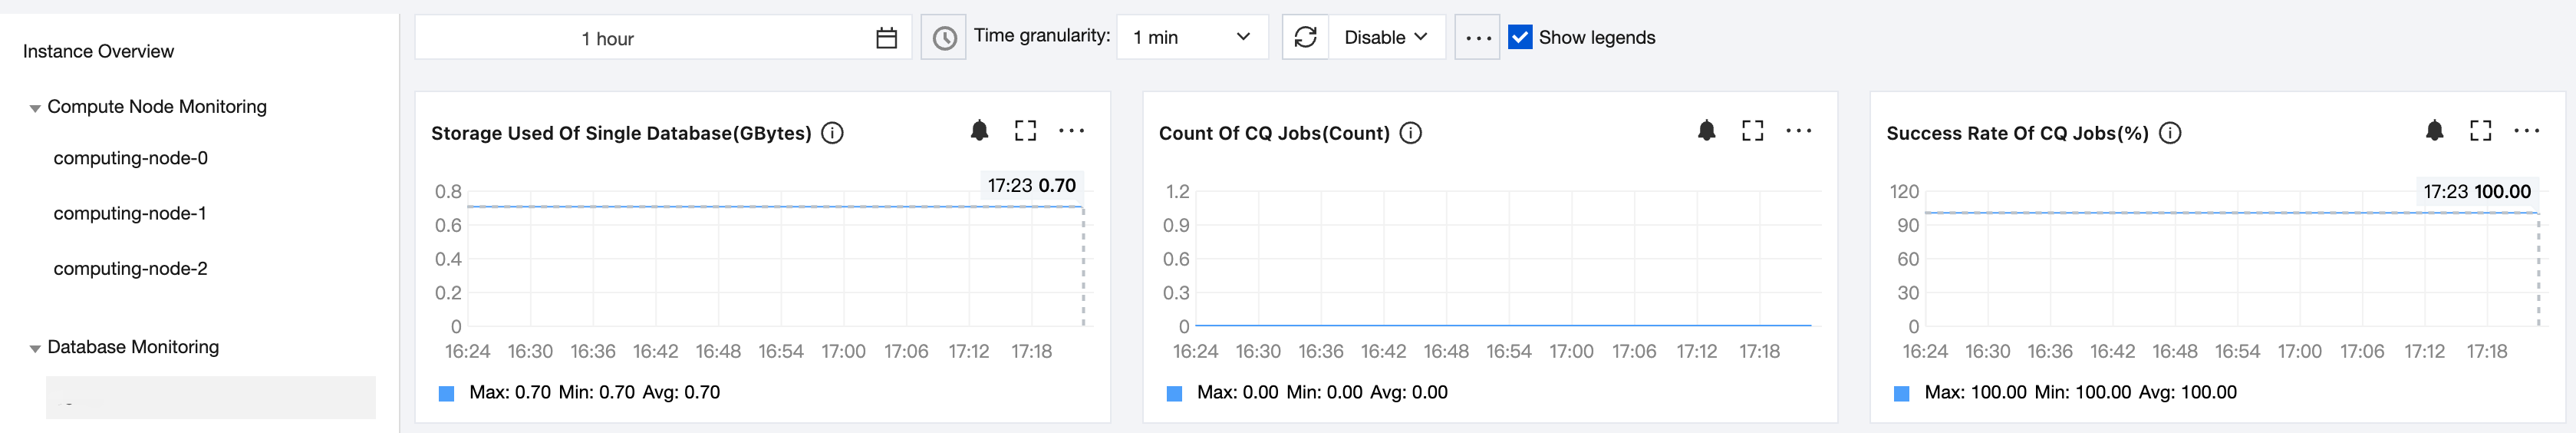
8. View the monitoring view of changes in each monitoring metric of the instance, node, and database during this period.
In each monitoring view, hover the mouse over the view to see the metric data at any time point. Below the view, you can directly see the maximum, minimum, and average values of the metric.
to view the monitoring view of the metric in full screen.
In each monitoring view area, click
and select Export data to export the monitoring data in a table format for local viewing. Select Import image to export the monitoring view as an image for local viewing.