1. In TBaaS Console, select Fabric > Blockchain Network in the left sidebar to enter the network card page, and click the corresponding card to enter the network details page.
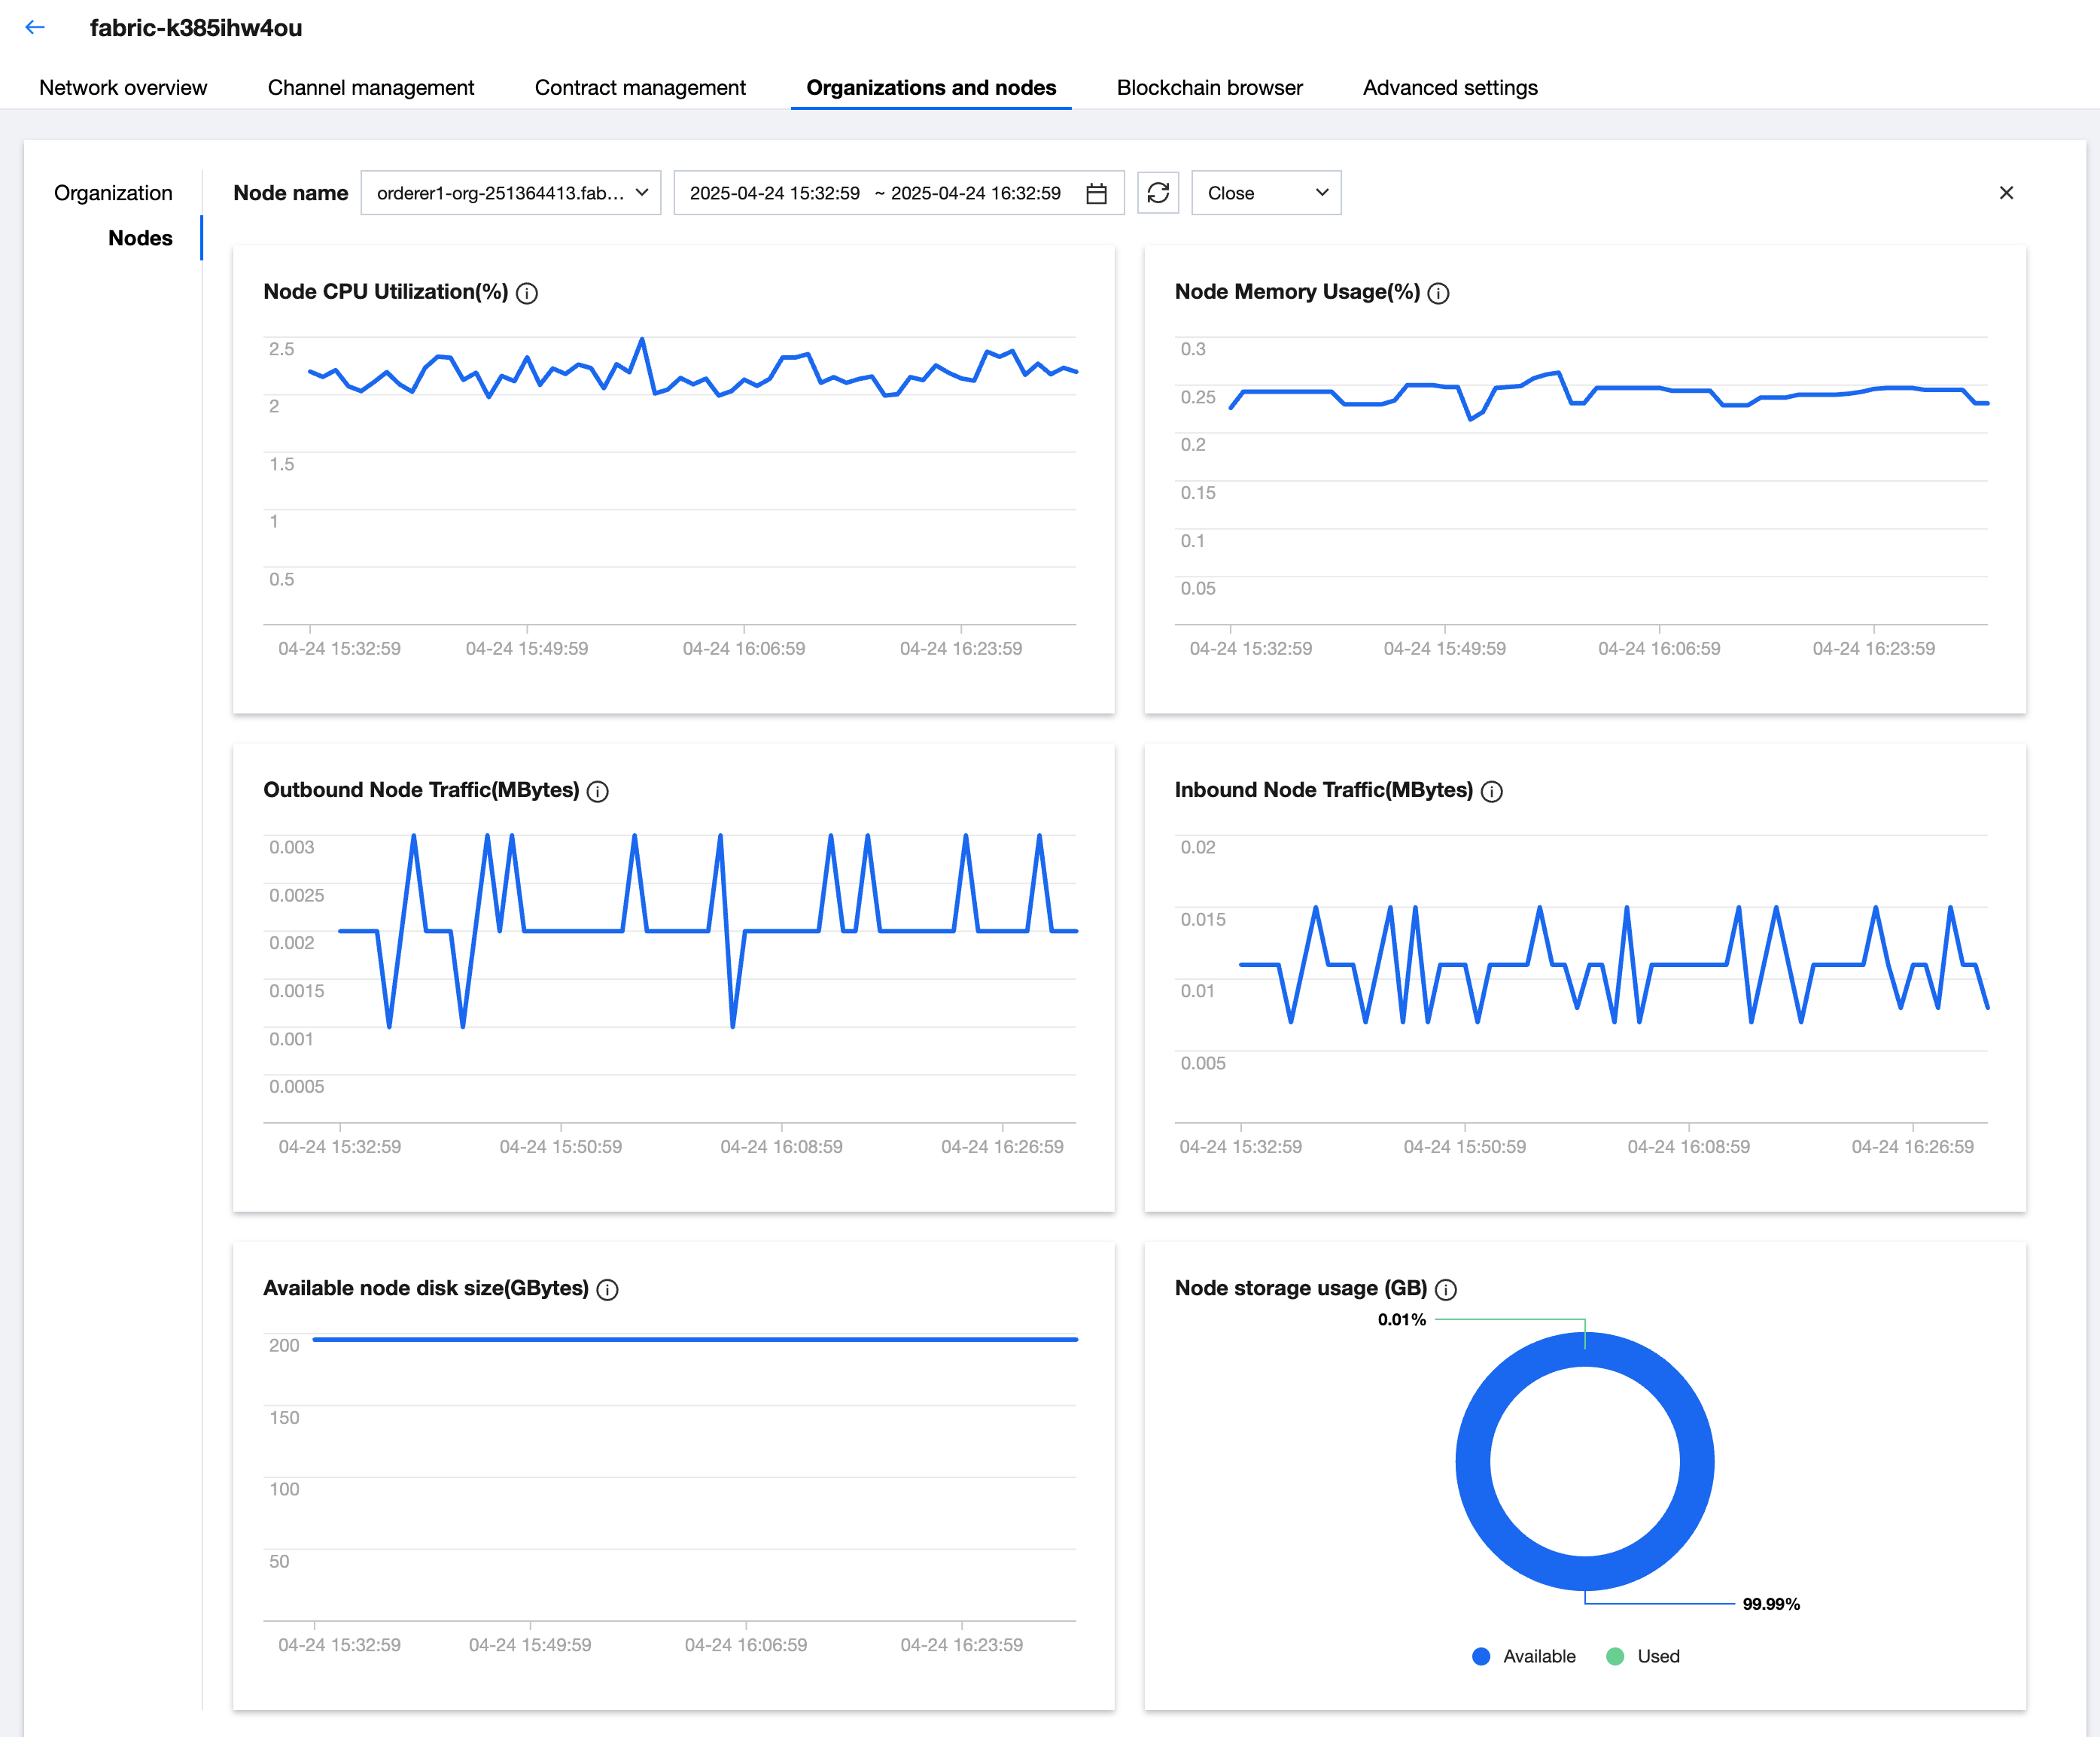
2. Select the "Organization and Node" - "Nodes" tab to enter the node list page. Click "Monitor" to enter the DashBoard panel to view node-related monitoring data, including CPU usage rate, memory usage rate, node inbound traffic, node outbound traffic and other indicators. As shown below:
View Node Logs
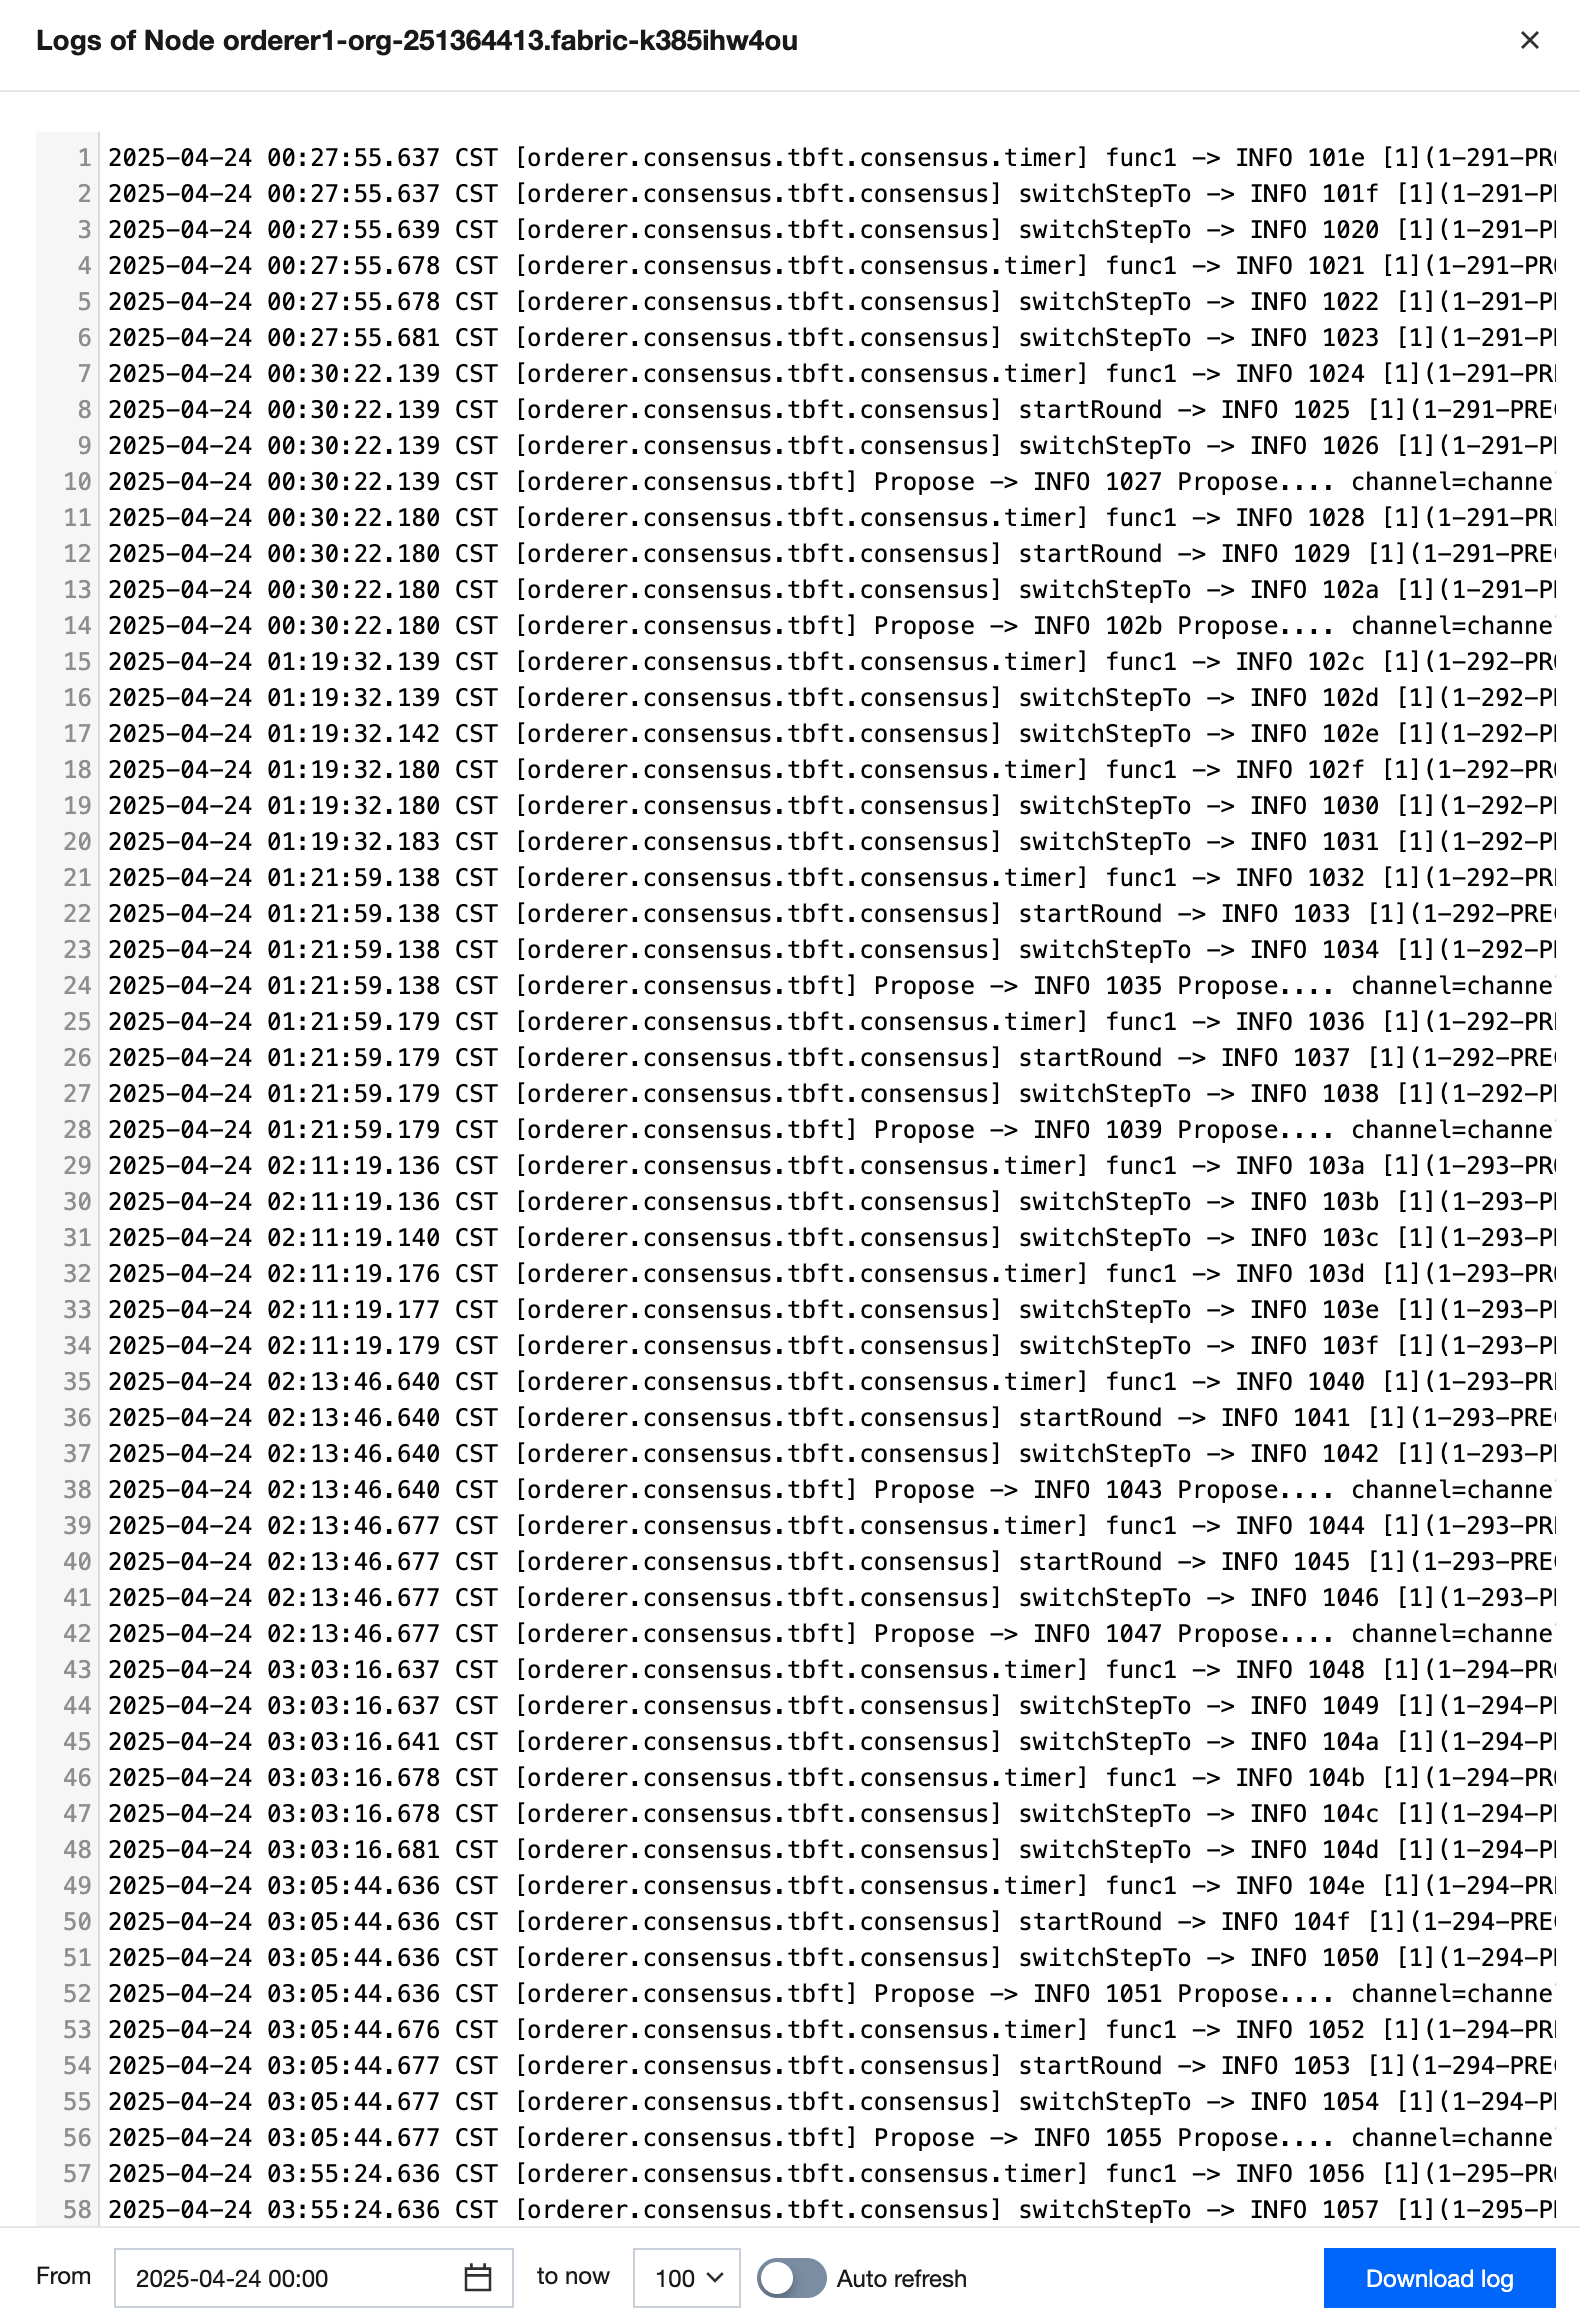
On the node list page, click "Logs" and a pop-up window will appear on the right, showing detailed node operation log information. It supports time filtering and downloading of logs. As shown below: