Monitoring Features
TencentDB for Tendis provides a complete and easy-to-use monitoring service where you don’t have to worry about, for example, collecting monitoring data or OPS of the monitoring system. The monitoring service includes Proxy monitoring, Redis monitoring, and Tendis monitoring which summarizes the monitoring data of an entire instance. Details are as follows:
Proxy monitoring: provides monitoring information of all Proxy nodes in an instance. TencentDB for Tendis instances in standard or cluster architecture have Proxy nodes.
Redis monitoring: provides monitoring information of TencentDB for Tendis primary and secondary nodes.
Tendis monitoring: summarizes the monitoring data of an entire instance (including Proxy nodes and Tendis nodes) and aggregates data according to the SUM, AVG, MAX, and LAST aggregation algorithms.

Monitoring Granularity and Monitoring Data Retention Period
Tendis currently supports monitoring metrics at the 1-minute, 5-minutes, 1-hour, or 1-day granularity. For the retention period of monitoring data at each granularity, please see Use Limits.
Viewing Monitoring Information
You can view TencentDB for Tendis monitoring information in the instance list and on the instance monitoring page in the TencentDB for Tendis console, or in the Cloud Monitor console.
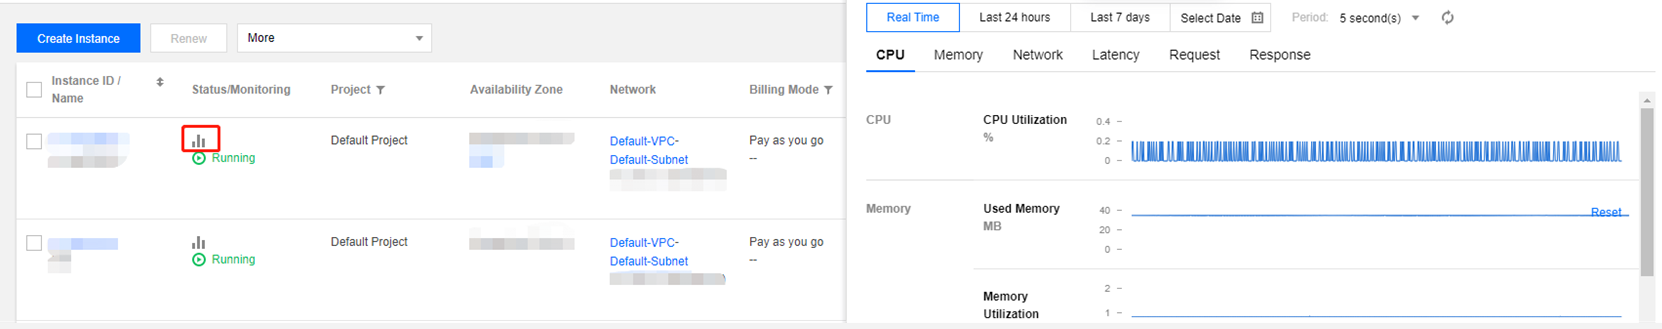
Instance list: log in to the TencentDB for Tendis console, click the View Monitoring icon in the instance list as shown below, and view monitoring metrics in the pop-up window on the right.
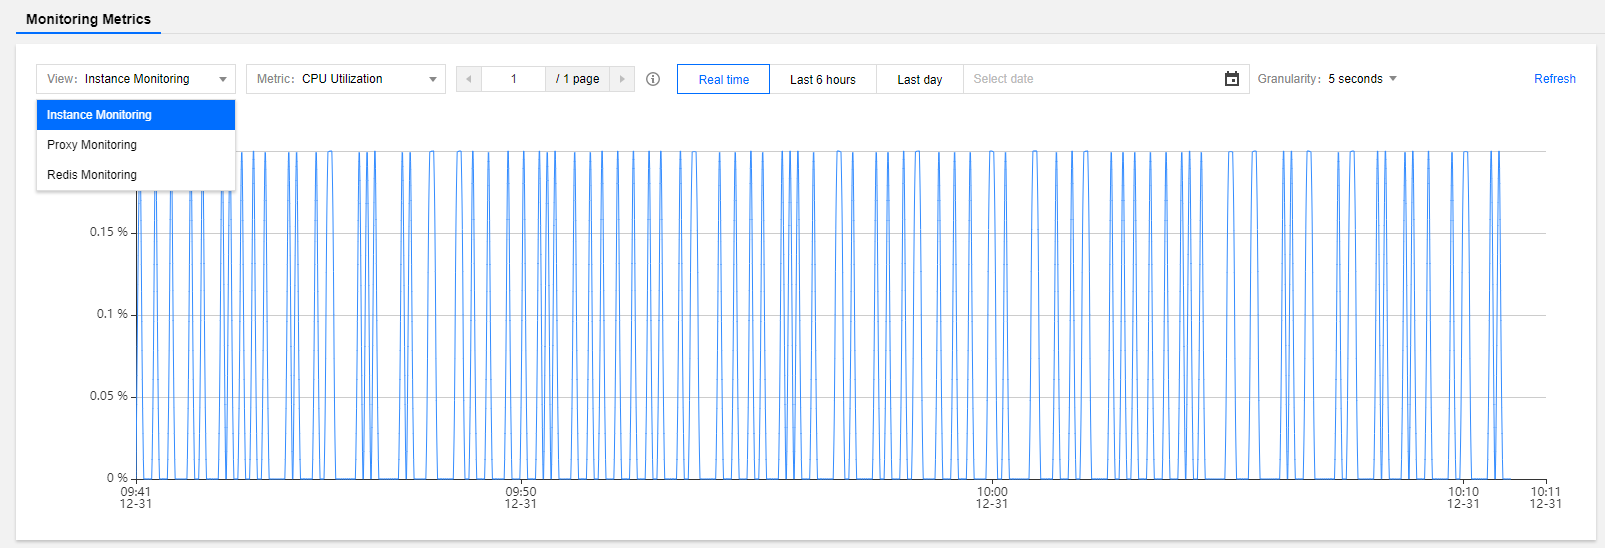
Instance monitoring page: log in to the TencentDB for Tendis console, click an instance ID in the instance list and enter the instance management page, select System Monitoring, and view monitoring data on the Monitoring Metrics tab.
Monitoring Metric Description
Proxy monitoring
Each Tendis instance contains at least 3 Proxy nodes. Generally, the number of Proxy nodes is 1.5 times that of Tendis nodes. The Proxy node supports the following monitoring metrics:
Category | Metric | Parameter | Unit | Description |
CPU | CPU utilization | cpu_util | % | Proxy CPU utilization |
Request | Total requests | proxy_commands | requests/second | The number of Proxy command executions per second |
| Key requests | cmd_key_count | keys/second | The number of keys accessed by a command per second |
| Mget requests | cmd_mget | requests/second | The number of Mget command executions per second |
| Execution errors | cmd_err | errors/second | The number of Proxy command execution errors per second, for example, when a command does not exist, parameters are incorrect, etc. |
| Big value requests | cmd_big_value | requests/second | The number of executions of commands larger than 32 KB per second |
Network | Connections | connections | - | The number of TCP connections to an instance |
| Connection usage | connections_util | % | The ratio of the number of TCP connections to the maximum number of connections |
| Inbound traffic | in_flow | MB/s | Private network inbound traffic |
| Inbound traffic utilization | in_bandwidth_util | % | The ratio of the actually used private inbound traffic to the maximum traffic |
| Inbound traffic limit count | in_flow_limit | - | The number of times inbound traffic triggers a traffic limit |
| Outbound traffic | out_flow | MB/s | Private network outbound traffic |
| Outbound traffic utilization | out_bandwidth_util | % | The ratio of the actually used private outbound traffic to the maximum traffic |
| Outbound traffic limit count | out_flow_limit | - | The number of times outbound traffic triggers a traffic limit |
Latency | Average execution latency | latency_avg | ms | The average execution latency from Proxy to Redis server |
| Max execution latency | latency_max | ms | The maximum execution latency from Proxy to Redis server |
| Average read latency | latency_read | ms | The average execution latency of read commands from Proxy to Redis server. For more information about read command types, please see Command types. |
| Average write latency | latency_write | ms | The average execution latency of write commands from Proxy to Redis server. For more information about write command types, please see Command types. |
| Average latency of other commands | latency_other | ms | The average execution latency of commands other than read and write commands from Proxy to Redis server |
Redis monitoring
The Redis node monitoring includes monitoring information of all primary nodes and secondary nodes in an instance or a cluster. The following monitoring metrics are supported.
Category | Metric | Parameter | Unit | Description |
CPU | CPU utilization | cpu_util | % | Average CPU utilization |
Network | Connections | connections | - | The number of connections from Proxy to a node |
| Connection usage | connections_util | % | The connection usage of a node |
Memory | Used memory | mem_used | MB | Memory capacity actually used, including data and cache |
| Memory utilization | mem_util | % | The ratio of the memory actually used to the total memory requested |
| Keys | keys | - | Total number of keys stored in an instance (first-level keys) |
| Expired keys | expired | - | The number of keys expired in a time window, which is equal to the value of `expired_keys` output by the `info` command |
| Evicted keys | evicted | - | The number of keys evicted in a time window, which is equal to the value of `evicted_keys` output by the `info` command |
| Replication delay | repl_delay | Byte | The command delay between the secondary node and the primary node |
Request | Total requests | commands | queries/second | QPS, that is, the number of command executions per second |
| Read requests | cmd_read | requests/second | The number of read command executions per second. For more information about read command types, please see Command types. |
| Write requests | cmd_write | requests/second | The number of write command executions per second. For more information about write command types, please see Command types. |
| Other requests | cmd_other | requests/second | The number of command (excluding write and read commands) executions per second |
Response | Slow queries | cmd_slow | - | The number of command executions with a latency greater than the `slowlog-log-slower-than` configuration |
| Read request hits | cmd_hits | - | The number of keys successfully requested by read commands, which is equal to the value of the `keyspace_hits` metric output by the `info` command |
| Read request misses | cmd_miss | - | The number of keys unsuccessfully requested by read commands, which is equal to the value of the `keyspace_misses` metric output by the `info` command |
| Read request hit rate | cmd_hits_ratio | % | Key hits/(Key hits + Key misses). This metric reflects the cache miss situation. |
Tendis monitoring
The Tendis monitoring includes all monitoring data of an instance, including the monitoring data of Proxy nodes and Redis nodes, which is aggregated by the SUM, AVG, MAX, and LAST algorithms.
Category | Metric | Associated Node View | Parameter | Unit | Description |
CPU | CPU utilization | Tendis node | cpu_util | % | Average CPU utilization |
| Max CPU utilization of a node | Tendis node | cpu_max_util | % | The maximum CPU utilization of a node (shard or replica) in an instance |
Memory | Used memory | Tendis node | mem_used | MB | Memory capacity actually used, including data and cache |
| Memory utilization | Tendis node | mem_util | % | The ratio of the memory actually used to the total memory requested |
| Max memory utilization of a node | Tendis node | mem_max_util | % | The maximum memory utilization of a node (shard or replica) in an instance |
| Keys | Tendis node | keys | - | Total number of keys stored in an instance (first-level keys) |
| Expired keys | Tendis node | expired | - | The number of keys expired in a time window, which is equal to the value of `expired_keys` output by the `info` command |
| Evicted keys | Tendis node | evicted | - | The number of keys evicted in a time window, which is equal to the value of `evicted_keys` output by the `info` command |
Network | Connections | Proxy node | connections | - | The number of TCP connections to an instance |
| Connection usage | Proxy node | connections_util | % | The ratio of the number of TCP connections to the maximum number of connections |
| Inbound traffic | Proxy node | in_flow | MB/s | Private network inbound traffic |
| Inbound traffic utilization | Proxy node | in_bandwidth_util | % | The ratio of the actually used private inbound traffic to the maximum traffic |
| Inbound traffic limit count | Proxy node | in_flow_limit | - | The number of times inbound traffic triggers a traffic limit |
| Outbound traffic | Proxy node | out_flow | MB/s | Private network outbound traffic |
| Outbound traffic utilization | Proxy node | out_bandwidth_util | % | The ratio of the actually used private outbound traffic to the maximum traffic |
| Outbound traffic limit count | Proxy node | out_flow_limit | - | The number of times outbound traffic triggers a traffic limit |
| Average execution latency | Proxy node | latency_avg | ms | Average execution latency from Proxy to Redis server |
| Max execution latency | Proxy node | latency_max | ms | Maximum execution latency from Proxy to Redis server |
| Average read latency | Proxy node | latency_read | ms | The average execution latency of read commands from Proxy to Redis server. For more information about read command types, please see Command types. |
| Average write latency | Proxy node | latency_write | ms | The average execution latency of write commands from Proxy to Redis server. For more information about wirte command types, please see Command types. |
| Average latency of other commands | Proxy node | latency_other | ms | The average execution latency of commands other than read and write commands from Proxy to Redis server |
Request | Total requests | Tendis node | commands | requests/second | QPS, that is, the number of command executions per second |
| Read requests | Tendis node | cmd_read | requests/second | The number of read command executions per second. For more information about read command types, please see Command types. |
| Write requests | Tendis node | cmd_write | requests/second | The number of write command executions per second. For more information about write command types, please see Command types. |
| Other requests | Tendis node | cmd_other | requests/second | The number of command (excluding write and read commands) executions per second |
| Big value requests | Proxy node | cmd_big_value | requests/second | The number of executions of commands larger than 32 KB per second |
| Key requests | Proxy node | cmd_key_count | keys/second | The number of keys accessed by a command per second |
| Mget requests | Proxy node | cmd_mget | requests/second | The number of Mget command executions per second |
| Slow queries | Tendis node | cmd_slow | - | The number of command executions with a latency greater than the `slowlog-log-slower-than` configuration |
| Read request hits | Tendis node | cmd_hits | - | The number of keys successfully requested by read commands, which is equal to the value of the `keyspace_hits` metric output by the `info` command |
| Read request misses | Tendis node | cmd_miss | - | The number of keys unsuccessfully requested by read commands, which is equal to the value of the `keyspace_misses` metric output by the `info` command |
| Execution errors | Proxy node | cmd_err | - | The number of command execution errors, for example, when a command does not exist, parameters are incorrect, etc. |
| Read request hit rate | Tendis node | cmd_hits_ratio | % | Key hits/(Key hits + Key misses). This metric reflects the cache miss situation. |
Command types
Type | Commands |
Read command | get, strlen, exists, getbit, getrange, substr, mget, llen, lindex, lrange, sismember, scard, srandmember, sinter, sunion, sdiff, smembers, sscan, zrange, zrangebyscore, zrevrangebyscore, zrangebylex, zrevrangebylex, zcount, zlexcount, zrevrange, zcard, zscore, zrank, zrevrank, zscan, hget, hmget, hlen, hstrlen, hkeys, hvals, hgetall, hexists, hscan, randomkey, keys, scan, dbsize, type, ttl, touch, pttl, dump, object, memory, bitcount, bitpos, georadius_ro, georadiusbymember_ro, geohash, geopos, geodist, pfcount |
Write command | set, setnx, setex, psetex, append, del, unlink, setbit, bitfield, setrange, incr, decr, rpush, lpush, rpushx, lpushx, linsert, rpop, lpop, brpop, brpoplpush, blpop, lset, ltrim, lrem, rpoplpush, sadd, srem, smove, spop, sinterstore, sunionstore, sdiffstore, zadd, zincrby, zrem, zremrangebyscore, zremrangebyrank, zremrangebylex, zunionstore, zinterstore, hset, hsetnx, hmset, hincrby, hincrbyfloat, hdel, incrby, decrby, incrbyfloat, getset, mset, msetnx, swapdb, move, rename, renamenx, expire, expireat, pexpire, pexpireat, flushdb, flushall, sort, persist, restore, restore-asking, migrate, bitop, geoadd, georadius, georadiusbymember, pfadd, pfmerge, pfdebug |
Help and Support
Was this page helpful?
You can also Contact sales or Submit a Ticket for help.
Help us improve! Rate your documentation experience in 5 mins.
Feedback