Monitoring is an important part of ensuring high reliability, high availability, and high performance for Cloud GPU Service. When a GPU is created, Tencent Cloud Observability Platform (TCOP) is enabled by default for free. You can view monitoring metrics via the console. For detailed information, see Monitoring and Alarm Overview. NVIDIA GPU series instances additionally provide the capability to monitor GPU utilization, GPU memory usage, power consumption, temperature and more.
Public images: The CVM monitoring component is included by default. You only need to install the GPU driver.
Imported images: You must manually install both the CVM monitoring component and the GPU driver.
Viewing GPU Metrics in the Console
Click the monitor icon
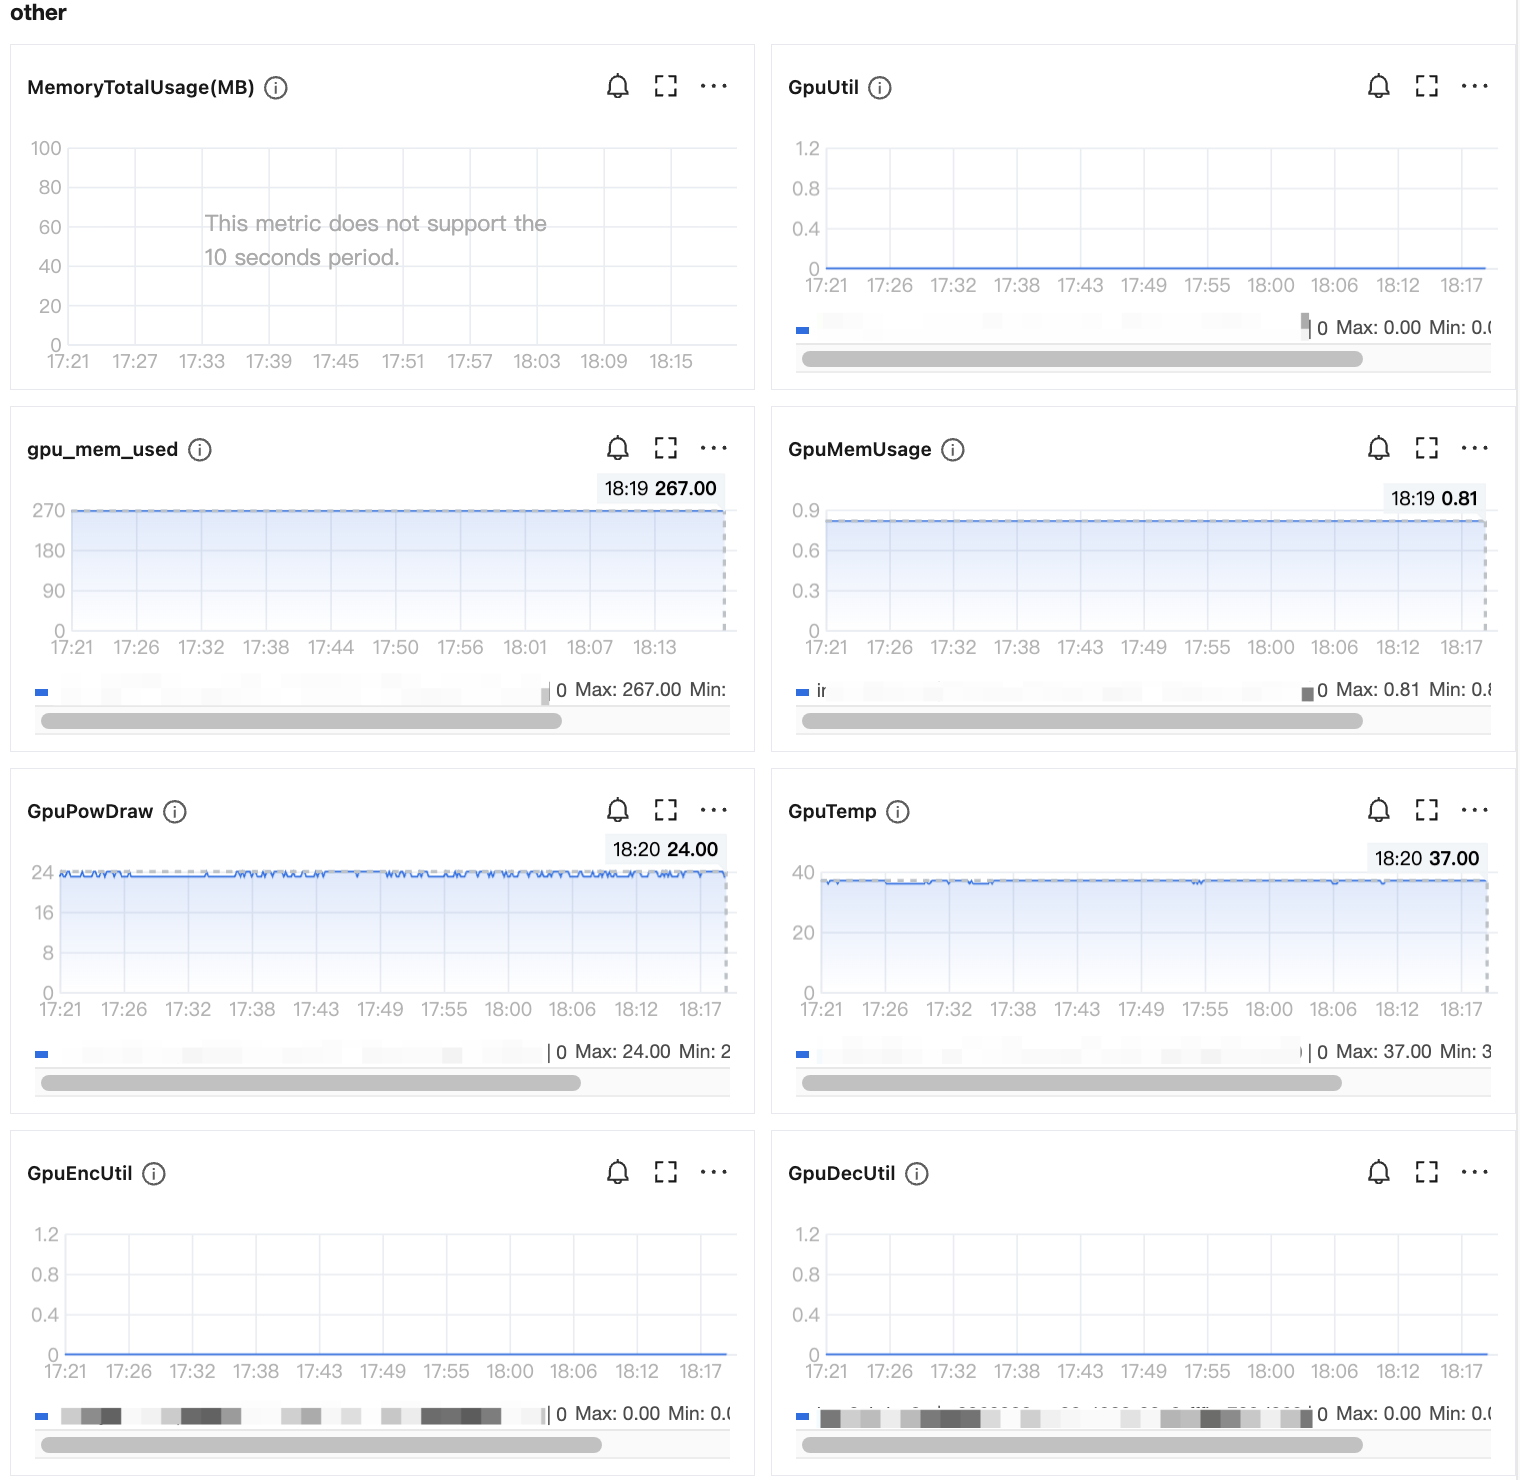
in the GPU list , access the monitoring page of the console GPU instance, view GPU metrics, hover the mouse over the metric curves to display the corresponding GPU device's BDF (Bus, Device, Function, the unique address of the device) and monitoring data. As shown below:
Metrics description:
Metric Name
Meaning
Unit
Level
GpuUtil
Evaluates compute capacity consumed by the workload (percentage of non-idle time)
%
per-GPU
gpu_mem_used
Evaluates the amount of GPU memory used by the workload
MB
per-GPU
GpuMemUsage
Evaluates GPU memory usage as a percentage of total GPU memory
1. Log in to TCOP, in the left sidebar choose Dashboard > Dashboard List.
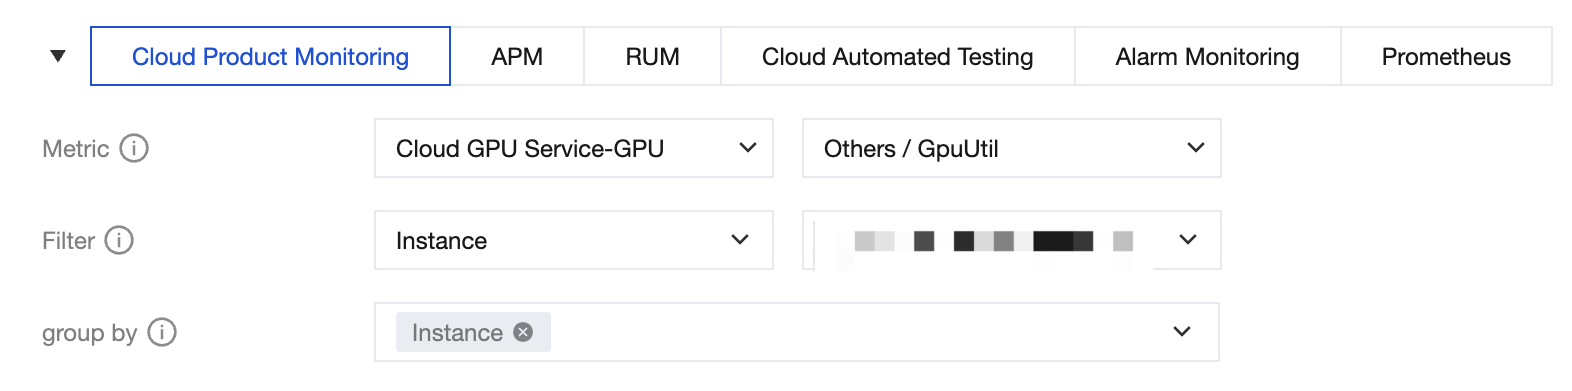
2. In the Dashboard list, choose Create Dashboard > Custom create, in the new Dashboard, select Create chart, at Metric, choose Cloud GPU Service-GPU, click the metrics you are interested in, customize the monitoring panel to display multiple instances, as shown in the figure below:
For details, see CVM, which provides the following metrics:
Metric Name
Metric Name
Metric Description
Unit
Level
GpuMemUsage
GPU memory utilization
GPU memory utilization
%
per-GPU
gpu_mem_used
GPU memory usage
Evaluates the amount of GPU memory used by the workload
MB
per-GPU
GpuPowdraw
GPU power usage
GPU power draw
W
per-GPU
GpuTemp
GPU temperature
Evaluates GPU thermal status
°C
per-GPU
GpuUtil
GPU utilization
Evaluates compute capacity consumed by the workload (percentage of non-idle time)
%
per-GPU
GpuEncUtil
GPU encoder utilization
GPU encoder utilization
%
per-GPU
GpuDecUtil
GPU decoder utilization
GPU decoder utilization
%
per-GPU
Note:If no monitoring data is available, consider the following possibilities:
Only NVIDIA GPU instances are supported.
GPU driver or monitoring components are not installed.
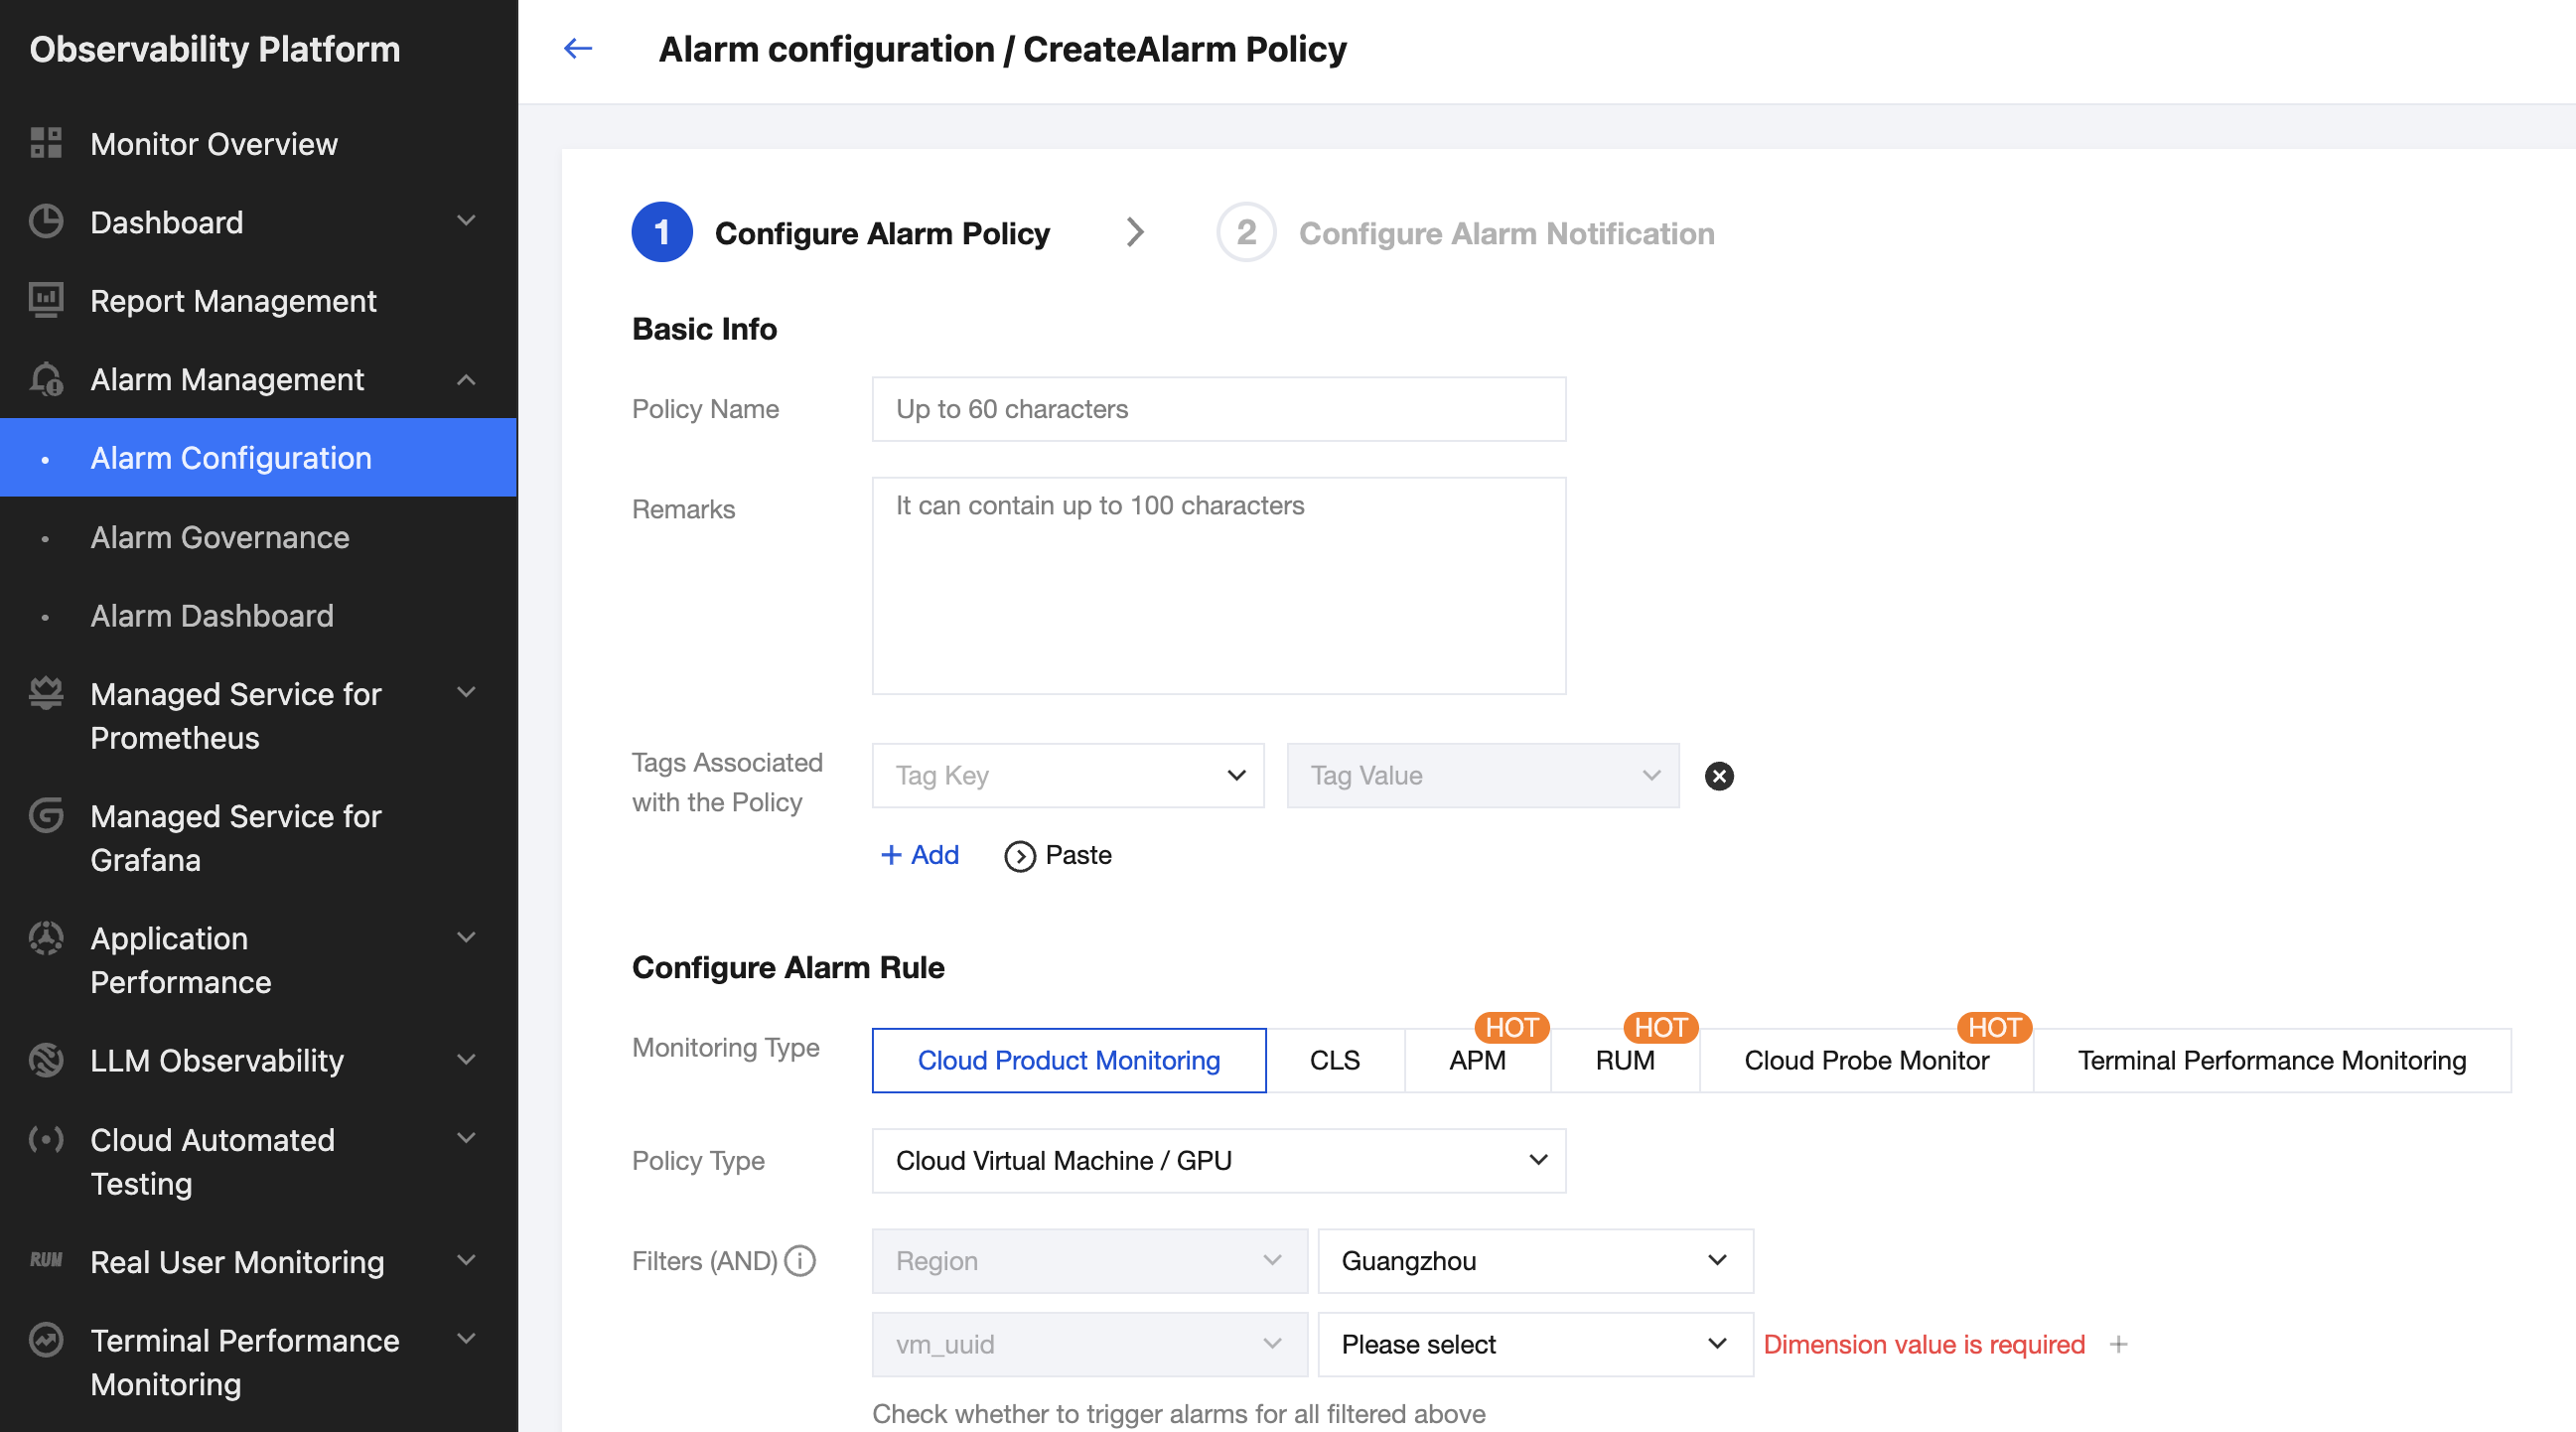
1. Log in to TCOP, in the left navigation bar, select Alarm Management > Alarm Configuration.
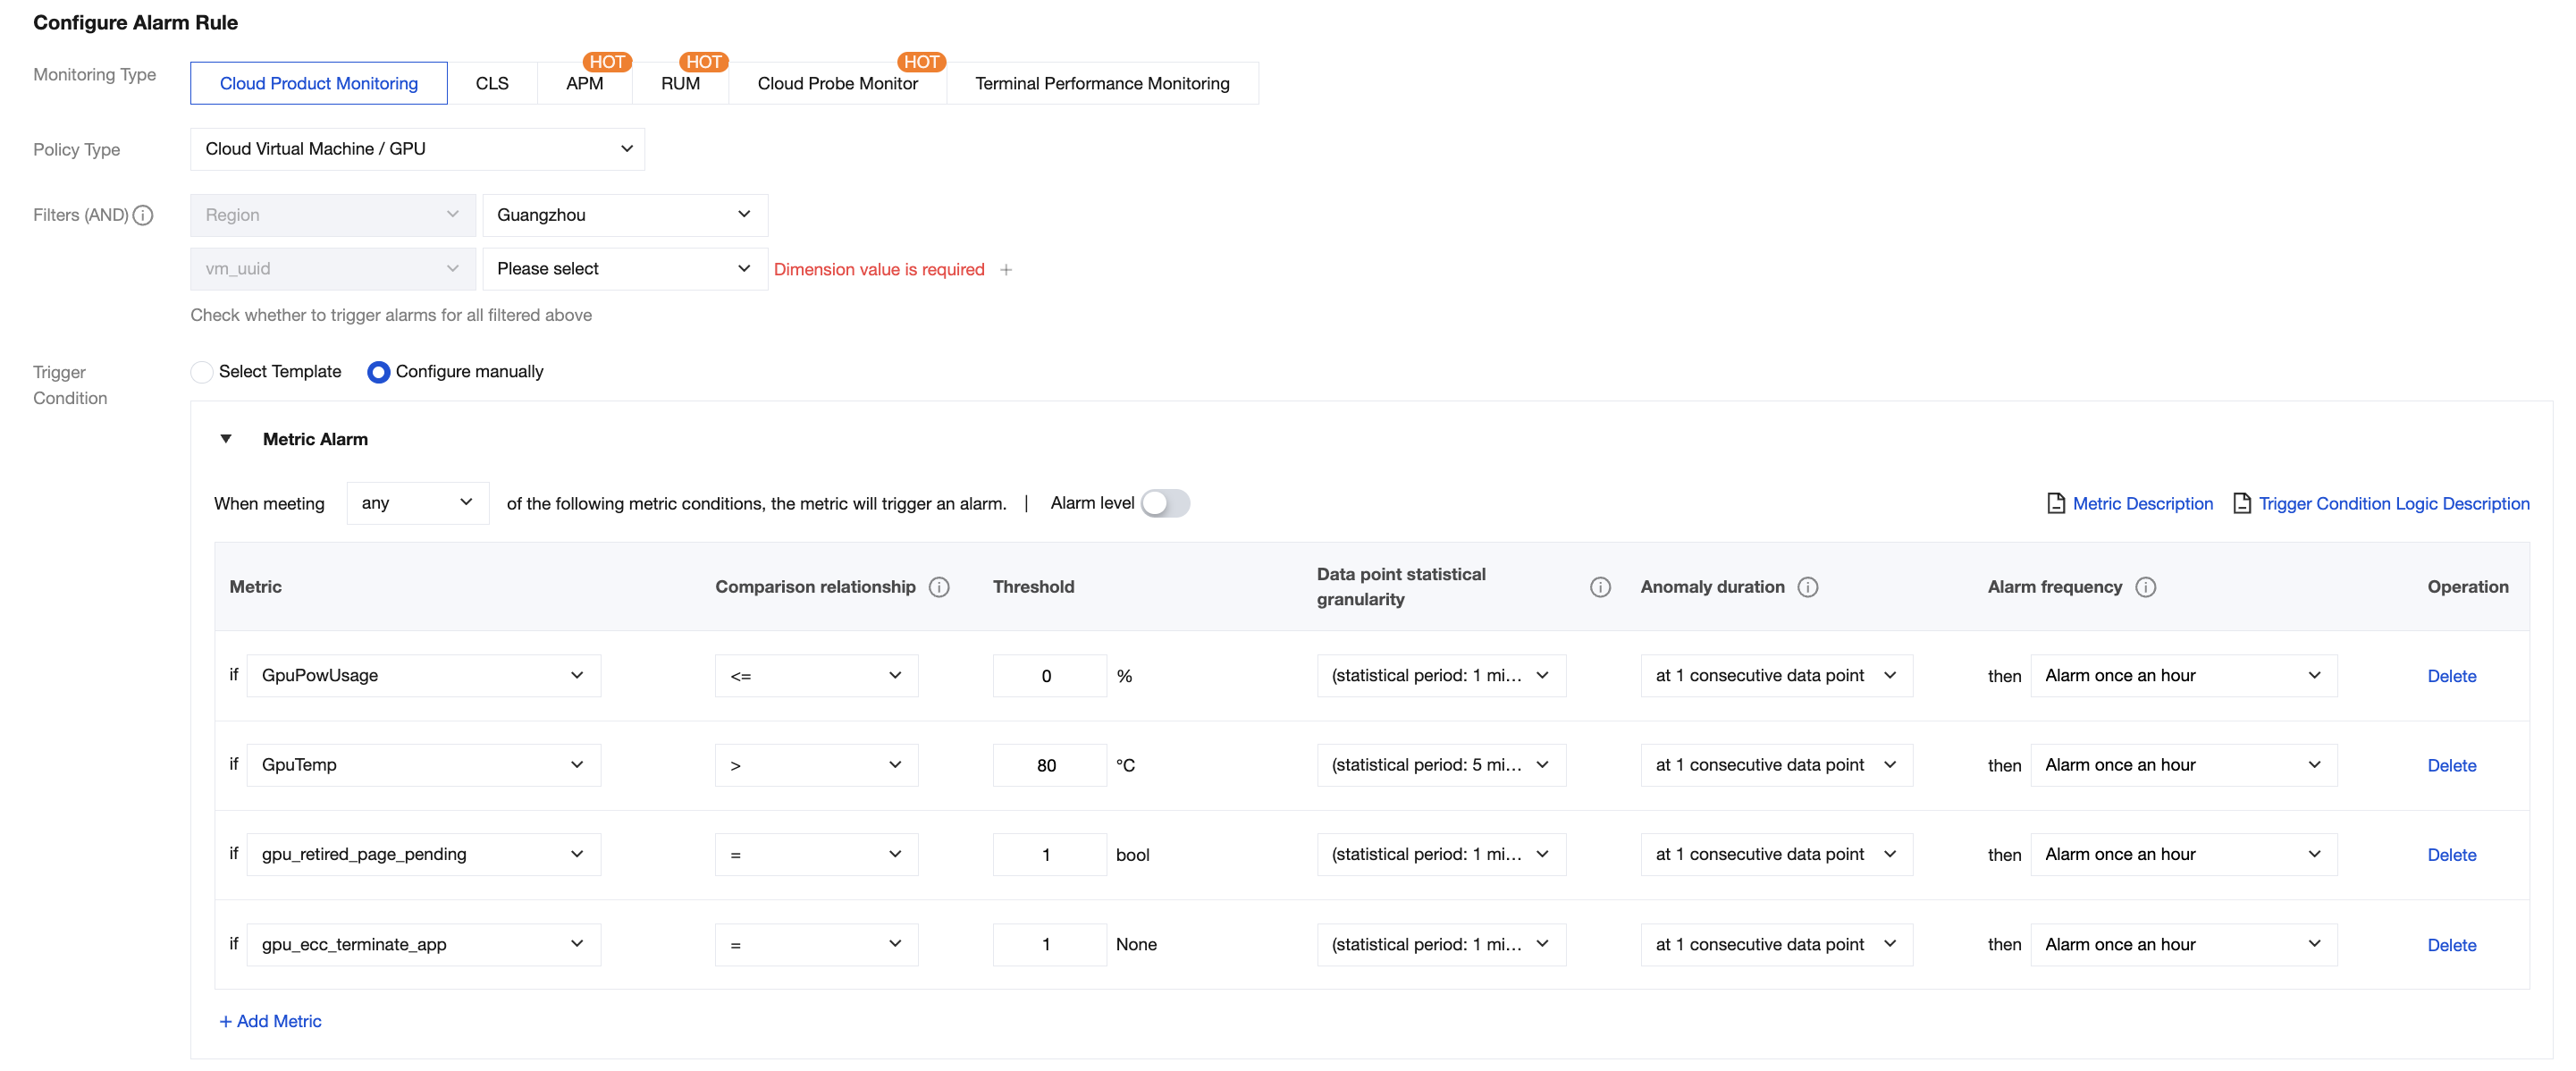
2. Click Create Policy. Under Monitoring Type, select Cloud Product Monitoring. Under Policy Type, select Cloud Virtual Machine / GPU. Select the Cloud GPU Service instance objects for which you want to receive alarms, and set Trigger Condition to Configure manually.
3. Monitoring for Cloud GPU Service supports alarms for the following metrics: GPU Memory Usage, GPU Power Usage, GPU Utilization, GPU Temperature, GPU Retired Pages (existence of memory pages requiring isolation), GPU Uncorrectable ECC Error (UCE), etc. You can refer to the figure below to configure alarms. For the configuration of alarm notifications, please refer to Creating Notification Template, which supports notifications via multiple channels.
Common alarm metrics reference is as follows:
Metric Name
Recommended Alarm Threshold
Description
Suggested Action
GPUPowUsage
<= 0
When power usage is less than 0, it indicates a potential "Unknown Error" in power reading, which will affect normal GPU operation.
Run the nvidia-smi command to check if the GPU power displays ERR, or run nvidia-smi -i <target gpu> -q |grep "Power Draw" to check if it shows Unknown Error.
If this occurs, try restarting the machine to recover and update the driver to monitor the status. If the issue persists after the restart, Submit a Ticket to contact Tencent Cloud support.
GPUTemp
> 80 (Sustained for 5 minutes)
Excessive GPU temperature may cause GPU SlowDown, impacting business performance.
High load may cause high GPU temperature. Try restarting the instance to recover. If it cannot be recovered, Submit a Ticket to contact Tencent Cloud support.
gpu_retired_page_pending
= 1
Pre-Ampere architecture GPUs experienced an ECC ERROR, application processes were killed, and the GPU card is in a pending state.
Run the nvidia-smi -i <target gpu> -q -d PAGE_RETIREMENT command to check if any GPU card is in a pending state. Reset the GPU card or restart the instance to recover. If restarting does not resolve the issue, Submit a Ticket to contact Tencent Cloud support.
gpu_ecc_teminate_app
= 1
Ampere and later architecture GPUs experienced an ECC ERROR, application processes were killed, and the GPU card is in a pending state.
Run the nvidia-smi -i <target gpu> -q -d ROW_REMAPPER command to check if any GPU card is in a Pending state. Reset the GPU card or restart the instance to recover. If restarting does not resolve the issue, Submit a Ticket to contact Tencent Cloud support.
GPUMemUsage
Monitor only
-
Evaluate the impact of the load on video memory usage.
GPU Utili
Monitor only
-
Evaluate the impact of the load on GPU streaming multiprocessor usage.
Warning: Restarting the instance may interrupt your business. Please evaluate the operation carefully. For details, please refer to the Restarting Instances.