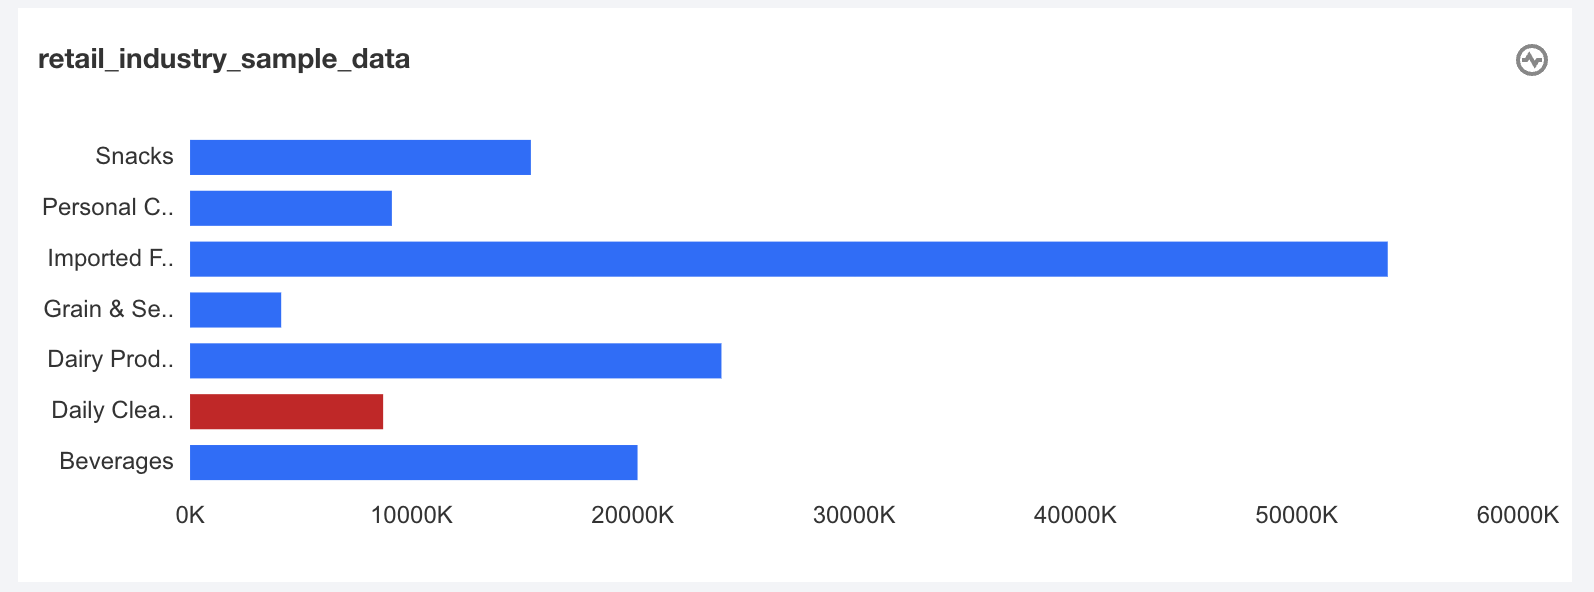
When displaying data, you may need to highlight a specific object. As shown in the legend below, special attention is given to a certain dimension value by annotating it with a special color.
In Business Intelligence (BI), the dimension value coloring feature allows you to set colors for specified dimension values to highlight specified objects.
Edition support: Personal Edition, Basic Edition, and Professional Edition.
Through this document, you will learn the following:
Setup Process of Dimension Value Coloring
Dimension Value Coloring Settings in Multi-metric Scenarios
Copying of Dimension Value Coloring Settings
Batch Applications of Coloring Settings
Setup Process of Dimension Value Coloring
1. Go to the edit page, and add a bar chart component. Set the dimension field and metric field.
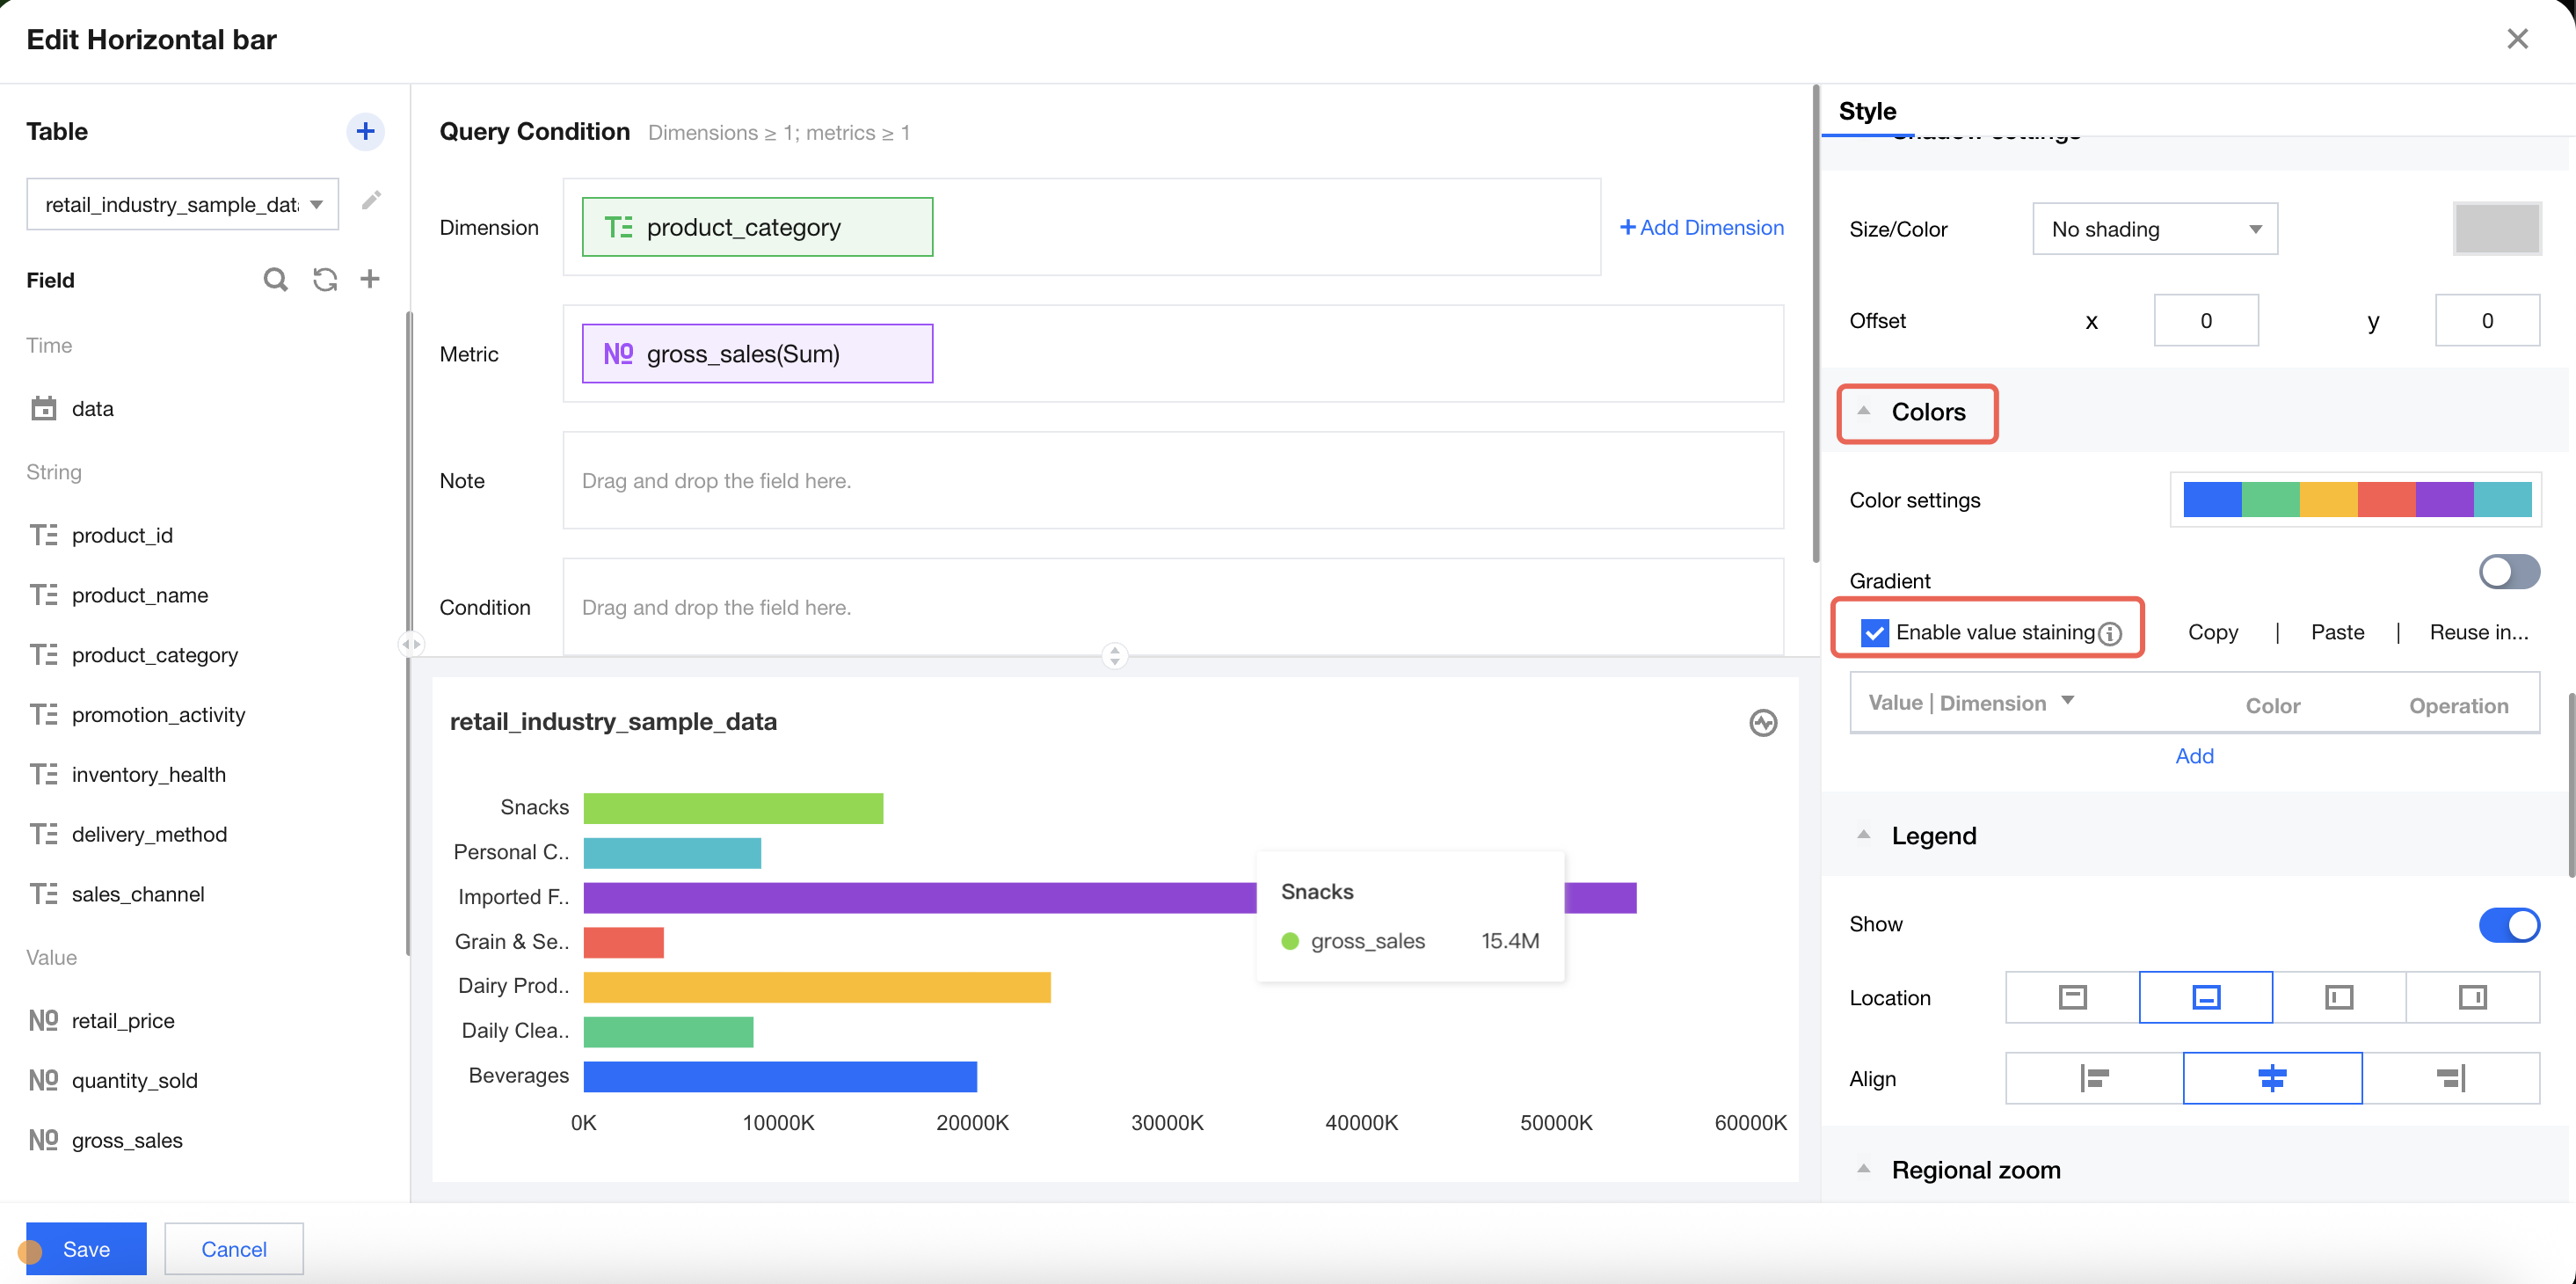
2. In the "Style" settings panel, unfold the "Chart Color Scheme" section and select "Enable Value Staining".
Note:
If dimension value coloring is enabled, the legend will automatically become invalid.
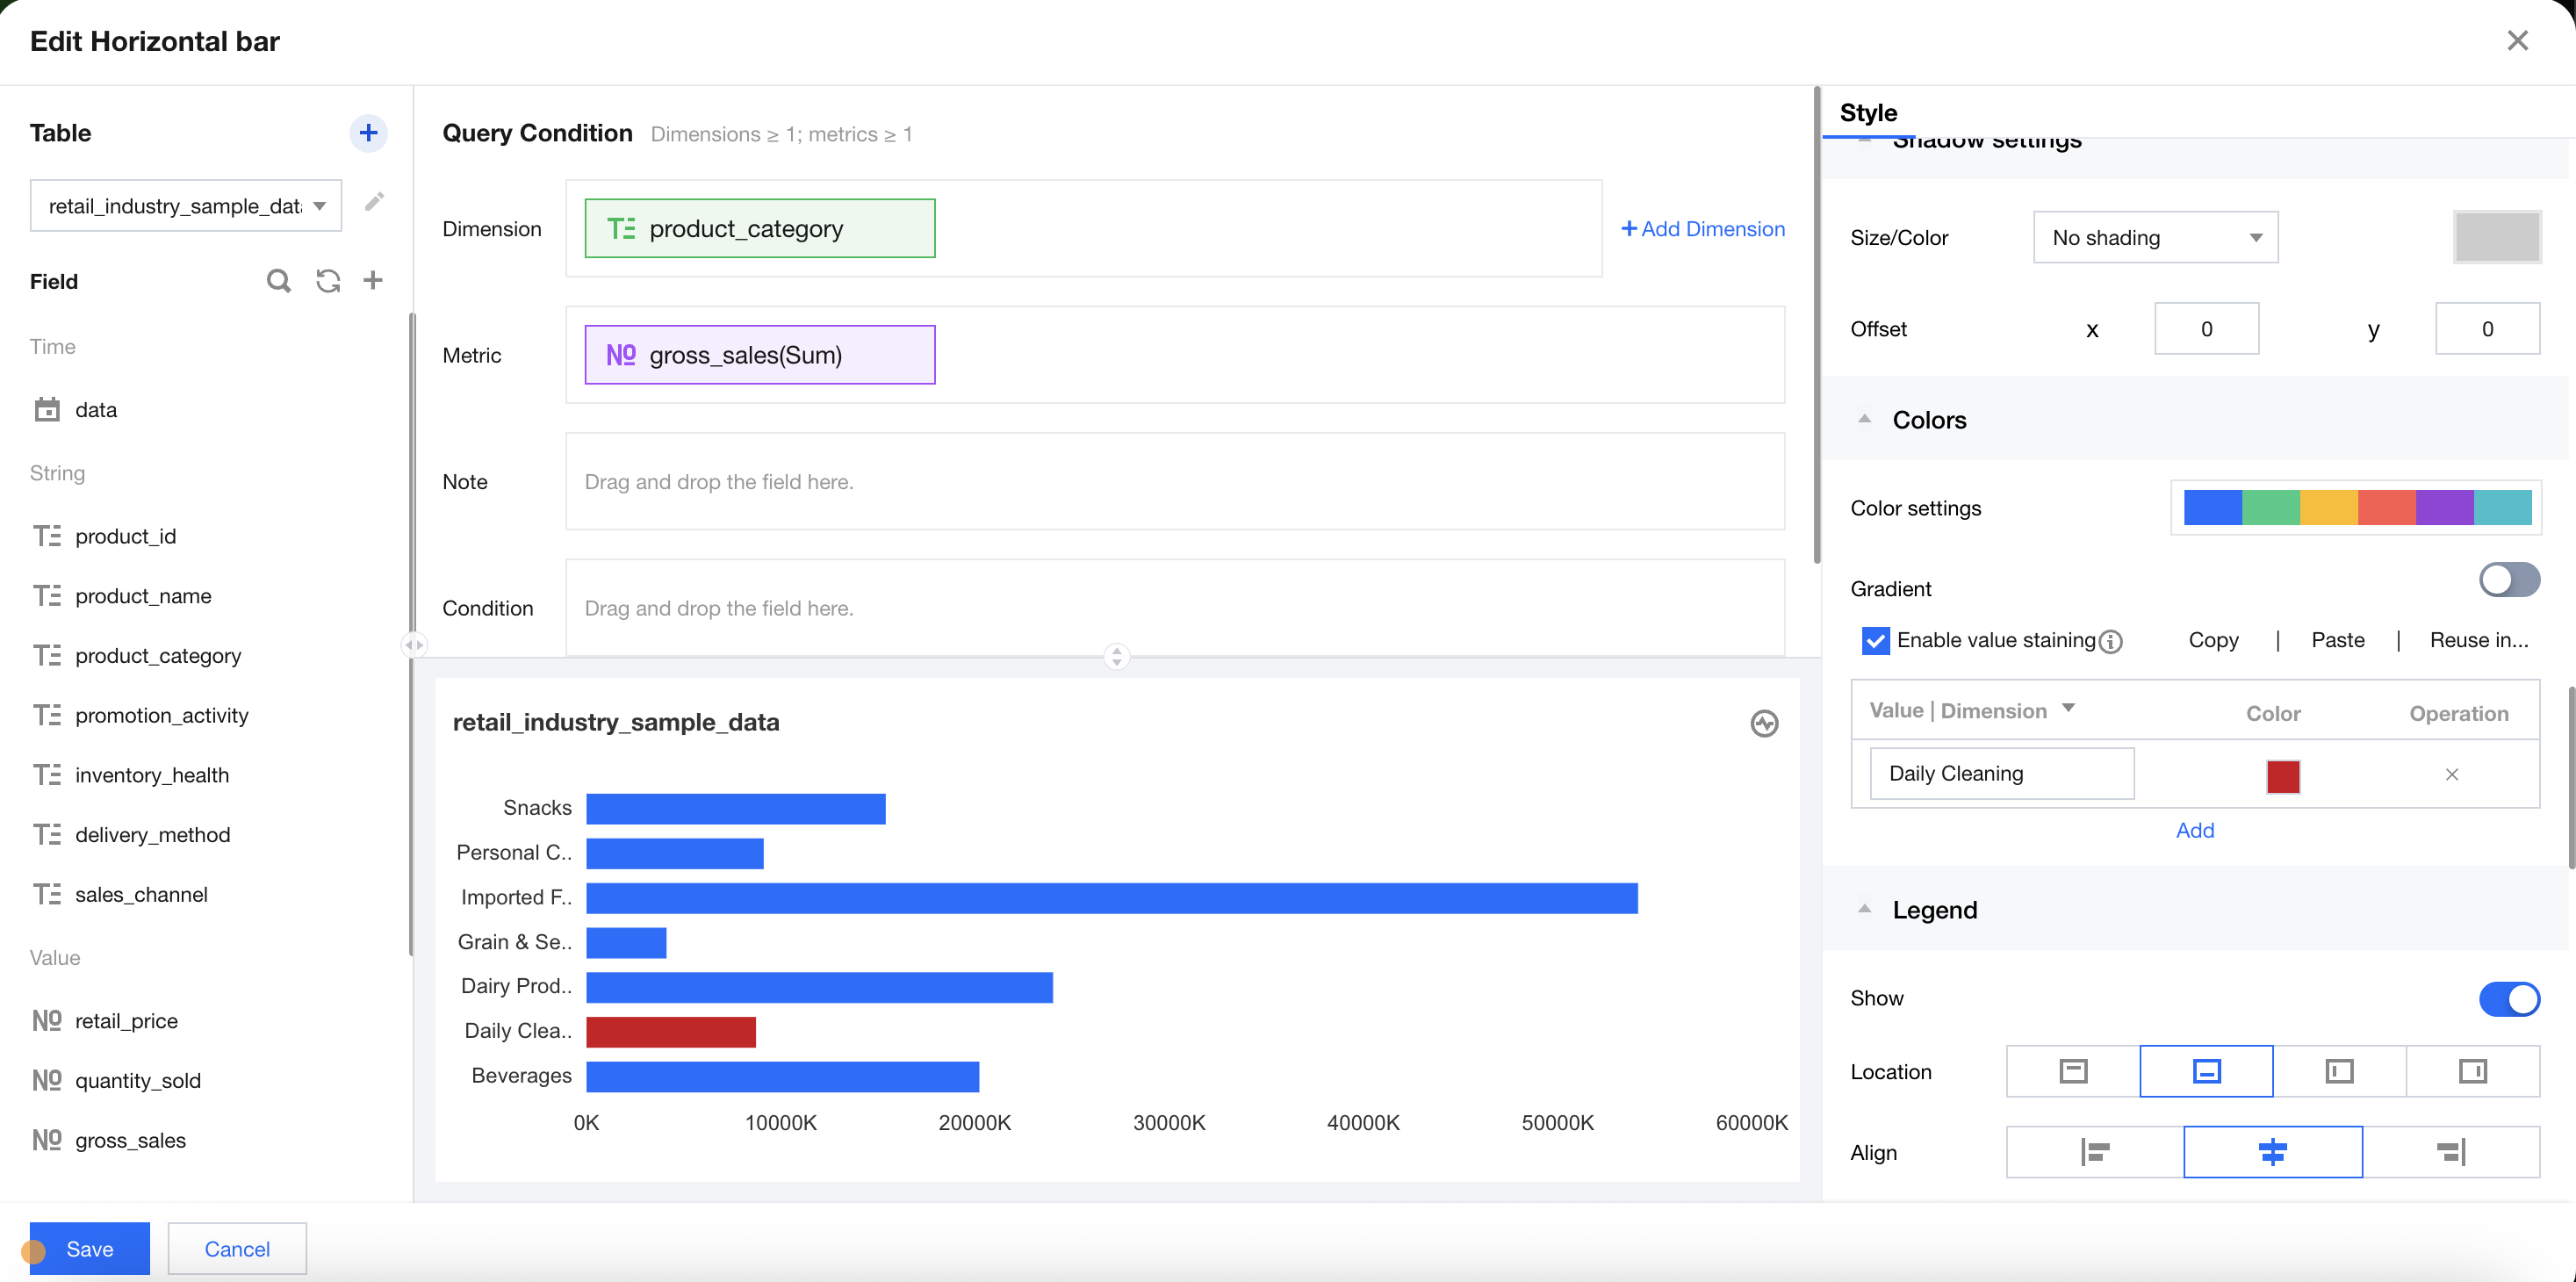
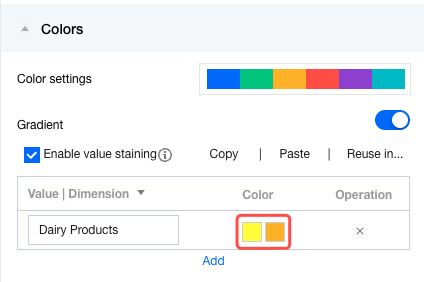
3. Click +Add to add a dimension value setting item, and modify the dimension value name to "Backend Support Group".
You can also click "X" to delete a dimension value setting.
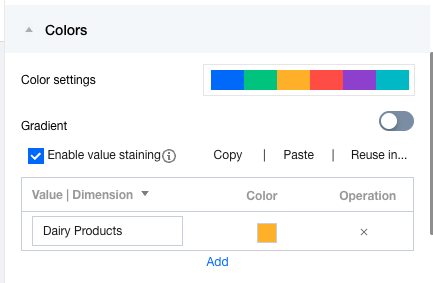
4. Click the color block to set the color. If "gradient" is enabled, you can set the start and end colors.
5. The following tips can help you better use dimension value coloring:
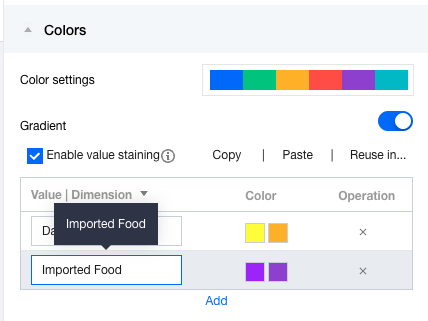
If you need to assign the same color to multiple dimension values, such as assigning "backend support group" and "planning operations group" with the same color, you can concatenate the two dimension values with ",", as shown in the figure below:
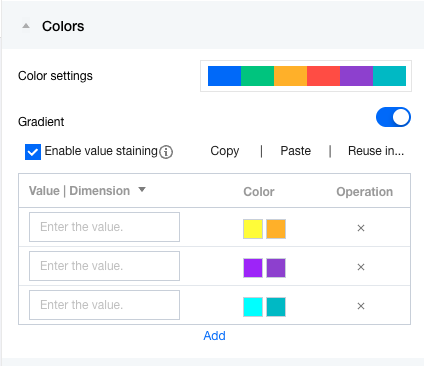
If you need to color the next dimension value (unknown dimension value), such as assigning colors to the top 3 departments, you can leave the dimension values blank to color the top 3, as shown in the figure below:
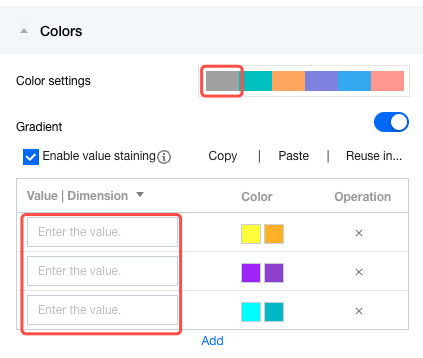
By setting "color configuration", you can configure defaults for other dimension values. For example, to assign colors to the top 3 dimension values with dimension value coloring and assign gray uniformly to the rest, you can perform the settings as shown in the figure below:
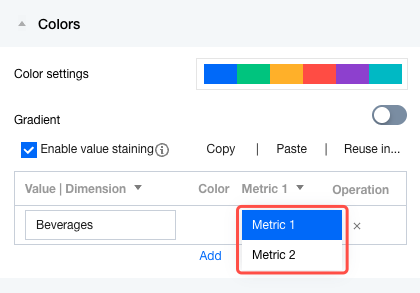
Dimension Value Coloring Settings in Multi-metric Scenarios
As shown in the column chart, the "backend support group" has 2 metrics, that is, "income" and "expense" (represented by 2 columns respectively), and each dimension value can be colored separately. As shown in the following figure, you can color different dimensions and metrics by switching metrics:
The specific metric field names are not displayed here to ensure the field settings can take effect normally when the metric fields are changed or copied to other charts.
When a metric field is deleted, the number of available metrics here will also decrease accordingly. For example, if 2 metric fields are originally available and one is deleted now, only one metric will be reserved for dimension value coloring here.
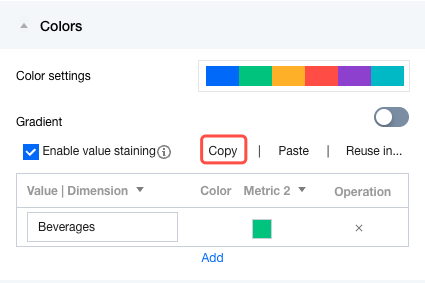
Copying of Dimension Value Coloring Settings
To copy the dimension value coloring settings of the current component to other components, you can use the copy and paste features.
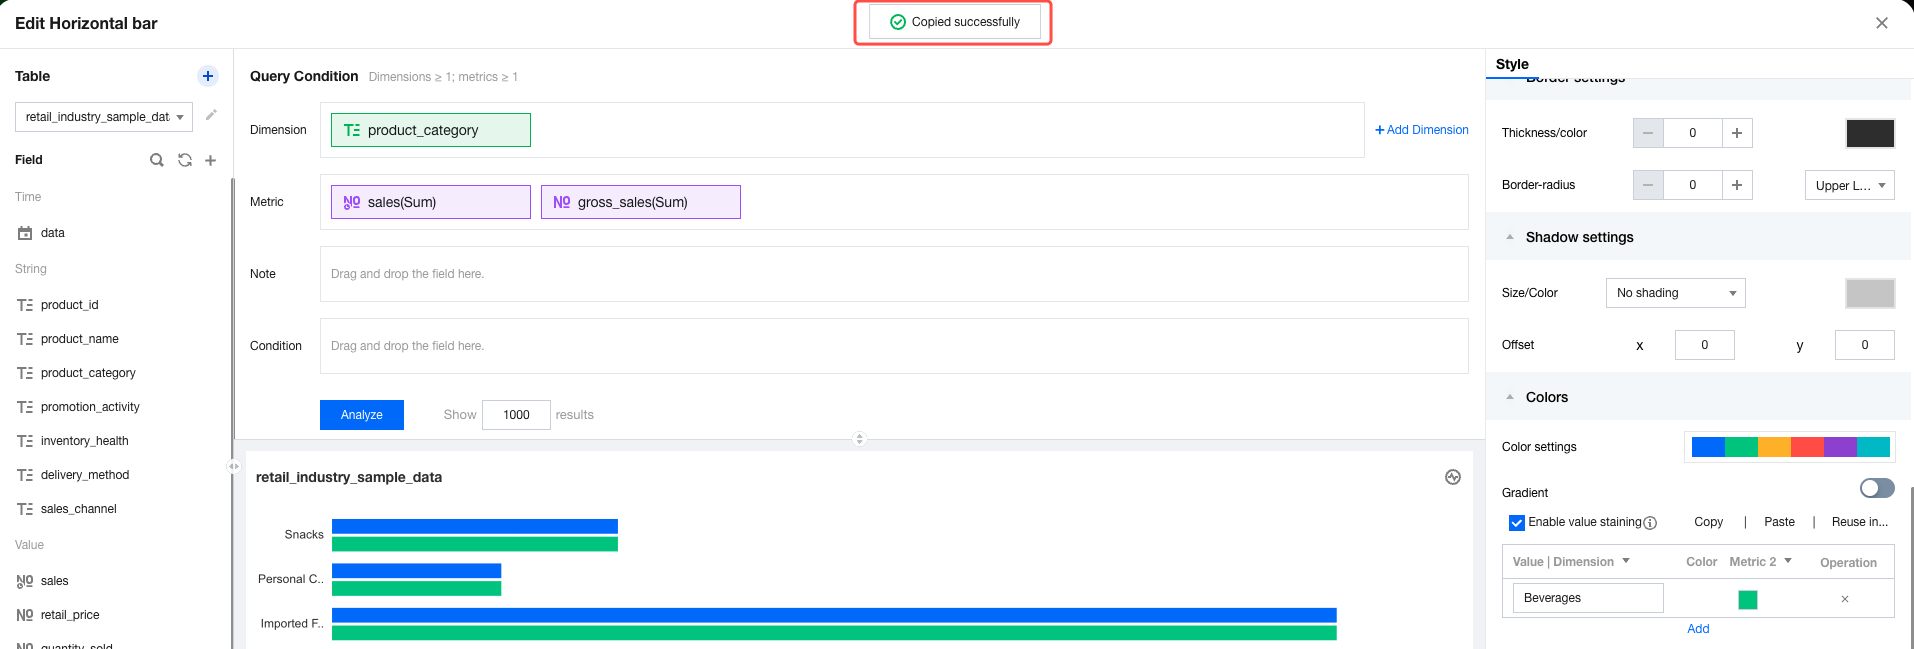
1. Complete dimension value coloring settings, then click Copy to copy the settings.
2. Go to the component that needs the settings, then click "Paste".
Note: A prompt indicating that the pasted settings will overwrite the existing settings appears. Click Continue Paste to overwrite the existing settings.
After overwriting, the dimension value settings will be copied to the desired component.
3. After copying dimension value coloring, if it does not take effect on the chart, follow these steps to troubleshoot and modify (assuming copying from Component A to Component B for clarity): check whether the dimension fields of Component A and Component B are the same.
If the dimension values are different, dimension value coloring will fail.
You can modify the dimension value to make the settings take effect again.
4. Check whether the number of metrics in Component A and Component B is the same.
Component A has 1 metric, and component B has 2 metrics. When copying dimension values from A to B, since A has 1 fewer metric field than B, the additional metric in B has no dyeing settings.
You can switch metrics to generate dyeing settings for component B.
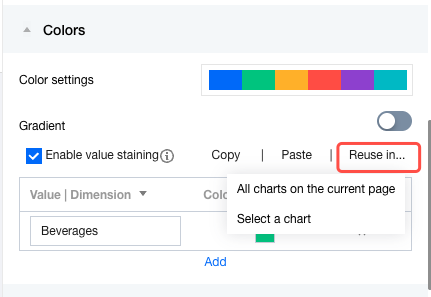
Batch Applications of Coloring Settings
If you need to apply the current dimension value settings to multiple components, you can use the "Reuse for..." feature to apply the coloring settings to multiple components in batches.
1. Complete the dimension value coloring settings, then click Copy to use.
All charts on the current page: Reuse the current coloring settings for all chart components on the current page.
Select chart: Users manually select which charts to reuse the current settings.
Note:
1. Not all chart components support dimension value coloring. If a component does not support dimension value coloring, the settings will not take effect even if the component is selected.
2. If the settings do not take effect after copying, you can perform troubleshooting and modifications by using the troubleshooting methods described above.
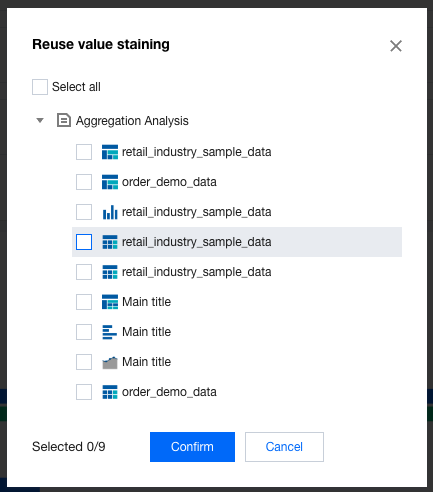
2. Click Select Chart, then choose the chart to reuse in the pop-up layer.